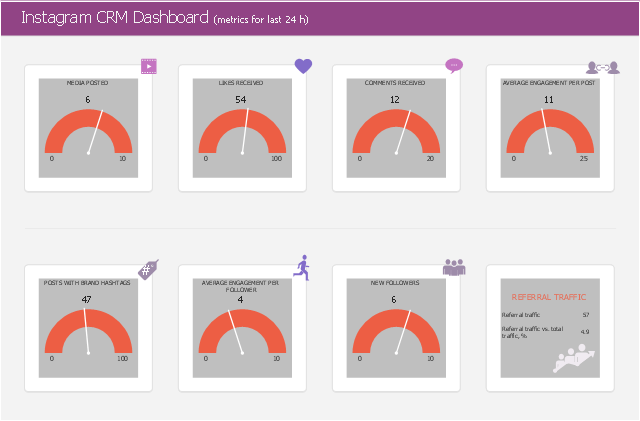
This social media customer service dashboard sample visualizes Instagram CRM business metrics and KPIs using graphic indicators.
"Social CRM metrics in applications.
Metrics for building awareness:
* web traffic
* search volume trends
* volume of followers
* social mentions
Metrics for increasing sales:
* website traffic
* social mentions
* volume of followers
* repeat visits
* social content acceptance rate
Metrics for assessing changes environment in an industry:
* Share of Voice: how much of the overall voice a single brand consumes." [Social CRM. Wikipedia]
The social CRM dashboard example "Instagram CRM Dashboard" was designed using ConceptDraw PRO software extended with CRM Center Dashboard solution from Management area of ConceptDraw Solution Park.
 HR Dashboard
The HR Dashboard solution extends ConceptDraw DIAGRAM functionality with powerful drawing tools and great collection of comprehensive vector design elements, icons, pictograms and objects, navigation elements, live objects of HR charts, HR indicators, and thematic maps. The range of HR Dashboards applications is extensive, among them the human resource management, recruitment, hiring process, human resource development. ConceptDraw DIAGRAM software is perfect for creation HR Dashboard with any goal you need. It gives you all opportunities for designing not only informative, but also professional looking and attractive HR Dashboards of any style and degree of detalization, that are perfect for using in presentations, reports and other thematic documents.
The vector stencils library "Sales KPIs and Metrics" contains 15 chart templates and graphic indicators of sales key performance indicators (KPIs) and metrics.
Use it for drawing sales dashboards in the ConceptDraw PRO diagramming and vector drawing software extended with the Sales Dashboard solution from the Marketing area of ConceptDraw Solution Park.
Use it for drawing sales dashboards in the ConceptDraw PRO diagramming and vector drawing software extended with the Sales Dashboard solution from the Marketing area of ConceptDraw Solution Park.
 CRM Center Dashboard
The CRM Center Dashboard solution extends ConceptDraw DIAGRAM functionality with CRM software tools, large collection of CRM Charts live objects, CRM icons, CRM indicators, CRM maps and navigation elements, the set of professionally designed CRM samples and templates to help you construct your own CRM Dashboards and CRM Center Dashboards in a few minutes, to depict the current and actual data by connecting or refreshing the data source file. The customer management software ConceptDraw DIAGRAM makes you free to choose the style for your dashboard and to regulate the quantity of clipart on the diagram according to your taste.
 Business Intelligence Dashboard
Business Intelligence Dashboard solution extends the ConceptDraw DIAGRAM functionality with exclusive tools, numerous ready-to-use vector objects, samples and quick-start templates for creation professional Business Intelligence Dashboards, Business Intelligence Graphics, Business Intelligence Charts and Maps of different kinds. Design easy the BI dashboard, BI model or Dynamic chart in ConceptDraw DIAGRAM to monitor the company's work, to track the indicators corresponding your company's data, to display and analyze key performance indicators, to evaluate the trends and regularities of the processes occurring at the company.
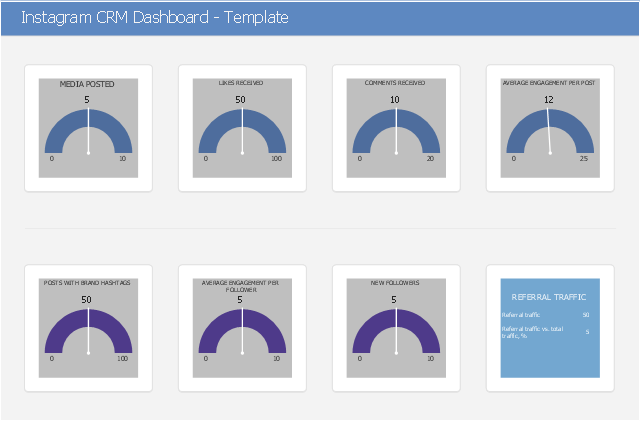
This social media customer service dashboard template uses graphic indicators (Gauge and Multi digital values) to visualize Instagram CRM business metrics and KPIs: Media posted, Likes received, Comments received, Average engagement per post, Posts with brand hashtags, Average engagement per follower, New followers, Referral traffic.
To set data source file for graphic indicator use Action menu.
Use this template to design your Instagram CRM dashboard with ConceptDraw PRO software.
The social CRM dashboard template "Instagram CRM Dashboard - Template" is included in CRM Center Dashboard solution from Management area of ConceptDraw Solution Park.
 Spatial Dashboard
The Spatial Dashboard solution extends ConceptDraw DIAGRAM software with templates, samples and vector stencils libraries with thematic maps for drawing visual dashboards showing spatial data. It also allows saving time and creating a dashboard simpler and quicker rather than to run a few different reports. The Spatial Dashboard solution is the one that helps to visualize the spatial info on Thematic Maps, showing the way some particular metric varies across territories.
Dashboard
ConceptDraw DIAGRAM extended with Sales Dashboard solution from the Marketing area of ConceptDraw Solution Park is a perfect software for creating the live dashboard for the business data and progress visualization.
 Status Dashboard
Status dashboard solution extends ConceptDraw DIAGRAM software with templates, samples and vector stencils libraries with graphic indicators for drawing the visual dashboards showing status data. The graphic Status Indicators (e.g., Alerts, Progress and Rating Indicators, and Traffic Lights) are the ones that can be always used by any ConceptDraw DIAGRAM user once taken from the mentioned solution.
KPI Dashboard
ConceptDraw DIAGRAM diagramming and vector drawing software supplied with Sales Dashboard solution from the Marketing area of ConceptDraw Solution Park provides the full set of useful tools which make it the best for producing the live KPI Dashboard of any complexity.
 Logistic Dashboard
The powerful tools of Logistic Dashboard solution and specially developed live graphic objects of logistic icons, logistic navigation elements, logistic indicators, logistic charts and logistic maps effectively assist in designing Logistic dashboards, Logistic maps, Logistic charts, diagrams and infographics. The included set of prebuilt samples and quick-start templates, demonstrates the power of ConceptDraw DIAGRAM software in logistics management, its assisting abilities in development, realization and analyzing the logistic processes, and in perfection the methods of logistics management.
 Sales Dashboard
Sales Dashboard solution extends ConceptDraw DIAGRAM software with templates, samples and library of vector stencils for drawing the visual dashboards of sale metrics and key performance indicators (KPI).
 Correlation Dashboard
Correlation Dashboard solution can be used while creating the dashboards in the ConceptDraw DIAGRAM diagramming and drawing software. This solution contains the set of the Live Objects that were designed for helping to visualize a predictive relationship between two numerical parameters of items from one or few series by using the Scatter Plot Charts.
The vector stencils library "Sales KPIs and Metrics" contains 15 chart templates and graphic indicators of sales key performance indicators (KPIs) and metrics.
Use it for drawing sales dashboards in the ConceptDraw PRO diagramming and vector drawing software extended with the Sales Dashboard solution from the Marketing area of ConceptDraw Solution Park.
Use it for drawing sales dashboards in the ConceptDraw PRO diagramming and vector drawing software extended with the Sales Dashboard solution from the Marketing area of ConceptDraw Solution Park.
 Business Management Package
Business Management Package is a large set of graphical solutions from the ConceptDraw Solution Park. They are selected to help in solving the business, management, marketing and quality tasks in a best way. It is useful for many management specialists, marketing experts, business specialists, international business experts, IT managers, specialists in managing the business processes, financial specialists, and other business related specialists. Create documents, reports, statistical summaries, describe business processes, build business models for many fields including finance, education, logistic, landscape design, health, cooking, and many more.
The vector stencils library "Sales KPIs and Metrics" contains 15 chart templates and graphic indicators of sales key performance indicators (KPIs) and metrics for drawing sales dashboards: line charts "Cost per order" and "Clicks from Sales Follow-Up Emails", column charts "Social Media Usage" and "Usage Rate of Marketing Collateral", horizontal bar charts "Rate of Follow Up Contact", "Cost per customer" and "Lead Response Time", pie charts "Product mix", "Product Performance" and "Rate of Contact", gauge (speedometer) indicators "Sales Growth" and "Actual vs Plan", bullet indicator "Sales Target", diamond alarm indicators "Average Purchase Value", "Quote to Close Ratio", "Opportunity-to-Win Ratio" and "Sales Ratio".
The dashboard charts and indicators example "Design elements - Sales KPIs and metrics" for the ConceptDraw PRO diagramming and vector drawing software is included in the Sales Dashboard solution from the Marketing area of ConceptDraw Solution Park.
www.conceptdraw.com/ solution-park/ marketing-sales-dashboard
 Project Management Package
Project Management Package includes a large set of graphical solutions from the ConceptDraw Solution Park. They are selected specially to help in completing the business and management goals, creating business models and modeling business processes, analyzing business progress and efficiency of projects implementation. The tools of this package's solutions are helpful to create number of diagrams and dashboards including Management Diagrams, Business diagrams, Bubble diagrams, Circle-spoke diagrams, Circular arrows diagrams, Venn diagrams, Scrum charts, Kanban boards, Business Intelligence maps, Business Metric charts, Dynamic charts, Project diagrams, Hierarchical charts, Influence diagrams, Work Breakdown Structures (WBS), Resource Breakdown Structures (RBS), PERT Diagrams, Project management charts, Project timelines, Gantt Charts, Funnel diagrams, Stakeholder Onion diagrams, and many more.
 Wireless Networks
The Wireless Networks Solution extends ConceptDraw DIAGRAM software with professional diagramming tools, set of wireless network diagram templates and samples, comprehensive library of wireless communications and WLAN objects to help network engineers and designers efficiently design and create Wireless network diagrams that illustrate wireless networks of any speed and complexity, and help to identify all required equipment for construction and updating wireless networks, and calculating their costs.
 Funnel Diagrams
Funnel Diagrams solution including wide range of Funnel diagram samples, Sales funnel examples, and vector design elements, makes the ConceptDraw DIAGRAM ideal for managing funnel and creating the Funnel diagrams of various types and designs, AIDA Model, AIDAS, ACCA Dagmar, Rossiter-Percy Model, sales funnel, marketing funnel, search funnel, brand funnel, purchase funnel, lead funnel, conversion funnel, business funnel, etc. You can place the funnel object horizontally or vertically, you can use the objects with the desired number of sales funnel stages. You can also change their size, color fill and other parameters to make the Funnel diagrams look extremely suitable to your desires.
 Line Graphs
The Line Graphs solution extends the capabilities of ConceptDraw DIAGRAM with professionally designed templates, samples, and a library of vector stencils for drawing perfect Line Graphs. Turn your data into a Line Graph with ConceptDraw DIAGRAM software and use it in any document, presentation, report, share it with your team, etc. Building several curves on the same chart, it is recommended to paint them with different colors, this will allow to separate them visually from each other and will make it easier the data comparison.
- KPIs and Metrics | Business Intelligence Dashboard | CRM Center ...
- CRM Center Dashboard | Facebook CRM Dashboard - Template ...
- Instagram CRM Dashboard - Template | Twitter CRM Dashboard ...
- Sales workflow | Sales KPIs and Metrics | Social Media Response
- CRM Center Dashboard | How To Create a CRM System Dashboard ...
- Logistics KPI Dashboard | Logistics Performance Dashboard | Sales ...
- How To Create a CRM System Dashboard | CRM Center Dashboard ...
- Hr Metrics Dashboard Example
- Design elements - Sales KPIs and metrics | Dashboard Metric Designs
- Logistic Dashboard | Logistics KPI Dashboard | How to Make a ...


