Control and Information Architecture Diagrams (CIAD) with ConceptDraw PRO
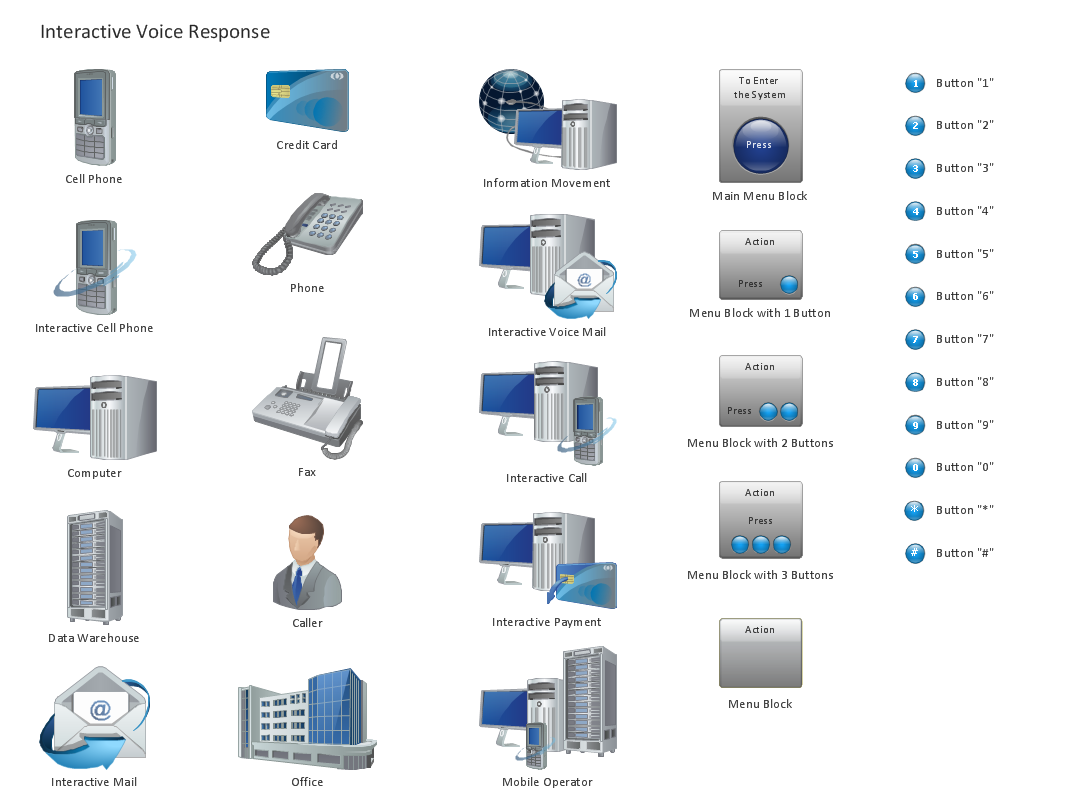
One of the three main constituents of any enterprise is the Control and Information Architecture. The rest two are Production facilities and People and Organization.Design Element: IVR for Network Diagrams
ConceptDraw PRO is perfect for software designers and software developers who need to draw IVR Network Diagrams.
 Telecommunication Network Diagrams
Telecommunication Network Diagrams solution extends ConceptDraw PRO software with samples, templates, and great collection of vector stencils to help the specialists in a field of networks and telecommunications, as well as other users to create Computer systems networking and Telecommunication network diagrams for various fields, to organize the work of call centers, to design the GPRS networks and GPS navigational systems, mobile, satellite and hybrid communication networks, to construct the mobile TV networks and wireless broadband networks.
Interactive Voice Response Network Diagram
ConceptDraw solution Computer and Networks provides Interactive Voice Response samples, templates and library of 35 vector stencils for drawing the IVR network diagrams. Use ConceptDraw PRO diagramming and vector drawing software enhanced with solution Computer and Networks to visualize the logical and physical structure of IVR systems for inbound and outbound call centers and voice mail systems.
 Interactive Voice Response Diagrams
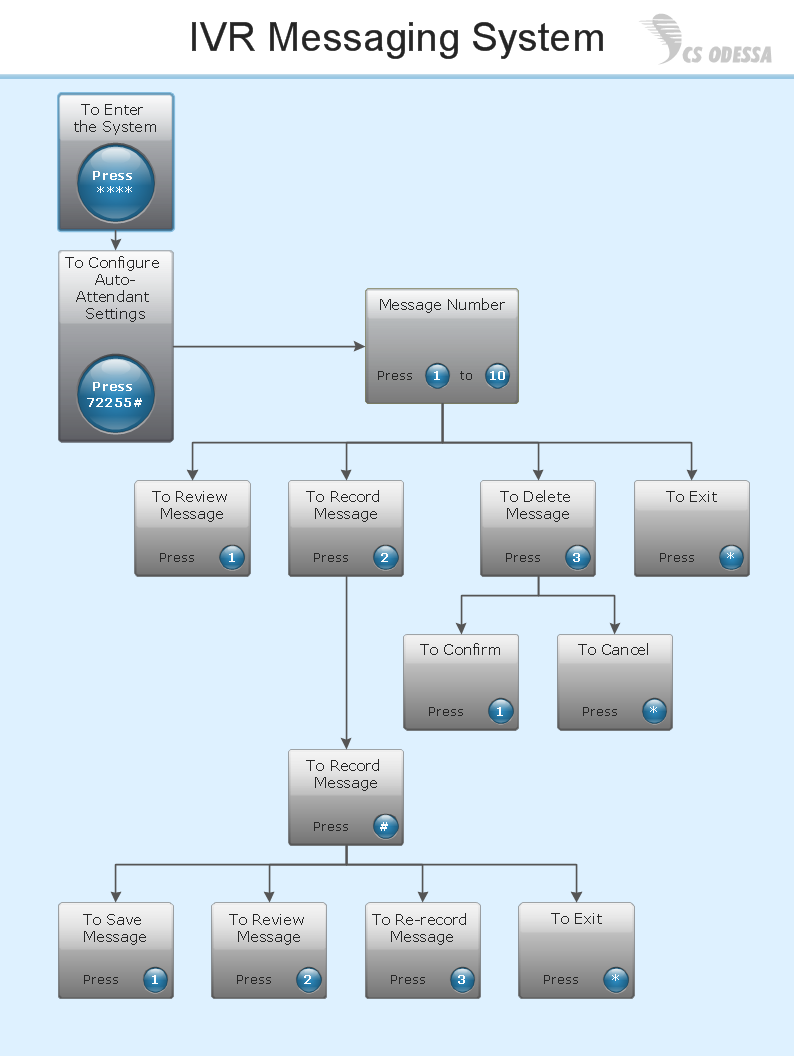
Interactive Voice Response Diagrams solution extends ConceptDraw PRO v10 software with samples, templates and libraries of ready-to-use vector stencils that help create Interactive Voice Response (IVR) diagrams illustrating in details a work of interactive voice response system, the IVR system’s logical and physical structure, Voice-over-Internet Protocol (VoIP) diagrams, and Action VoIP diagrams with representing voice actions on them, to visualize how the computers interact with callers through voice recognition and dual-tone multi-frequency signaling (DTMF) keypad inputs.
ConceptDraw Arrows10 Technology
How should diagramming software work? Is it possible to develop a diagram as quickly as the ideas come to you? The innovative ConceptDraw Smart Connectors Technology - This is more than enough versatility to draw any type of diagram with any degree of complexity. Connection points are necessary for diagramming network, flowchart and organizational charts. In ConceptDraw you connect shapes by attaching, or snapping and gluing, connectors to shape connection points.
 Business Intelligence Dashboard
Business Intelligence Dashboard solution extends the ConceptDraw PRO v11 functionality with exclusive tools, numerous ready-to-use vector objects, samples and quick-start templates for creation professional Business Intelligence Dashboards, Business Intelligence Graphics, Business Intelligence Charts and Maps of different kinds. Design easy the BI dashboard, BI model or Dynamic chart in ConceptDraw PRO to monitor the company's work, to track the indicators corresponding your company's data, to display and analyze key performance indicators, to evaluate the trends and regularities of the processes occurring at the company.
 Meter Dashboard
Meter dashboard solution extends ConceptDraw PRO software with templates, samples and vector stencils library with meter indicators for drawing visual dashboards showing quantitative data.
- Call Center Flow Diagram
- Voice And Data Diagram
- Flowchart Of Call Center Flow
- Call Center Process Flow Chart
- Flow Chart Diagram Of A Company From Call Center Industry Using
- Process Flowchart | Symboles Organigramme | Taxi Call Center ...
- Call Center Process Flow Diagram
- Hotel Network Topology Diagram | Ring Network Topology | Call ...
- Call Center Work Flow Chart
- Taxi Service Data Flow Diagram DFD Example | Taxi order process ...
- Ivr Flow Diagram
- Design Element: IVR for Network Diagrams | Data Flow Diagram ...
- Visio Ivr Call Flow Template
- Call center network diagram | Network Diagram Examples | How to ...
- Call center network diagram | IVR Network Diagram | Interactive ...
- Example of DFD for Online Store ( Data Flow Diagram ) DFD ...
- Call center network diagram | IVR Network Diagram ...
- Data Flow Diagram For Calling System
- Call center network diagram | Rack Diagrams | Telecommunication ...


