 Event-driven Process Chain Diagrams
Event-driven Process Chain (EPC) Diagram is a type of flowchart widely used for modeling in business engineering and reengineering, business process improvement, and analysis. EPC method was developed within the Architecture of Integrated Information Systems (ARIS) framework.
 Value Stream Mapping
Value stream mapping solution extends ConceptDraw PRO software with templates, samples and vector stencils for drawing the Value Stream Maps (VSM) in lean manufacturing practice.
 Cafe and Restaurant Floor Plans
Restaurants and cafes are popular places for recreation, relaxation, and are the scene for many impressions and memories, so their construction and design requires special attention. Restaurants must to be projected and constructed to be comfortable and e
HelpDesk
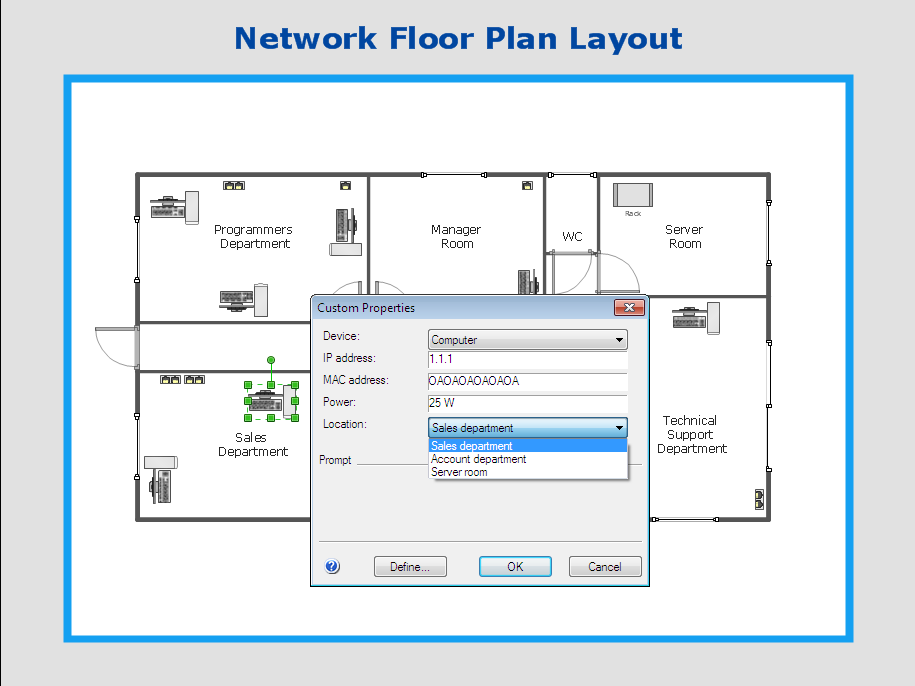
How to Work with Custom Properties in ConceptDraw PRO on PC
ConceptDraw PRO can store additional, user-defined data that can be assigned to a particular shape. This data is stored in the Custom Properties options.
 Windows 10 User Interface
Windows 10 User Interface solution extends significantly ConceptDraw PRO v11 functionality with look-and-feel functions of GUI software and makes it a great assistant for Win10 designers, developers, and software engineers. This solution provides a wide s
HelpDesk
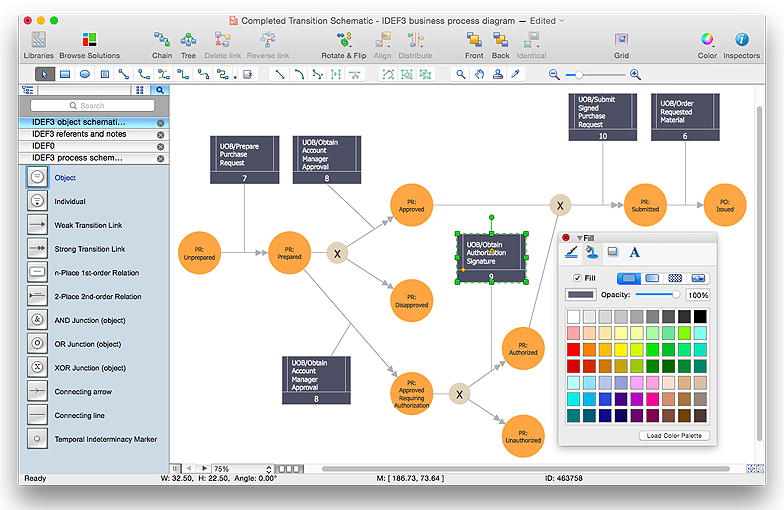
How to create an IDEF3 diagram using ConceptDraw PRO
IDEF3 is a member of the IDEF family of modeling methods that can be used to describe operations in a business process. An IDEF3 diagram provides a description of actual process flow within an organization or business, or the changes that occur to an object within that system. This method of knowledge capture is recorded in two different perspectives - users are able to create both process schematics and object schematics using the IDEF3 schematic symbols. ConceptDraw has created a solution that collects all symbols necessary to create professional IDEF3 diagrams. IDEF methodology is suitable for almost any form of business, and for anyone who needs to record enterprise architecture in a process driven manner. The IDEF Business Process Diagram solution and ConceptDraw PRO cater for these needs, giving both beginner and experienced users the tools they need to create effective business process diagrams.Is ConceptDraw PRO an Alternative to Microsoft Visio?
Visio for Mac and Windows - ConceptDraw as an alternative to MS Visio. ConceptDraw PRO delivers full-functioned alternative to MS Visio. ConceptDraw PRO supports import of Visio files. ConceptDraw PRO supports flowcharting, swimlane, orgchart, project chart, mind map, decision tree, cause and effect, charts and graphs, and many other diagram types.HelpDesk
How to Draw the Different Types of Pie Charts
Using the Pie Chart, you can visually estimate the relative contribution that different data categories contribute to a whole value. The pie chart displays the statistics in a visual format. The main use of pie charts to show comparisons. The larger piece of the pie, the more the value of this value compared to the rest. Various applications of pie charts can be found in business and education. For business, pie charts can be used to compare the success or failure of the goods or services. They may also be used to display the business market share.- Data Flow Diagram Symbols . DFD Library | Basic Flowchart ...
- ERD Symbols and Meanings | Entity Relationship Diagram Symbols ...
- Dfd Symbols And Meanings
- Entity Relationship Diagram Symbols and Meaning ERD Symbols ...
- Data Flow Diagrams | Entity Relationship Diagram Examples ...
- Basic Flowchart Symbols and Meaning | Database Flowchart ...
- Entity Relationship Diagram Symbols
- ERD Symbols and Meanings | Entity-Relationship Diagram (ERD ...
- Design elements - Data Flow Diagram (DFD) | How to Create ...
- ERD Symbols and Meanings | Building Drawing Software for Design ...
- ERD Symbols and Meanings | Entity Relationship Diagram ...
- Basic Flowchart Symbols and Meaning | Data Flow Diagram ...
- Process Flowchart | Data Flow Diagram | Entity Relationship ...
- Entity Relationship Diagram Symbols | ERD Symbols and Meanings ...
- Flowchart design. Flowchart symbols , shapes , stencils and icons ...
- Gane Sarson Diagram | Data Flow Diagram Process | Data Flow ...
- Workflow Diagram Symbols | Graphical Symbols to use in EPC ...
- Basic Flowchart Symbols and Meaning | Entity Relationship ...
- Block Diagram | Basic Flowchart Symbols and Meaning ...
- Data Flow Diagrams


