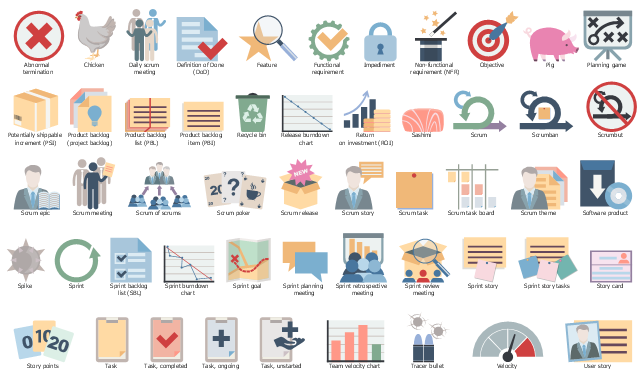
The vector stencils library "Scrum artifacts" contains 52 icons.
Use this clipart set to design your agile software development diagrams and infographics with ConceptDraw PRO software.
"Product backlog
The product backlog comprises an ordered list of requirements that a scrum team maintains for a product. It consists of features, bug fixes, non-functional requirements, etc.—whatever must be done to successfully deliver a viable product. The product owner orders the product backlog items (PBIs) based on considerations such as risk, business value, dependencies, and date needed. ...
Sprint backlog
The sprint backlog is the list of work the development team must address during the next sprint. The list is derived by the scrum team selecting product backlog items from the top of the product backlog until the development team feels it has enough work to fill the sprint. This is done by the development team asking "Can we also do this?" and adding product backlog items to the sprint backlog. The development team should keep in mind its past performance assessing its capacity for the new sprint, and use this as a guide line of how much "effort" they can complete.
The product backlog items may be broken down into tasks by the development team. Tasks on the sprint backlog are never assigned; rather, tasks are signed up for by the team members as needed according to the set priority and the development team member skills. This promotes self-organization of the development team, and developer buy-in. ...
Sprint burn-down chart
The sprint burndown chart is a public displayed chart showing remaining work in the sprint backlog. Updated every day, it gives a simple view of the sprint progress. ...
Release burn-down chart
The release burndown chart is the way for the team to track progress and provide visibility. The release burndown chart is updated at the end of each sprint by the scrum master. The horizontal axis of the release burndown chart shows the sprints; the vertical axis shows the amount of work remaining at the start of each sprint." [Scrum (software development). Wikipedia]
The clip art sample "Design elements - Scrum artifacts" is included in the Scrum solution from the Project Management area of ConceptDraw Solution Park.
HelpDesk
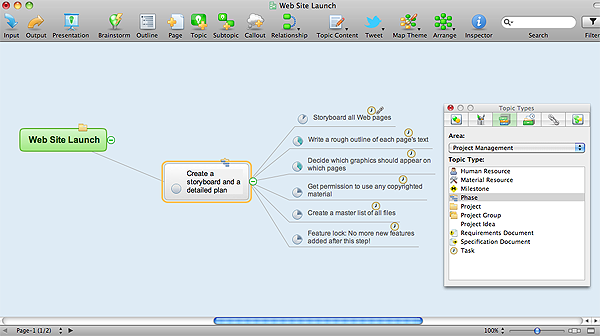
How to Create an Effective Mind Map Using Topic Types
Tips on how to increase mind map effectiveness using Topic Types functionality, delivered with ConceptDraw MINDMAP.
 iPhone User Interface
iPhone User Interface solution extends ConceptDraw PRO v10 software with templates, samples and libraries with large quantity of vector stencils of graphical user interface elements, Apps icons, UI patterns for designing and prototyping of the iOS applic
HelpDesk
How to Format Topics
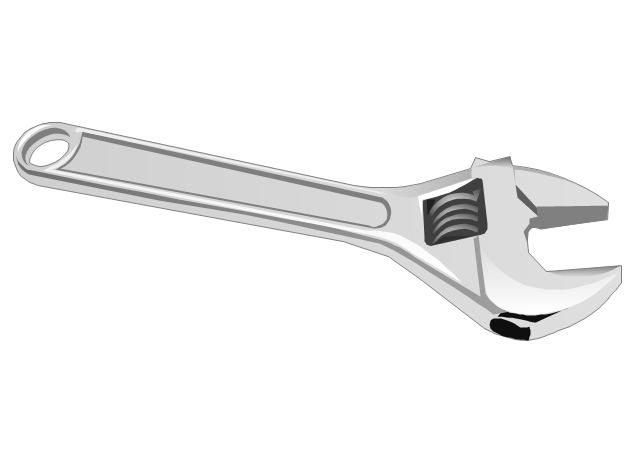
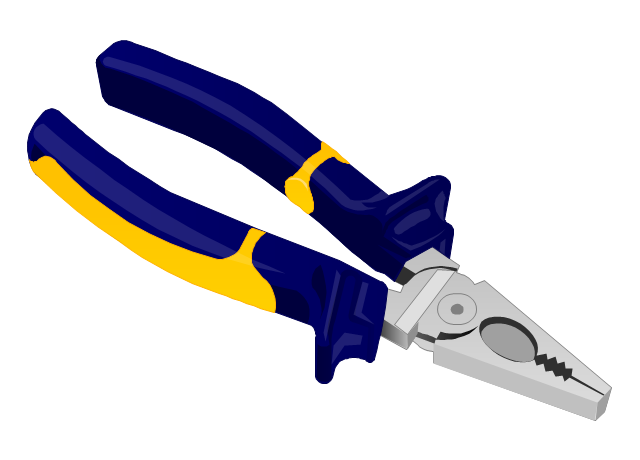
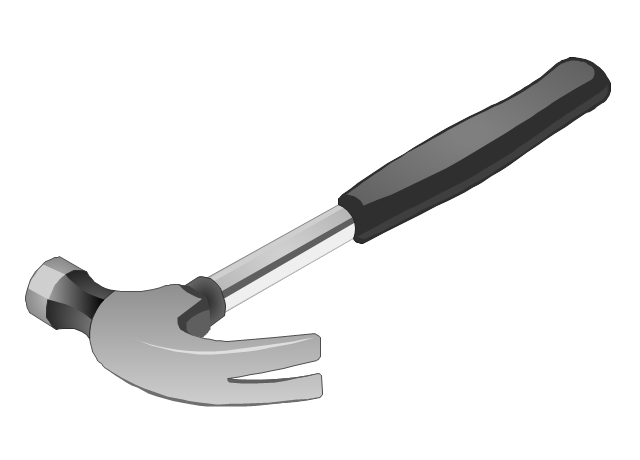
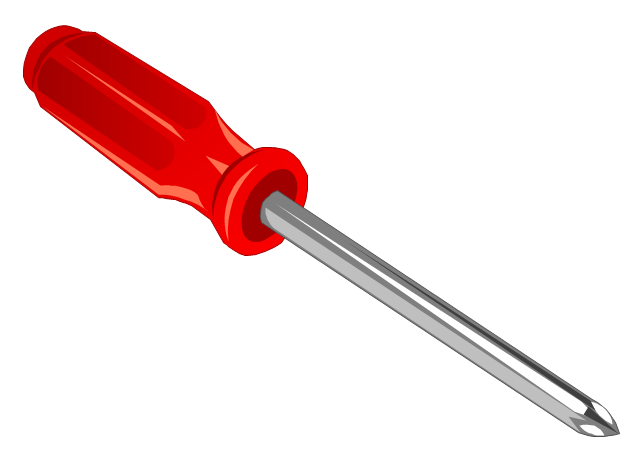
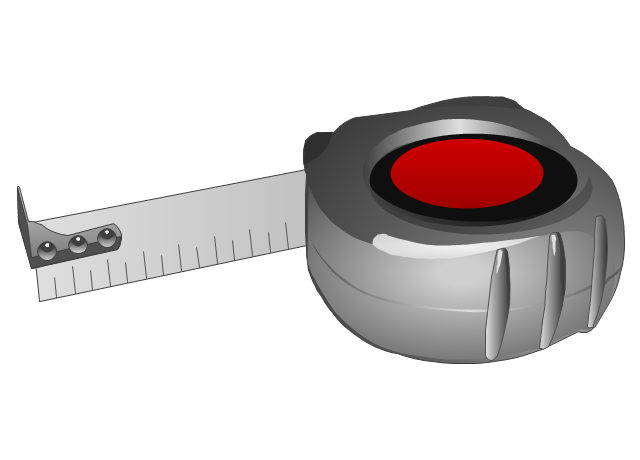
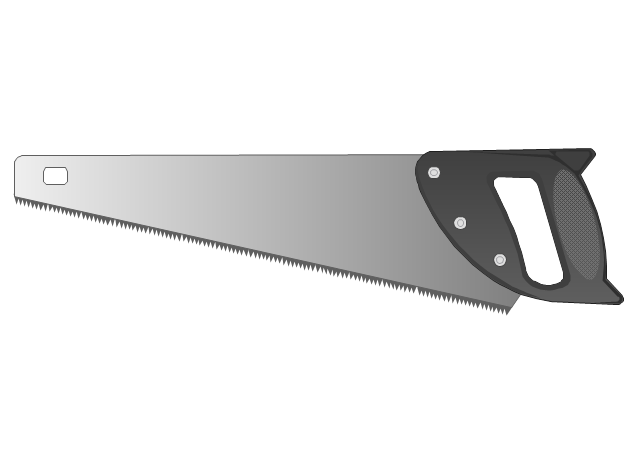
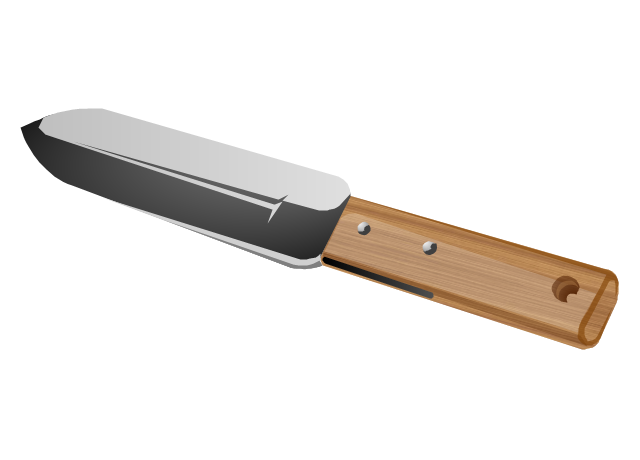
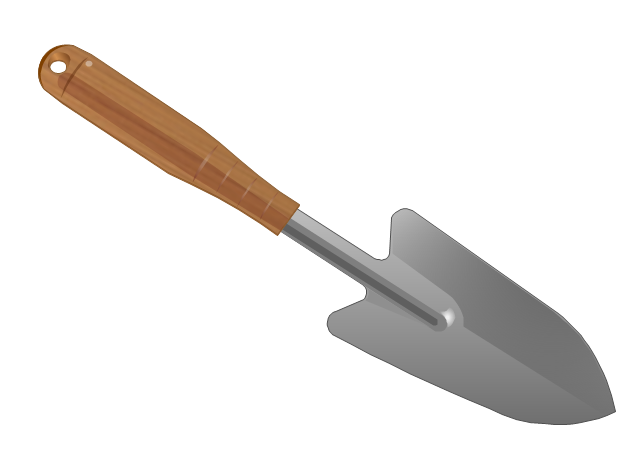
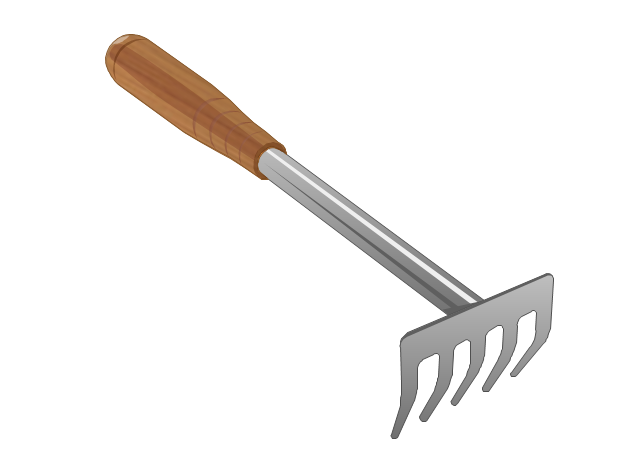
ConceptDraw MINDMAP enables you to change the form and color of a mind map topics. Here is the tips on how to edit mind map appearance quickly by changing topic's form and color.The vector stencils library "Tools" contains 11 clipart images of hand tools and instruments for drawing illustrations.
"A tool is any physical item that can be used to achieve a goal, especially if the item is not consumed in the process. Informally the word is also used to describe a procedure or process with a specific purpose. Tool use by humans dates back millions of years, and other animals are also known to employ simple tools.
Tools that are used in particular fields or activities may have different designations such as "instrument", "utensil", "implement", "machine", or "apparatus". The set of tools needed to achieve a goal is "equipment". The knowledge of constructing, obtaining and using tools is technology." [Tool. Wikipedia]
The clip art example "Tools - Vector stencils library" was created in ConceptDraw PRO diagramming and vector drawing software using the Manufacturing and Maintenance solution from the Illustration area of ConceptDraw Solution Park.
How To Do A Mind Map In PowerPoint
ConceptDraw MINDMAP - an excellent tool for exporting mind maps to PowerPoint to visualize and presenting your project. You can simply generate, change, update your mindmap and then make a presentation in PowerPoint.The vector stencils library "Time and clock pictograms" contains 20 time pictograms: clocks, calendars, day, week, bell, alarm clock, hourglass, wristwatch, and time intervals symbols.
Use it to create temporal infographic, illustrations and diagrams.
The example "Time and clock pictograms - Vector stencils library" was created using the ConceptDraw PRO diagramming and vector drawing software extended with the Pictorial infographics solution from the area "What is infographics" in ConceptDraw Solution Park.
UML Use Case Diagram. Design Elements
UML Use Case Diagrams are used to illustrate the structure of arbitrarily complex systems and illustrates the service consumer - service provider relationship between components.
 Entity-Relationship Diagram (ERD)
Entity-Relationship Diagram (ERD) solution extends ConceptDraw PRO software with templates, samples and libraries of vector stencils from drawing the ER-diagrams by Chen's and crow’s foot notations.
Mind Map Making Software
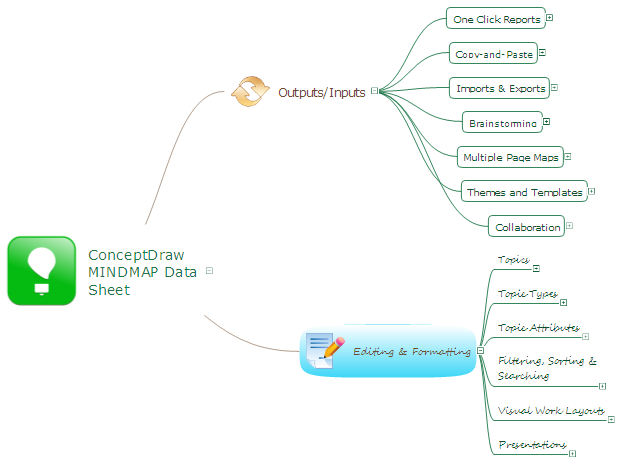
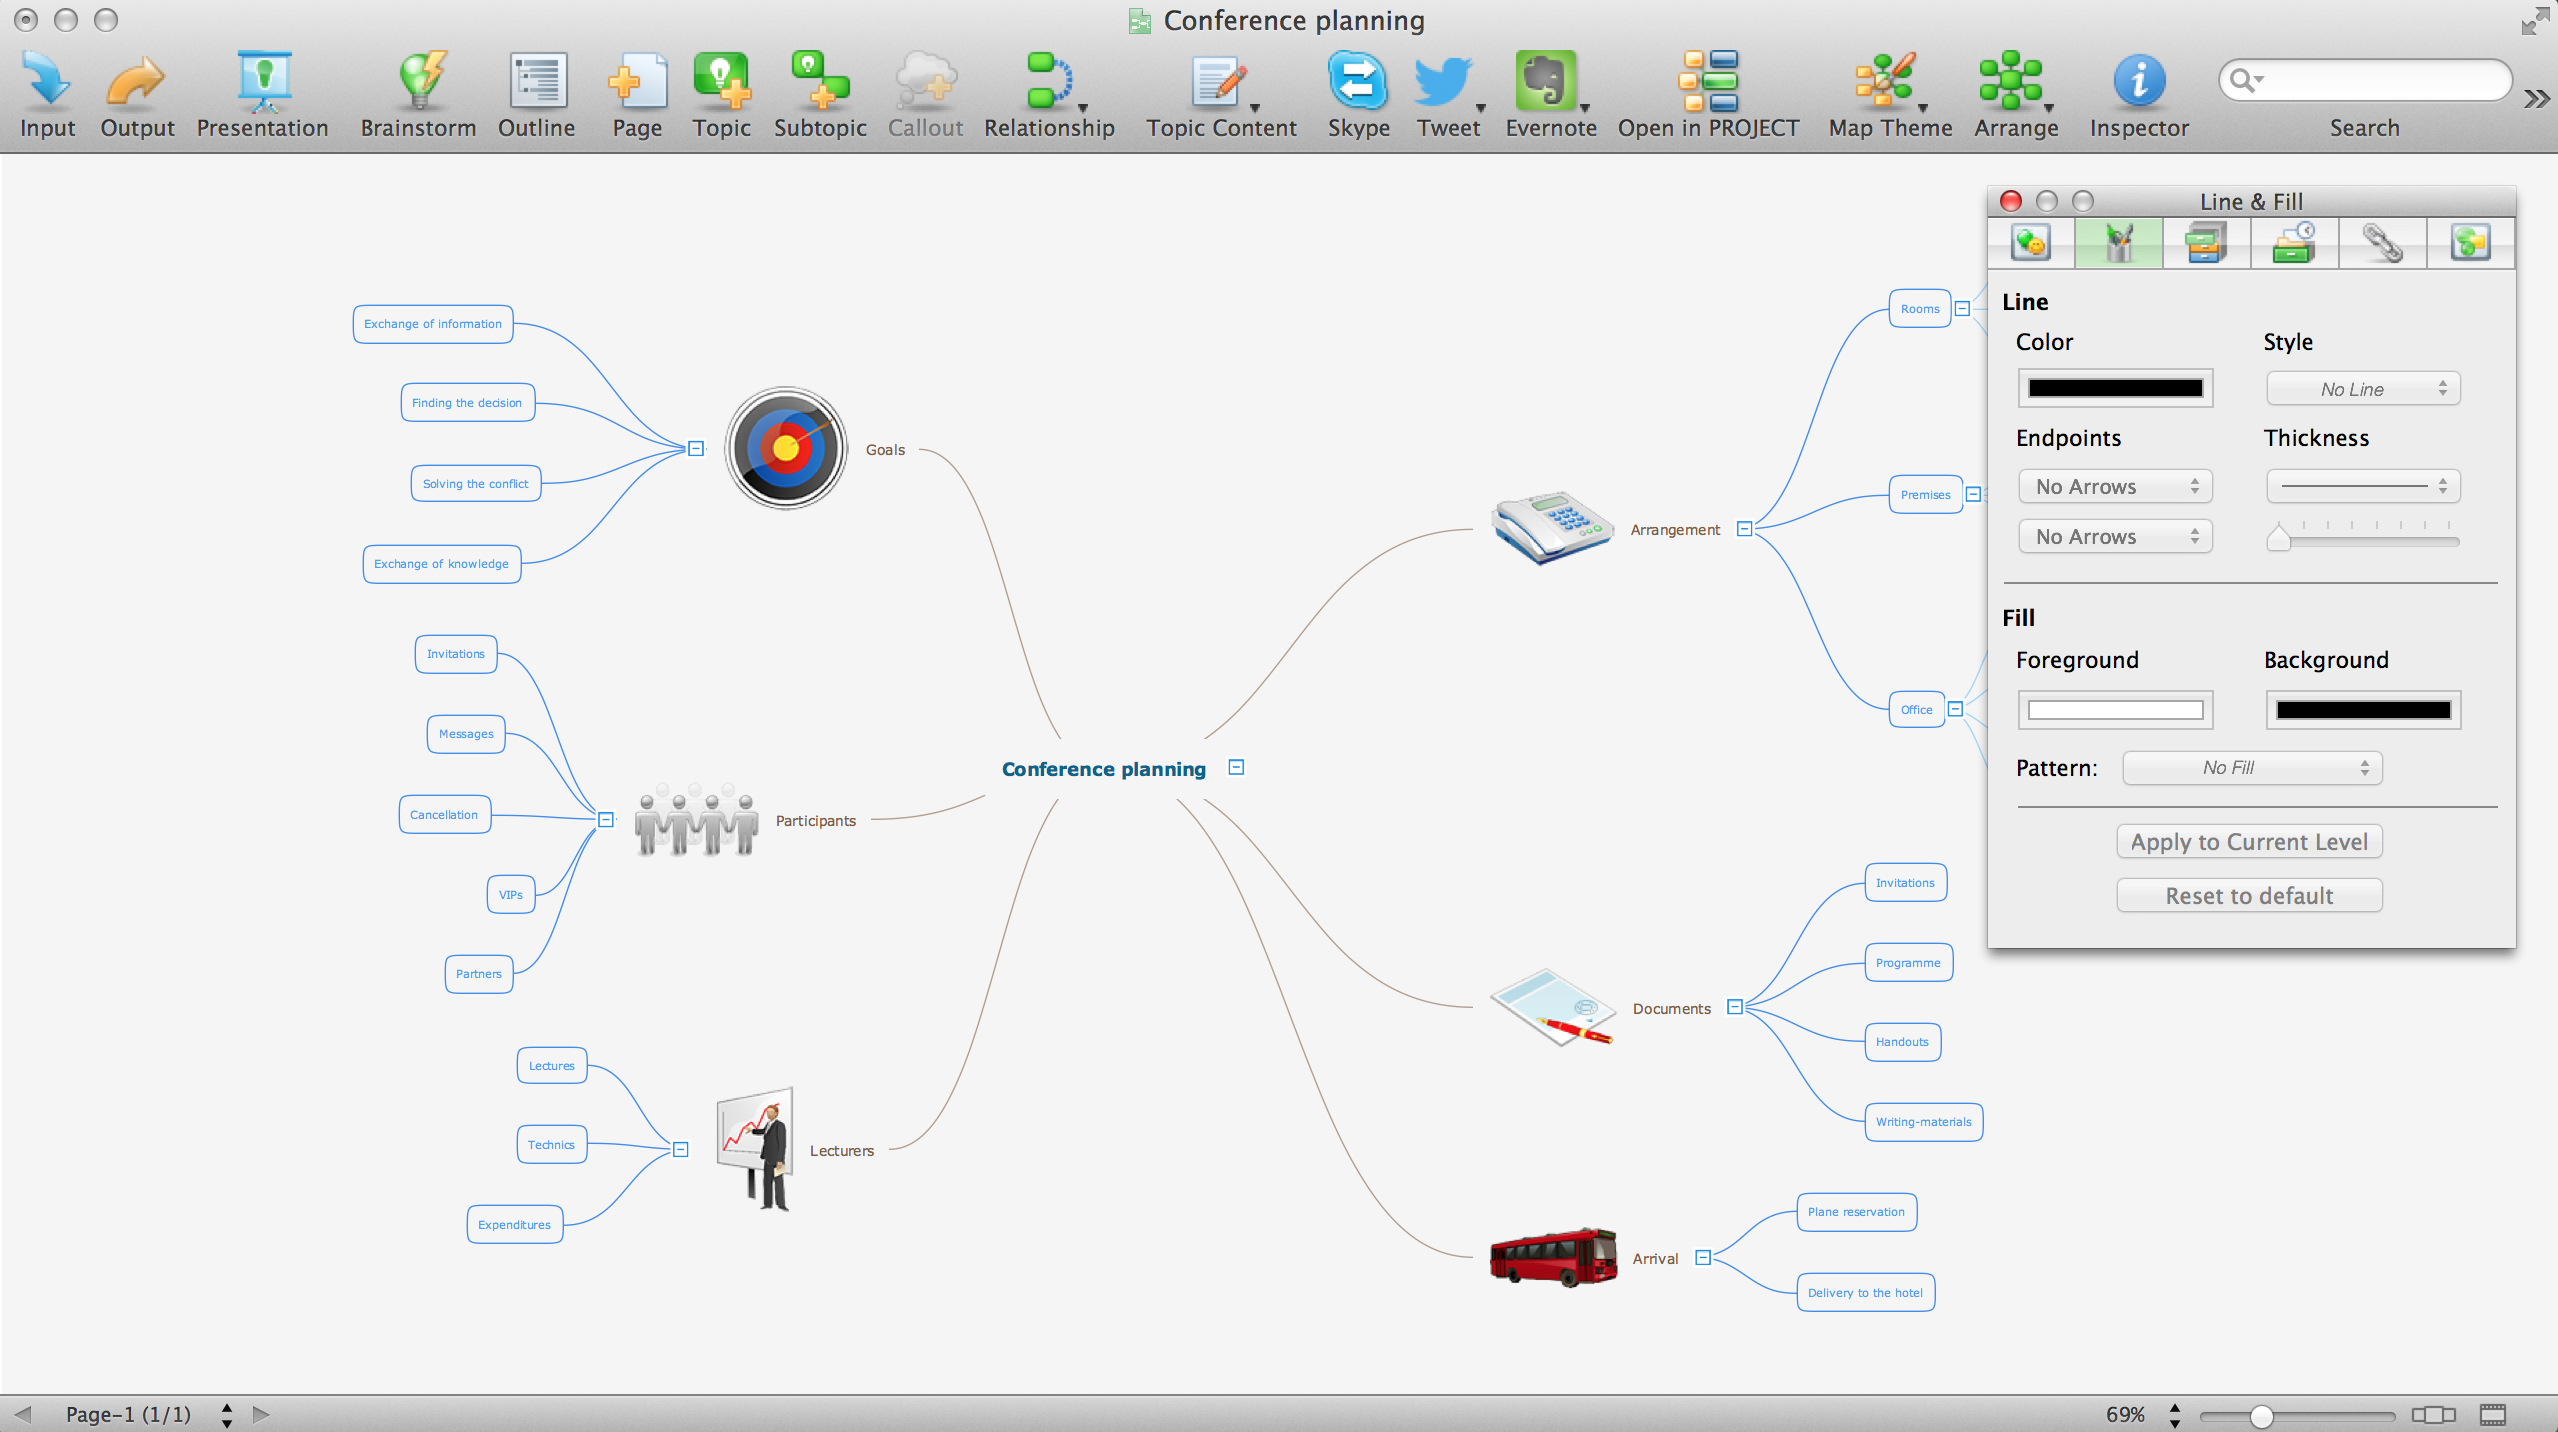
ConceptDraw MINDMAP is a powerful Mind Map making software, effective business and personal productivity application, which provides professional tools for thinking, brainstorming, generating and organizing ideas and data, for project planning, problem solving and many other tasks. ConceptDraw MINDMAP possess power, economy, and versatility, which help to raise personnel and team productivity. ConceptDraw MINDMAP allows you effectively generate, change, and update the Mind Maps. It provides variety of input and output solutions that allow create, change and share the Mind Maps quickly, simply and effectively. The use of desired Input template lets you create your own Mind Map in one moment. Discover today wide output and input capabilities of ConceptDraw MINDMAP. It lets to input the data from MS PowerPoint, MS Word, MS Project, XMind, MindManager, OPML and Text Outline sources, and also output your Mind Maps to MS PowerPoint, MS Word, MS Project, save as PDF, Web-page, Text Outline, RTF, OPML, or image.
 MindTweet
This solution extends ConceptDraw MINDMAP software with the ability to brainstorm, review and organize the sending of Tweets.
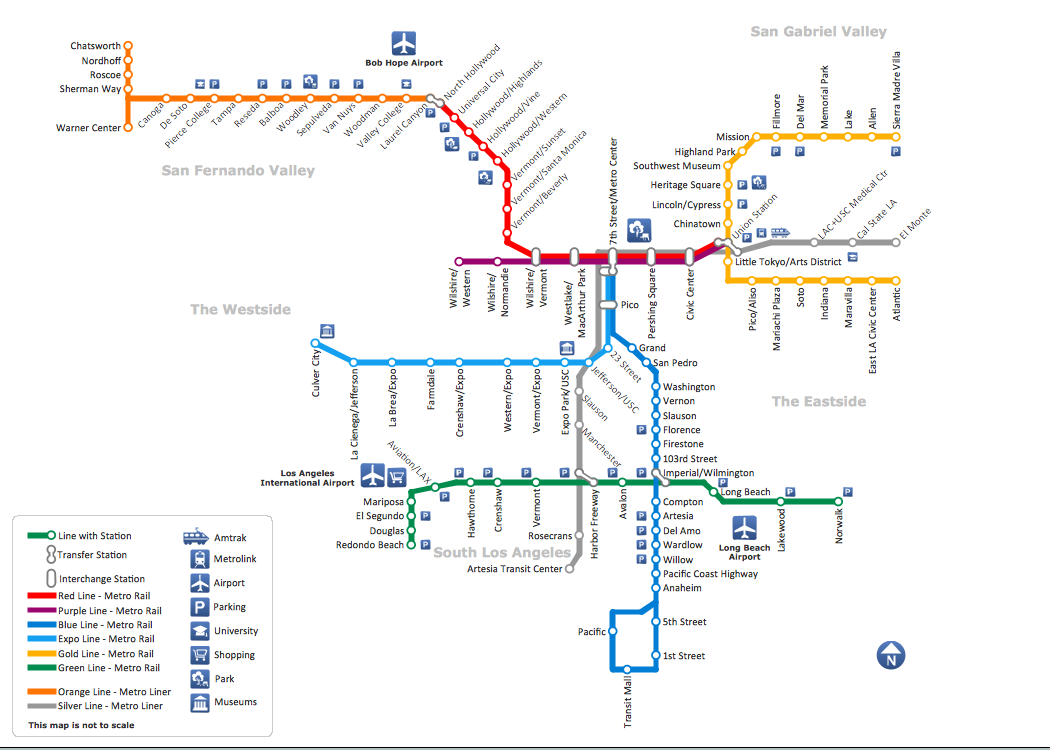
How to draw Metro Map style infographics? (Los Angeles)
Tool to draw Metro Map styled inforgraphics. Los Angeles Metro Rail and Liner sample. This is a one-click tool to add stations to the map. It lets you control the direction in which you create new stations, change lengths, and add text labels and icons. It contains Lines, Stations, and Landmarks objects.Geo Map - South America - Peru
Peru, officially the Republic of Peru, is a country in western South America. The history of Peru goes back to the distant past and its divided into several main stages. Geography of Peru is also diverse - there is a desert, as well as the ocean coast, and of course the mountain ranges. The Continent Maps solution from Maps area of ConceptDraw Solution Park provides stencil library Peru, which is made up of well-designed vector shapes delivering easy experience in creating diagrams with ConceptDraw Pro software. All ConceptDraw PRO documents are vector graphic files and are available for reviewing, modifying, and converting to a variety of formats: image, HTML, PDF file, MS PowerPoint Presentation, Adobe Flash, MS Visio (.VDX, .VSDX).
 Audio, Video, Media
Use it to make professional-looking documents, impressive presentations, and efficient websites with colorful and vivid illustrations and schematics of digital audio, video and photo gadgets and devices, audio video connections and configurations, S Video connection, HD and 3D television systems, home entertainment systems, Closed-circuit television (CCTV) surveillance systems. All audio video schematics, drawings and illustrations designed in ConceptDraw PRO are professional looking, clear and understandable for all thanks to applying the most commonly used standards of designations, and are effective for demonstrating in front of a small audience and on the big screens.
- Procedure Clipart Png
- Pistol Drill Png
- Nail Png Vector
- Time Png Clipart
- Nail Clipart Png
- Team Clipart Png
- To Do List Clip Art Png
- Nail Vector Png
- Spanner Png Images
- Screw Driver Png
- Progress Bar Images Png
- Work Clipart Png
- Png Photo Modal
- Clipart Chart Png
- Rake Png
- Green Frame Png
- Clipart Watch Png
- Post Money Icon Png
- Half Circle Png
- Scrum Team Icon Png
