Workflow Diagram

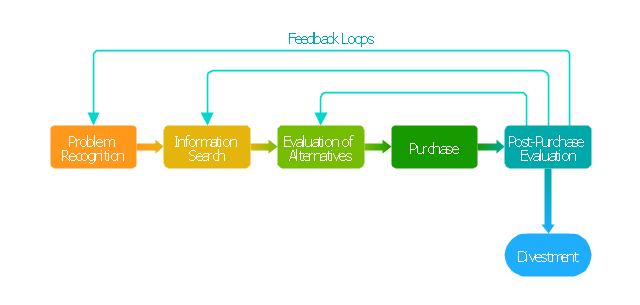
"Decision-making can be regarded as the cognitive process resulting in the selection of a belief and/ or a course of action among several alternative possibilities. Every decision-making process produces a final choice that may or may not prompt action. ...
Decision-making can also be regarded as a problem-solving activity terminated by a solution deemed to be satisfactory. It is, therefore, a reasoning or emotional process which can be rational or irrational and can be based on explicit assumptions or tacit assumptions. Most decisions are followed by some form of cost-benefit analysis. Rational choice theory encompasses the notion that people try to maximize benefits while minimizing costs.
Some have argued that most decisions are made unconsciously, if not involuntarily. Jim Nightingale, author of Think Smart – Act Smart, states that "we simply decide without thinking much about the decision process. ...
A major part of decision-making involves the analysis of a finite set of alternatives described in terms of evaluative criteria. Information overload occurs when there is a substantial gap between the capacity of information and the ways in which people may or can adapt."" [Decision-making. Wikipedia]
The block diagram example "Customer decision making" was created using the ConceptDraw PRO diagramming and vector drawing software extended with the Block Diagrams solution from the area "What is a Diagram" of ConceptDraw Solution Park.
Block diagram
 Block Diagrams
Block diagrams solution extends ConceptDraw DIAGRAM software with templates, samples and libraries of vector stencils for drawing the block diagrams.
Basic Flowchart Symbols and Meaning


Block Diagram Software

IDEF3 Standard

Swot Analysis Examples

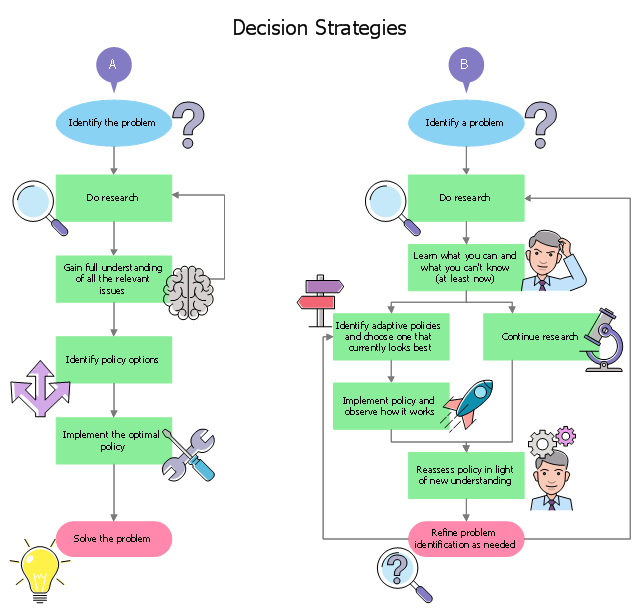
This example was designed on the base of Wikimedia Commons file: Block diagram showing an iterative and adaptive decision strategy (US CCSP).svg.
"These block diagrams show two decision strategies:
A is a decision strategy in which nothing is done until research resolves all key uncertainties
B is an iterative and adaptive decision strategy, where action is taken before all key uncertainties are resolved."
[commons.wikimedia.org/ wiki/ File:Block_ diagram_ showing_ an_ iterative_ and_ adaptive_ decision_ strategy_ (US_ CCSP).svg]
"Granger Morgan et al. (2009) recommend that an appropriate response to deep uncertainty is to adopt an iterative and adaptive decision-making strategy. This contrasts with a strategy in which no action is taken until research resolves all key uncertainties." [Economics of global warming. Wikipedia]
The flowchart example "Decision strategies" was designed using ConceptDraw software extended with Decision Making solution from Management area of ConceptDraw Solution Park.
Decision diagram example
Business Diagram Software


The vector stencils library "HR flowchart" contains 62 flowchart symbols.
Use it to draw your HR flowcharts, workflow diagrams and process charts with the ConceptDraw PRO diagramming and vector drawing software.
The flow chart symbols library "HR flowchart" is included in the HR Flowcharts solution from the Management area of ConceptDraw Solution Park.
Use it to draw your HR flowcharts, workflow diagrams and process charts with the ConceptDraw PRO diagramming and vector drawing software.
The flow chart symbols library "HR flowchart" is included in the HR Flowcharts solution from the Management area of ConceptDraw Solution Park.
Annotation

Card

Check / audit (diamond)
-hr-flowchart---vector-stencils-library.png--diagram-flowchart-example.png)
Check / audit (square)
-hr-flowchart---vector-stencils-library.png--diagram-flowchart-example.png)
Collate

Comment / note symbol (brace)
-hr-flowchart---vector-stencils-library.png--diagram-flowchart-example.png)
Communication link

Compare (diamond)
-hr-flowchart---vector-stencils-library.png--diagram-flowchart-example.png)
Compare (square)
-hr-flowchart---vector-stencils-library.png--diagram-flowchart-example.png)
Completed form

Concurrency symbol (fork / join)
-hr-flowchart---vector-stencils-library.png--diagram-flowchart-example.png)
Conditional selector

Control transfer

Data input / output

Database

Decision

Decision indicator - No

Decision indicator - Yes

Delay

Direct access storage

Disk storage

Display

Divided process (table view)
-hr-flowchart---vector-stencils-library.png--diagram-flowchart-example.png)
Document

Entity (rounded)
-hr-flowchart---vector-stencils-library.png--diagram-flowchart-example.png)
Event

Extract

Flow line

Internal storage

Junction symbol

Lined document

Lined / shaded process

Loop limit

Manual file

Manual input

Manual operation

Merge

Multi document

Multi process

Off-page reference - arrow
Off-page reference - incoming

Off-page reference - outgoing

On-page reference/ Inspection point

Or

Page

Paper tape

Predefined process

Prepare conditional

Process step

Reference point

Sequential access storage

Sort

Start (circle)
-hr-flowchart---vector-stencils-library.png--diagram-flowchart-example.png)
Start (ellipse)
-hr-flowchart---vector-stencils-library.png--diagram-flowchart-example.png)
Stickman pictogram

Stored data

Summary

Tagged document

Tagged process

Terminal point

Title block

Torso pictogram

- Block diagram - Customer decision making | Block Diagrams | Block ...
- Block diagram - Customer decision making | Think and act ...
- Decision Making | Pyramid Diagram | Workflow Diagram | Decision ...
- Block diagram - Customer decision making | Block Diagram ...
- Block diagram - Customer decision making
- Block diagram - Customer decision making | How to Create an ...
- Block diagram - Customer decision making | Role Of Information In ...
- Decision Symbol In Block Diagram
- Block diagram - Customer decision making | Rational Decision ...
- Workflow Diagram | Basic Flowchart Symbols and Meaning | Block ...