Diagramming software for Amazon Web Service icon set: Networking and Content Delivery
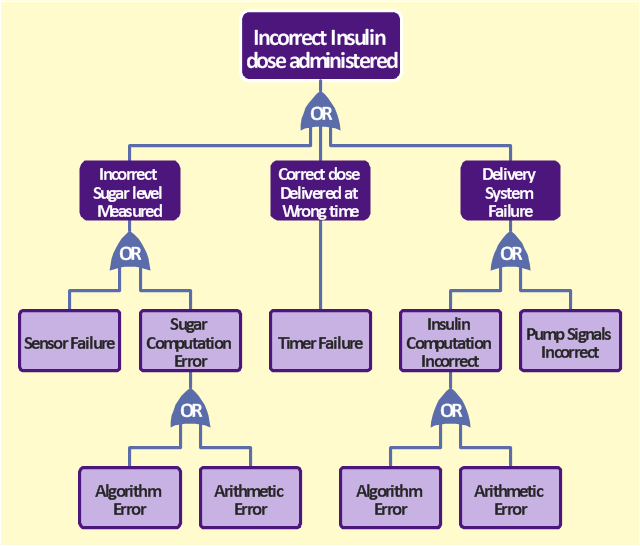
Networking and Content Delivery icons - Amazon AWS pro diagrams - AWS diagrams are part of architecturing tools provided with ConceptDraw Solution Park.The FTA diagram sample "Fault tree analysis - Insulin delivery system" was redesigned from the illustration of "CMSI 641: Introduction to Software Engineering. Design of Critical Systems. B.J. Johnson. 2005. Loyola Marymount University".
"Another way of assessing hazards is using fault tree analysis. In this process, each of the identified hazards is covered by a detailed analysis to find out what might cause it. Either inductive or deductive reasoning is applied. In the case of software hazards, the usual focus is to determine faults that will cause the system to fail to deliver a system service, such as a monitoring system. A "fault tree" is constructed to link all the possible situations together, to help identify the interrelationships of the failures, which modules may cause them, and what "trickle-down effects" there might be. Here is an example of a fault tree, as applied to the Insulin delivery system from Sommerville...
Note that this tree is only partially complete, since only the potential software faults are shown on the diagram. The potential failures involving hardware, such as low battery, blood monitor or sensor failure, patient over-exertion or inattention, or medical staff failure are noticeable by their absence.
The fault tree and safety specification processes are two ways of helping with system risk assessment tasks. Once the risks are identified, there are other assessments that need to take place. First, the likelihood of the risk occurrance must be assessed. This is often quantifiable, so numbers may be assigned based on things like MTBF, latency effects, and other known entities. There may be other non-quantifiable contributors to the risk likelihood, however, such that these must be assessed and estimated by experts in the domain. (Don't short-change this process when dealing with critical systems!) Finally, the risk assessment must include the severity of the risk, meaning an estimation of the cost to the project in the event the risk item actually does occur. "Cost to the project" means all associated costs, including schedule delays, human injury, damage to hardware, corruption of data, and so on."
[myweb.lmu.edu/ bjohnson/ cmsi641web/ week15-2.html]
The FTA diagram example "Fault tree analysis - Insulin delivery system" was created using the ConceptDraw PRO diagramming and vector drawing software extended with the Fault Tree Analysis Diagrams solution from the Engineering area of ConceptDraw Solution Park.
The vector stencils library "AWS Storage and Content Delivery" contains 19 Amazon Web Services storage and content delivery icons: Amazon Simple Storage Service, AWS Import / Export, Amazon Elastic Block Store, AWS Storage Gateway, Amazon Glacier, Amazon CloudFront.
Use it to draw Amazon Web Services architecture diagrams.
The AWS icons example "Design elements - AWS Storage and Content Delivery" was created using the ConceptDraw PRO diagramming and vector drawing software extended with the AWS Architecture Diagrams solution from the Computer and Networks area of ConceptDraw Solution Park.
The vector stencils library "Microsoft Exchange" contains 17 symbols of Microsoft Exchange elements for drawing the logical structure diagrams of Active Directory trees.
"Windows Messaging, initially called Microsoft Exchange, is an e-mail client that was included with Windows 95 (beginning with OSR2), 98 and Windows NT 4.0. ...
Microsoft Exchange gained wide usage with the release of Windows 95, as this was the only mail client that came bundled with it. In 1996, it was renamed to Windows Messaging, because of the upcoming release of Microsoft Exchange Server, and continued to be included throughout later releases of Windows up until the initial release of Windows 98, which by then included Outlook Express 4.0 as the default mail client.
The Windows Messaging email client had two branches of successors:
(1) In software bundled with Windows itself, these were Internet Mail and News in Windows 95 (and bundled with Internet Explorer 3), which was succeeded by Outlook Express 4.0 in Windows 98 (bundled with Internet Explorer 4.0 in Windows 95) and throughout newer Windows systems. These did not use the .pst file type.
(2) Microsoft Outlook became the professional-grade and more direct successor of MS Exchange Client, which still uses the .pst file type." [Windows Messaging. Wikipedia]
The symbols example "Microsoft Exchange - Vector stencils library" was created using the ConceptDraw PRO diagramming and vector drawing software extended with the Active Directory Diagrams solution from the Computer and Networks area of ConceptDraw Solution Park.
www.conceptdraw.com/ solution-park/ active-directory-diagrams
The vector stencils library "Sales department" contains 49 company department icons.
Use these sales pictograms to draw your sales flowcharts, workflow diagrams and process charts with the ConceptDraw PRO diagramming and vector drawing software.
The vector stencils library "Sales department" is included in the Sales Flowcharts solution from the Marketing area of ConceptDraw Solution Park.
The vector stencils library "HR professions" contains 81 professions pictograms.
Use this HR icon set to draw your HR flowcharts, workflow diagrams, process charts and infographics with the ConceptDraw PRO diagramming and vector drawing software.
The HR pictograms library "HR professions" is included in the HR Flowcharts solution from the Management area of ConceptDraw Solution Park.
Settlement Process Flowchart. Flowchart Examples
Create your own flow charts of settlement processes using the ConceptDraw PRO diagramming and vector drawing software extended with the Cross-Functional Flowcharts solution from the Business Processes area of ConceptDraw Solution Park.Download easy flowchart software to create settlement process flowcharts show steps of monthly settlement with your business quickly and easily.
The vector stencils library "Shopping pictograms" contains 20 icons of shop, store and trade symbols. Use it to draw your pictorial infograms. The example "Shopping pictograms - Vector stencils library" was created using the ConceptDraw PRO diagramming and vector drawing software extended with the Pictorial infographics solution from the area "What is infographics" in ConceptDraw Solution Park.
UML Diagram for System
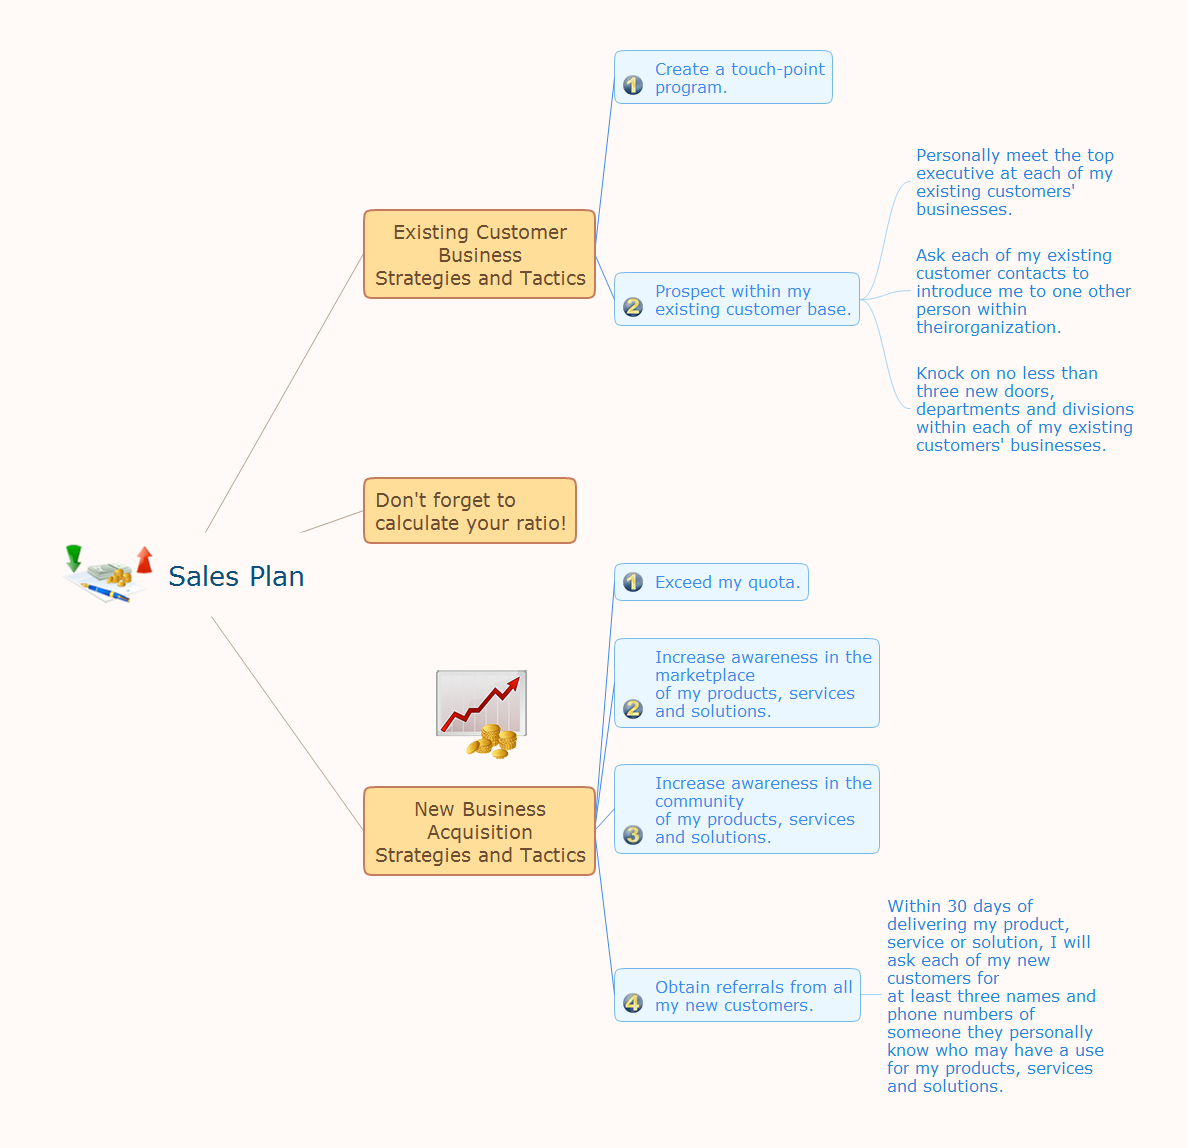
This sample shows the UML Class Diagram of delivery system. On this diagram you can see the classes that are connected with aggregation and composition associations indicated with the multiplicity. This sample can be used by delivery services, postal services.How to Deliver Presentations using Mind Maps
Creating and organizing presentations, structuring received presentations, presenting mind maps, and preparing for public presenting.The vector stencils library "Sales department" contains 49 company department icons.
Use these sales pictograms to draw your sales flowcharts, workflow diagrams and process charts with the ConceptDraw PRO diagramming and vector drawing software.
The vector stencils library "Sales department" is included in the Sales Flowcharts solution from the Marketing area of ConceptDraw Solution Park.
The vector stencils library "HR department" contains 50 workflow symbols.
Use this department icon set to draw your HR process flowcharts, workflow diagrams and infographics with the ConceptDraw PRO diagramming and vector drawing software.
The HR pictograms library "HR department" is included in the HR Flowcharts solution from the Management area of ConceptDraw Solution Park.
The vector stencils library "Business" contains 22 clipart images for drawing business illustrations.
"Graphics are visual elements often used to point readers and viewers to particular information. They are also used to supplement text in an effort to aid readers in their understanding of a particular concept or make the concept more clear or interesting. Popular magazines, such as TIME, Wired and Newsweek, usually contain graphic material in abundance to attract readers...
Graphics are among the primary ways of advertising the sale of goods or services.
Business.
Graphics are commonly used in business and economics to create financial charts and tables. The term Business Graphics came into use in the late 1970s, when personal computers became capable of drawing graphs and charts instead of using a tabular format. Business Graphics can be used to highlight changes over a period of time.
Advertising.
Advertising is one of the most profitable uses of graphics; artists often do advertising work or take advertising potential into account when creating art, to increase the chances of selling the artwork." [Graphics. Wikipedia]
The clip art example "Business - Vector stencils library" was created using the ConceptDraw PRO software extended with the Business and Finance solution from the Illustration area of ConceptDraw Solution Park.
www.conceptdraw.com/ solution-park/ illustrations-business-finance
The vector stencils library "Microsoft Exchange" contains 17 symbols of Microsoft Exchange elements for drawing the logical structure diagrams of Active Directory trees.
"Windows Messaging, initially called Microsoft Exchange, is an e-mail client that was included with Windows 95 (beginning with OSR2), 98 and Windows NT 4.0. ...
Microsoft Exchange gained wide usage with the release of Windows 95, as this was the only mail client that came bundled with it. In 1996, it was renamed to Windows Messaging, because of the upcoming release of Microsoft Exchange Server, and continued to be included throughout later releases of Windows up until the initial release of Windows 98, which by then included Outlook Express 4.0 as the default mail client.
The Windows Messaging email client had two branches of successors:
(1) In software bundled with Windows itself, these were Internet Mail and News in Windows 95 (and bundled with Internet Explorer 3), which was succeeded by Outlook Express 4.0 in Windows 98 (bundled with Internet Explorer 4.0 in Windows 95) and throughout newer Windows systems. These did not use the .pst file type.
(2) Microsoft Outlook became the professional-grade and more direct successor of MS Exchange Client, which still uses the .pst file type." [Windows Messaging. Wikipedia]
The symbols example "Microsoft Exchange - Vector stencils library" was created using the ConceptDraw PRO diagramming and vector drawing software extended with the Active Directory Diagrams solution from the Computer and Networks area of ConceptDraw Solution Park.
www.conceptdraw.com/ solution-park/ active-directory-diagrams
"Windows Messaging, initially called Microsoft Exchange, is an e-mail client that was included with Windows 95 (beginning with OSR2), 98 and Windows NT 4.0. ...
Microsoft Exchange gained wide usage with the release of Windows 95, as this was the only mail client that came bundled with it. In 1996, it was renamed to Windows Messaging, because of the upcoming release of Microsoft Exchange Server, and continued to be included throughout later releases of Windows up until the initial release of Windows 98, which by then included Outlook Express 4.0 as the default mail client.
The Windows Messaging email client had two branches of successors:
(1) In software bundled with Windows itself, these were Internet Mail and News in Windows 95 (and bundled with Internet Explorer 3), which was succeeded by Outlook Express 4.0 in Windows 98 (bundled with Internet Explorer 4.0 in Windows 95) and throughout newer Windows systems. These did not use the .pst file type.
(2) Microsoft Outlook became the professional-grade and more direct successor of MS Exchange Client, which still uses the .pst file type." [Windows Messaging. Wikipedia]
The symbols example "Microsoft Exchange - Vector stencils library" was created using the ConceptDraw PRO diagramming and vector drawing software extended with the Active Directory Diagrams solution from the Computer and Networks area of ConceptDraw Solution Park.
www.conceptdraw.com/ solution-park/ active-directory-diagrams
The vector stencils library "Shopping pictograms" contains 20 icons of shop, store and trade symbols. Use it to draw your pictorial infograms. The example "Shopping pictograms - Vector stencils library" was created using the ConceptDraw PRO diagramming and vector drawing software extended with the Pictorial infographics solution from the area "What is infographics" in ConceptDraw Solution Park.
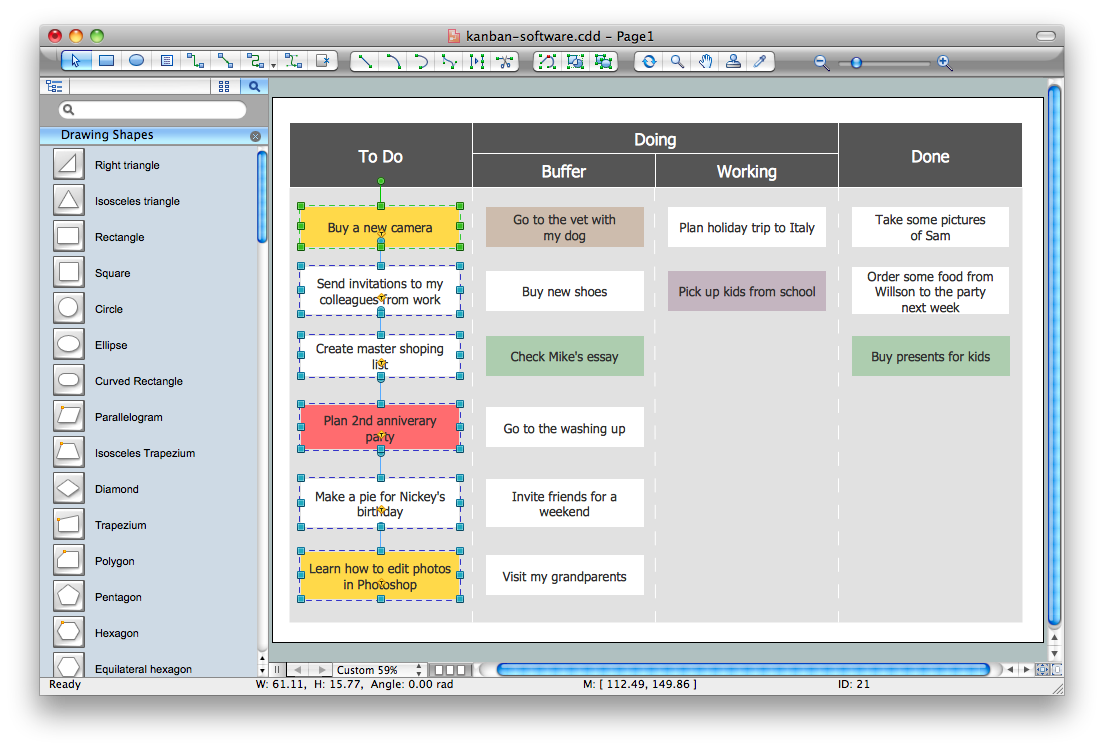
Kanban Board Software
Kanban Board Software is incredibly useful tool that allows a team to work effective and productive, to analyze and improve the business processes, and visualize the workflows.ConceptDraw PRO with its numerous solutions is a powerful Kanban Board Software! Draw your own professional looking Kanban Board Diagrams quick, easy and effective with useful tools of ConceptDraw PRO diagramming and vector drawing software.
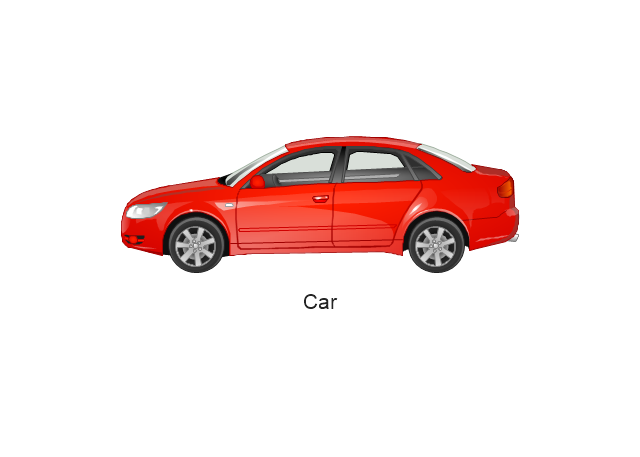
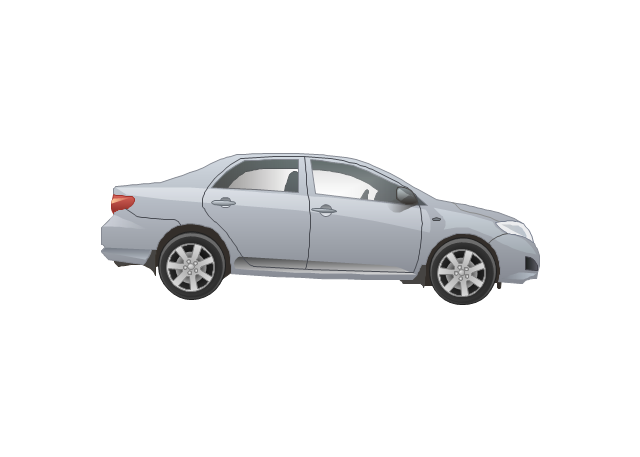
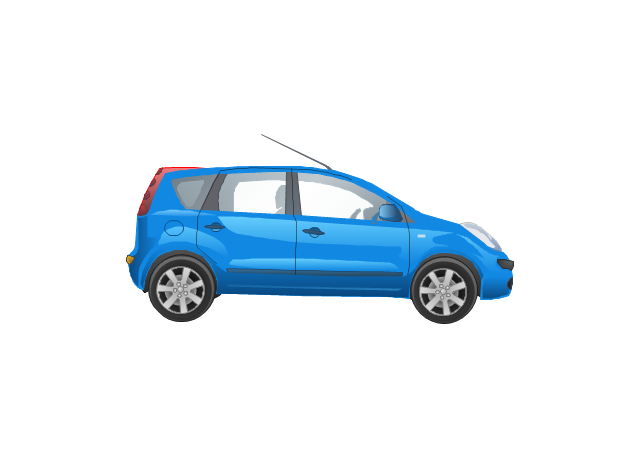
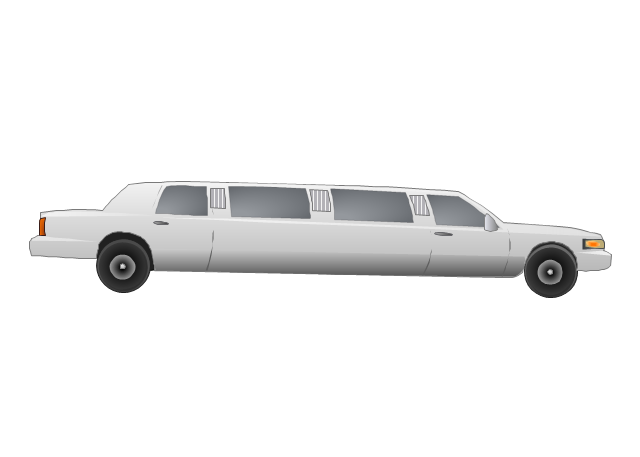
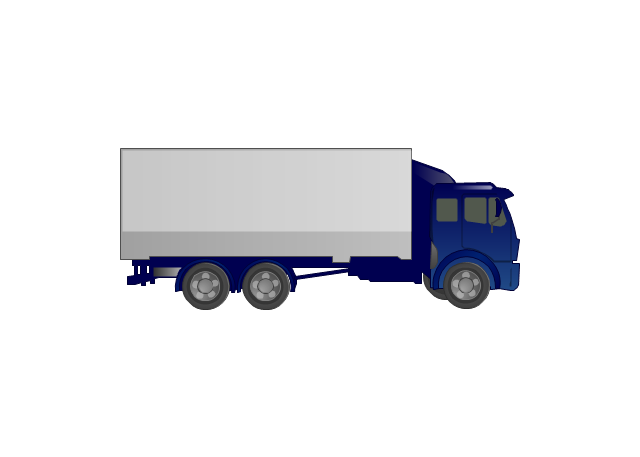
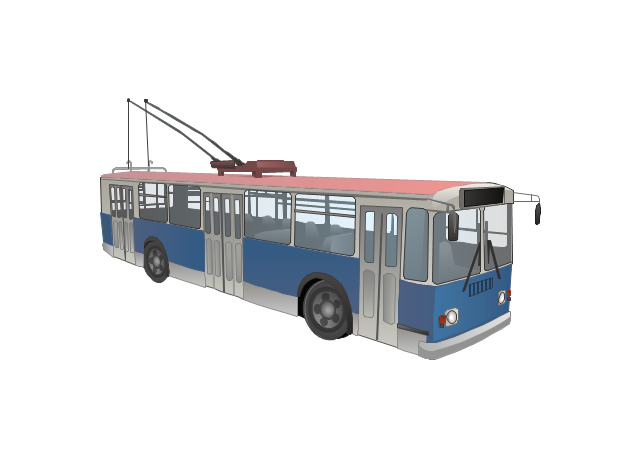
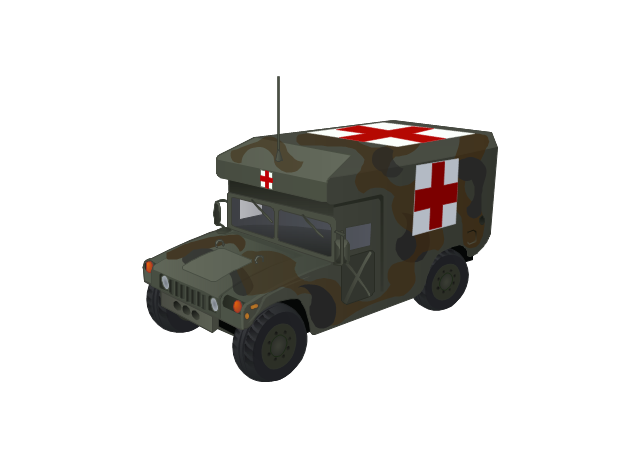
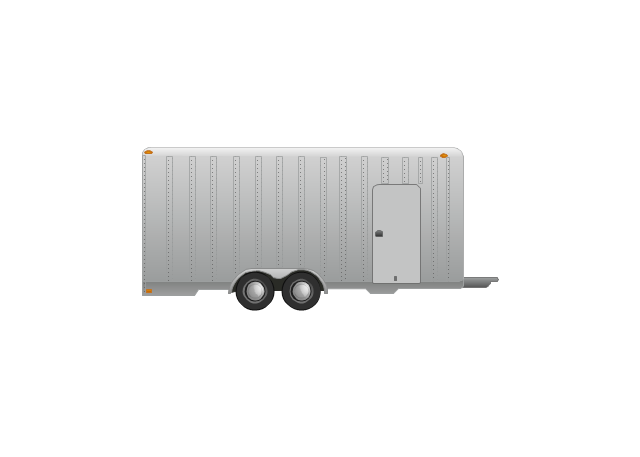
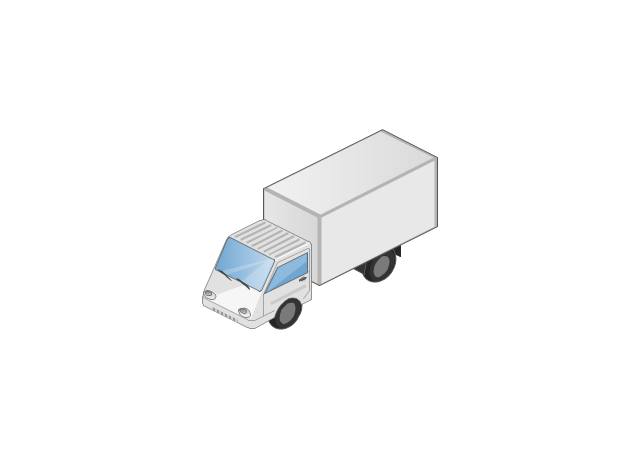
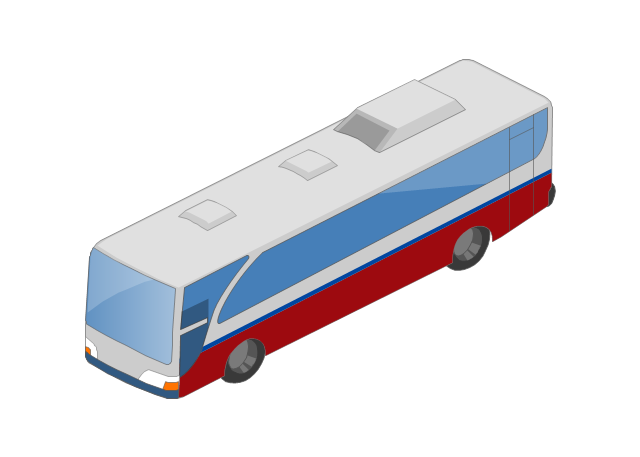
The vector stencils library "Road transport" contains 43 clip art images for creating vehicles and transportation illustrations, presentation slides, infographics and webpages using the ConceptDraw PRO diagramming and vector drawing software.
"Road transport (British English) or road transportation (American English) is the transport of passengers or goods on roads. ...
Transportation.
Transport on roads can be roughly grouped into the transportation of goods and transportation of people. In many countries licencing requirements and safety regulations ensure a separation of the two industries.
The nature of road transportation of goods depends, apart from the degree of development of the local infrastructure, on the distance the goods are transported by road, the weight and volume of the individual shipment, and the type of goods transported. For short distances and light, small shipments a van or pickup truck may be used. For large shipments even if less than a full truckload a truck is more appropriate. In some countries cargo is transported by road in horse-drawn carriages, donkey carts or other non-motorized mode. Delivery services are sometimes considered a separate category from cargo transport. In many places fast food is transported on roads by various types of vehicles. For inner city delivery of small packages and documents bike couriers are quite common.
People are transported on roads either in individual cars or automobiles, or in mass transit by bus or coach. Special modes of individual transport by road like rickshaws or velotaxis may also be locally available." [Road transport. Wikipedia]
The vector stencils library "Road transport" is included in the Aerospace and Transport solution from the Illustrations area of ConceptDraw Solution Park.
www.conceptdraw.com/ solution-park/ illustrations-aerospace-transport
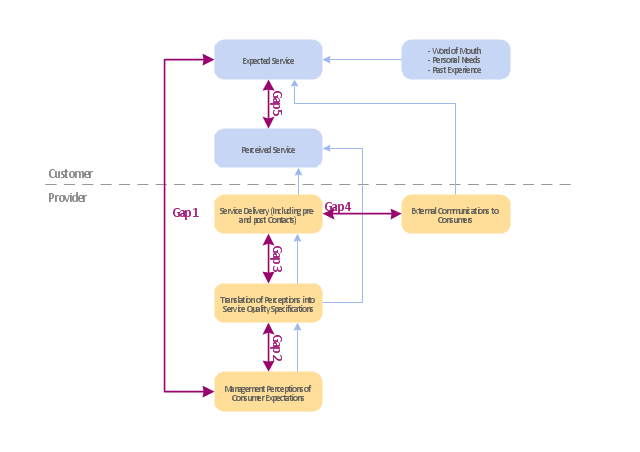
"Dimensions of service quality.
A customer's expectation of a particular service is determined by factors such as recommendations, personal needs and past experiences. The expected service and the perceived service sometimes may not be equal, thus leaving a gap. The service quality model or the ‘GAP model’ developed by a group of authors- Parasuraman, Zeithaml and Berry at Texas and North Carolina in 1985 , highlights the main requirements for delivering high service quality. It identifies five ‘gaps’ that cause unsuccessful delivery. Customers generally have a tendency to compare the service they 'experience' with the service they 'expect' . If the experience does not match the expectation , there arises a gap. Ten determinants that may influence the appearance of a gap were described by Parasuraman, Zeithaml and Berry. in the SERVQUAL model: reliability, responsiveness, competence, access, courtesy, communication, credibility, security, understanding the customer and tangibles.
Later, the determinants were reduced to five: tangibles; reliability; responsiveness; service assurance and empathy in the so called RATER model." [Service quality. Wikipedia]
The block diagram example "Gap model of service quality" was created using the ConceptDraw PRO diagramming and vector drawing software extended with the Block Diagrams solution from the area "What is a Diagram" of ConceptDraw Solution Park.
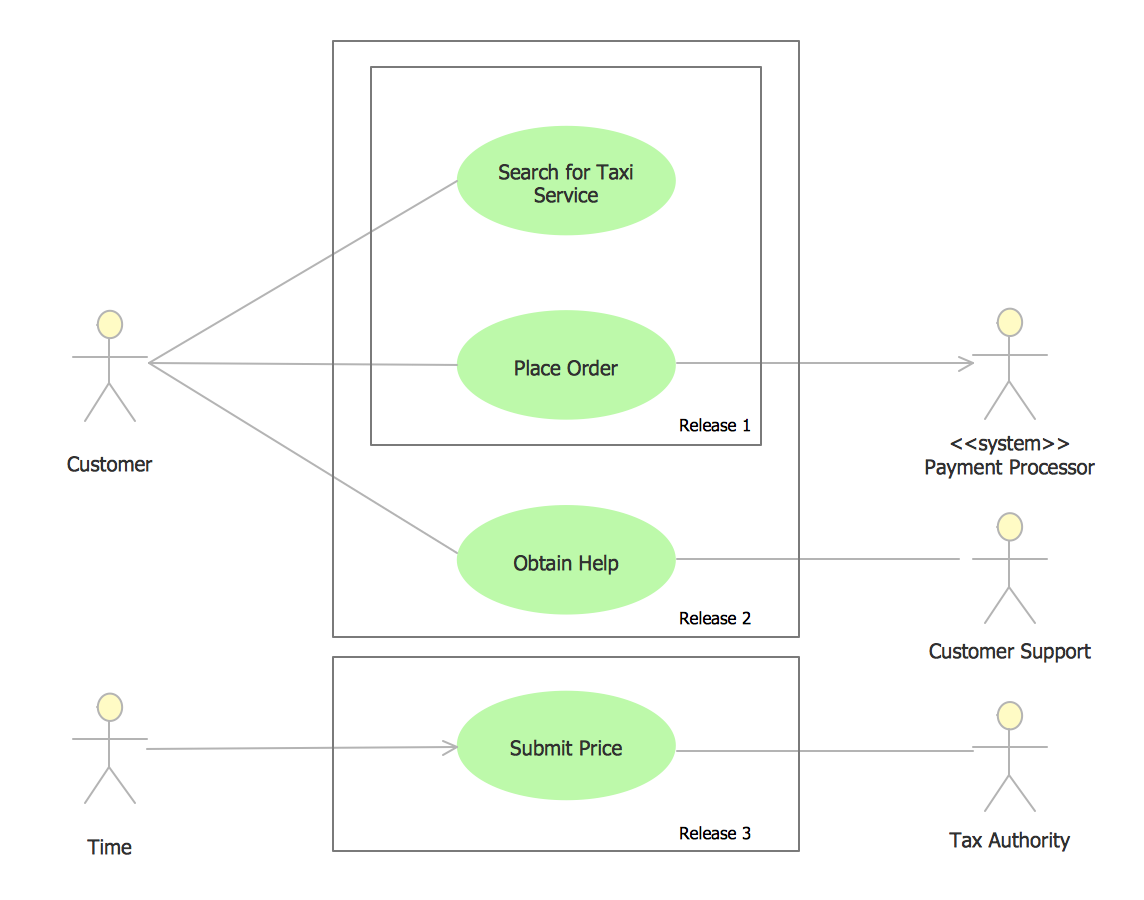
UML Use Case Diagram Example - Taxi Service
UML Use Case Diagram Taxi Service - This sample was created in ConceptDraw PRO diagramming and vector drawing software using the UML Use Case Diagram library of the Rapid UML Solution from the Software Development area of ConceptDraw Solution Park.This sample shows the work of the taxi service and is used by taxi stations, by airports, in the tourism field and delivery service.
- Diagramming software for Amazon Web Service icon set ...
- Fault Tree Analysis Diagrams | Fault tree analysis - Insulin delivery ...
- Fault tree analysis - Insulin delivery system
- Design elements - AWS Storage and Content Delivery
- Message delivery
- Block diagram - Gap model of service quality
- Delivery
- Pizza delivery man
- Delivery
- Road Transport - Design Elements | Design elements - Road ...
- Road Transport - Design Elements | Business diagrams & Org ...
- Risk Analysis | CORRECTIVE ACTIONS PLANNING. Risk Diagram ...
- Cross-Functional Flowcharts | Work Order
- UML Block Diagram | UML Diagram | UML Composite Structure ...
- Mind Map Exchange | Marketing | How to Deliver Presentations ...
- UML Class Diagram Example - Buildings and Rooms | UML Block ...
- EPC for Business Process Improvement | Affinity diagram ...
- Flow Chart Of Gap Model Of Service Delivery
- Flow chart Example. Warehouse Flowchart | Plant Layout Plans | HR ...
- Road transport - Vector stencils library | Road Transport - Design ...
