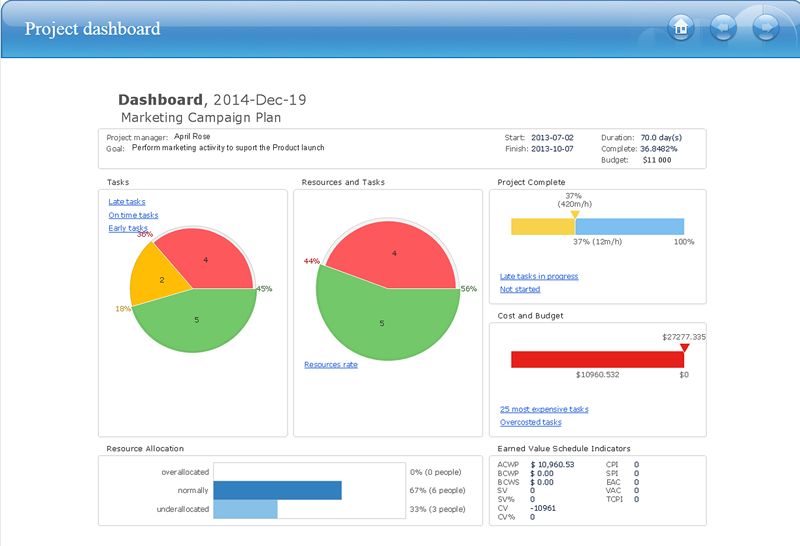
"Dashboards give signs about a business letting the user know something is wrong or something is right. ...
Balanced Scoreboards and Dashboards have been linked together as if they were interchangeable. However, although both visually display critical information, the difference is in the format: Scoreboards can open the quality of an operation while dashboards provide calculated direction. A balanced scoreboard has what they called a “prescriptive” format. It should always contain these components (Active Strategy) ...
(1) Perspectives – groupings of high level strategic areas.
(2) Objectives – verb-noun phrases pulled from a strategy plan.
(3) Measures – also called Metric or Key Performance Indicators (KPIs).
(4) Spotlight Indicators – red, yellow, or green symbols that provide an at-a-glance view of a measure’s performance.
Each of these sections ensures that a Balanced Scorecard is essentially connected to the businesses critical strategic needs.
The design of a dashboard is more loosely defined. Dashboards are usually a series of graphics, charts, gauges and other visual indicators that can be monitored and interpreted. Even when there is a strategic link, on a dashboard, it may not be noticed as such since objectives are not normally present on dashboards. However, dashboards can be customized to link their graphs and charts to strategic objectives." [Dashboard (business). Wikipedia]
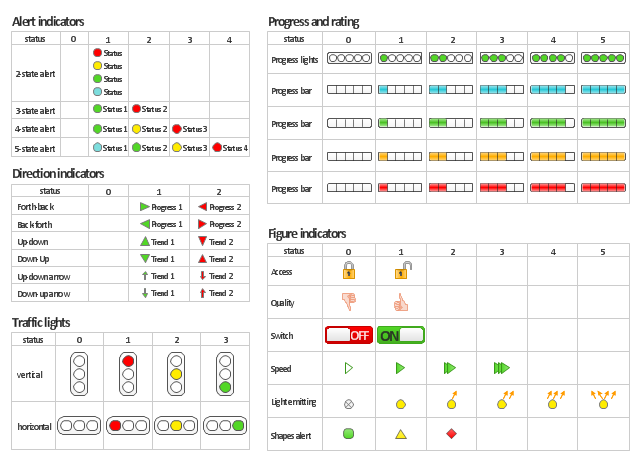
The vector stencils library "Status indicators" contains 41 visual status indicators for creating the business performance dashboards using the ConceptDraw PRO diagramming and vector drawing software.
Each status indicator can visualize one of 2-6 information states and have a caption.
Status indicators allow you quickly estimate, where your immediate decision and action is critical.
The example "Design elements - Status indicators" is included in the Status Dashboard solution from the area "What is a Dashboard" of ConceptDraw Solution Park.
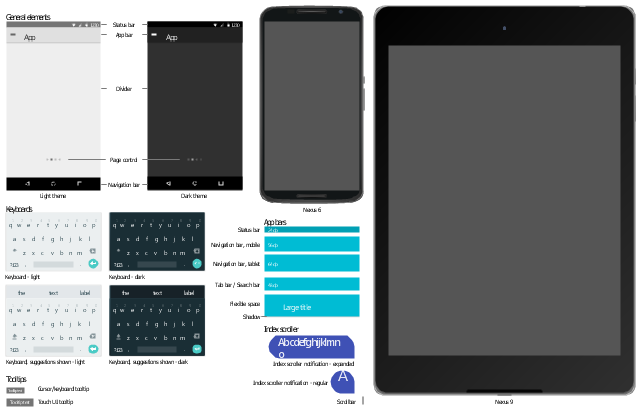
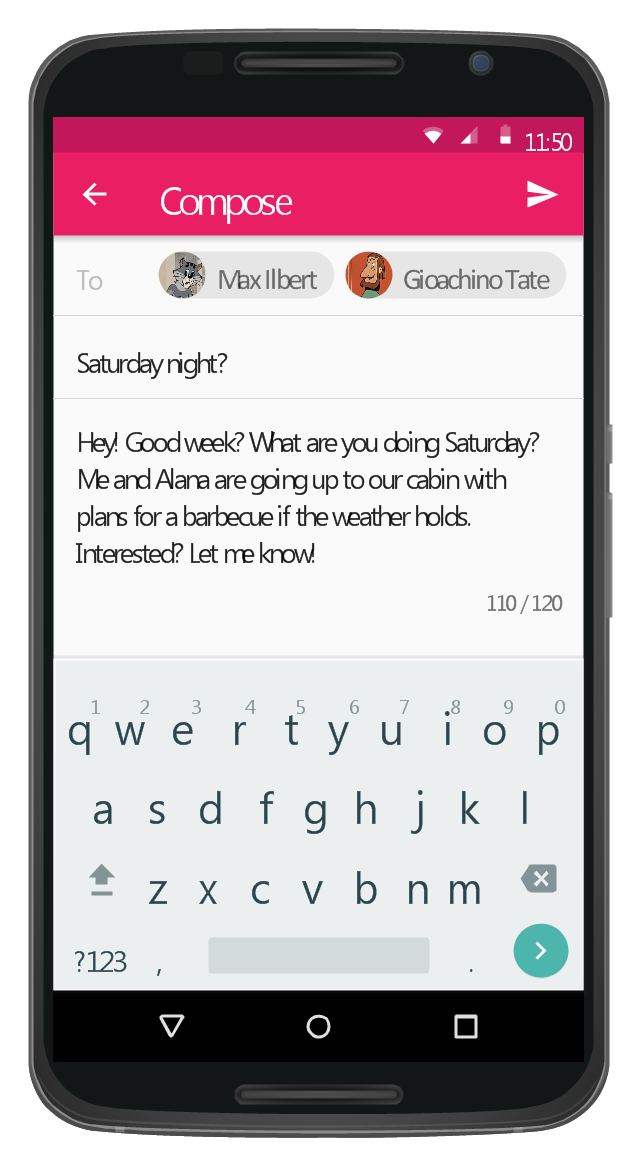
The vector stencils library "Android UI" contains 28 UI elements: screen, status bar, app bar, divider, navigation bar, page control, tab, search bar, flexible space, keyboard, cursor tooltip, touch UI tooltip, index scroller, Google Nexus 6 smartphone, Google Nexus 9 tablet.
Use it to design user interface of your Android 5 application.
The shapes example "Design elements - Android UI" was created using the ConceptDraw PRO diagramming and vector drawing software extended with the "Android user interface" solution from the "Software Development" area of ConceptDraw Solution Park.
 ConceptDraw Solution Park
ConceptDraw Solution Park collects graphic extensions, examples and learning materials
The vector stencils library "Controls" contains 53 icons of Windows 8 controls.
Use it to design graphic user interface (GUI) prototypes of your software applications for Windows 8.
"A graphical control element or widget is an element of interaction in a graphical user interface (GUI), such as a button or a scroll bar. Controls are software components that a computer user interacts with through direct manipulation to read or edit information about an application. ...
Each widget facilitates a specific type of user-computer interaction, and appears as a visible part of the application's GUI as defined by the theme and rendered by the rendering engine. The theme makes all graphical control elements adhere to a unified aesthetic design and creates a sense of overall cohesion. Some widgets support interaction with the user, for example labels, buttons, and check boxes. Others act as containers that group the widgets added to them, for example windows, panels, and tabs." [Graphical control element. Wikipedia]
The design elements example "Controls - Vector stencils library" was created using the ConceptDraw PRO diagramming and vector drawing software extended with the Windows 8 User Interface solution from the Software Development area of ConceptDraw Solution Park.
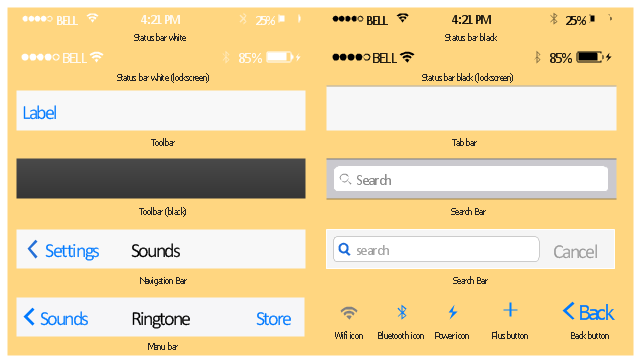
The vector stencils library "Bars" contains 16 iOS apps GUI views: menu bar, navigation bar, search bar, status bar, tab bar, toolbar, wifi icon, bluetooth icon, power icon, plus button, back button.
Use the library "Bars" to draw bar views in your design of iPhone software applications user interface sketches, mockups and prototypes.
The iOS GUI views sample "Design elements - Bars" was created using the ConceptDraw PRO diagramming and vector drawing software extended with the iPhone User Interface solution from the Software Development area of ConceptDraw Solution Park.
The vector stencils library "Scrum workspace" contains 21 icons.
Use this clipart set to design your agile software development diagrams and infographics with ConceptDraw PRO software.
"... a list of all the things that ... should be visible within the ideal agile workspace:
Big Visible Charts. ... the sprint burndown chart, showing the number of hours remaining as of each day of the current sprint. ... big visible charts showing the number of passing customer acceptance tests, the pass/ fail status of tests by day, sprint and release burndown charts, number of new stories introduced to the product backlog per sprint, and more.
Additional feedback devices. In addition to big, visible charts, it is common for an agile team to use additional visual feedback devices in their workspace. One of the most common is a lava lamp that is turned on whenever the automated build is broken.
... flashing red traffic lights to indicate exceptional conditions such as an issue on a production server. Also popular are ambient orbs and Nabaztag rabbits, which are wireless programmable devices that can also be configured to change colors, speak messages, or wiggle their ears as a team desires. ...
Everyone on your team. Each person on the team should ideally be able to see each other person on the team. This absolutely includes the ScrumMaster and ideally includes the product owner. ...
The sprint backlog. One of the best ways to ensure that everything necessary is completed in the sprint is to make the sprint backlog visible. The best way to do that is by displaying the sprint backlog on a wall, ideally in the form of a task board ...
The product backlog. One problem with running an endless series of sprints is that each can feel disconnected or isolated from the whole of a planned released or related set of new capabilities. A good way to reduce the impact of this problem is by displaying the product backlog somewhere clearly visible. ... tack the index cards with those upcoming user stories on a wall where all can see them. This allows team members to see how the user stories they are working on in the current sprint relate to others that are coming soon.
At least one big white board. ... Locating this in the team’s common workspace encourages spontaneous meetings." [mountaingoatsoftware.com/ blog/ the-ideal-agile-workspace]
The clip art sample "Design elements - Scrum workspace" is included in the Scrum solution from the Project Management area of ConceptDraw Solution Park.
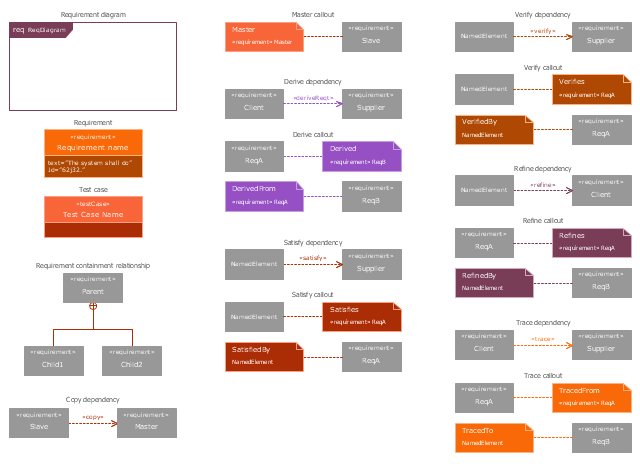
The vector stencils library "Requirement diagram" contains 21 SysML symbols.
Use it to design your requirement diagrams using ConceptDraw PRO diagramming and vector drawing software.
"A requirement specifies a capability or condition that must (or should) be satisfied. A requirement may specify a function that a system must perform or a performance condition a system must achieve. SysML provides modeling constructs to represent text-based requirements and relate them to other modeling elements. The requirements diagram described in this clause can depict the requirements in graphical, tabular, or tree structure format. A requirement can also appear on other diagrams to show its relationship to other modeling elements. The requirements modeling constructs are intended to provide a bridge between traditional requirements management tools and the other SysML models.
A requirement is defined as a stereotype of UML Class subject to a set of constraints. A standard requirement includes properties to specify its unique identifier and text requirement. Additional properties such as verification status, can be specified by the user.
Several requirements relationships are specified that enable the modeler to relate requirements to other requirements as well as to other model elements. These include relationships for defining a requirements hierarchy, deriving requirements, satisfying requirements, verifying requirements, and refining requirements." [www.omg.org/ spec/ SysML/ 1.3/ PDF]
The SysML shapes example "Design elements - Requirement diagram" is included in the SysML solution from the Software Development area of ConceptDraw Solution Park.
 Entity-Relationship Diagram (ERD)
An Entity-Relationship Diagram (ERD) is a visual presentation of entities and relationships. That type of diagrams is often used in the semi-structured or unstructured data in databases and information systems. At first glance ERD is similar to a flowch
This Android 5 UI design example shows Gmail screen of Google Nexus 6 smartphone.
The user interface design example "Android 5.0 - Gmail" was created using the ConceptDraw PRO diagramming and vector drawing software extended with the "Android user interface" solution from the "Software Development" area of ConceptDraw Solution Park.
The user interface design example "Android 5.0 - Gmail" was created using the ConceptDraw PRO diagramming and vector drawing software extended with the "Android user interface" solution from the "Software Development" area of ConceptDraw Solution Park.
HelpDesk
How to Publish Project Reports on the Web Using ConceptDraw PRO
Reporting is an important part of project management. Every project manager is regularly asked how the project is progressing. ConceptDraw Office offers different ways in which to provide a project status.- Design elements - Status indicators
- Cool Equipment Status Dashboard Design
- Design elements - Status indicators | Design elements - Meter ...
- Status indicators - Vector stencils library | Design elements - Status ...
- Status Bar Ui Design Preview
- Design elements - Ponds and Fountains | Status Dashboard | Light ...
- Flowchart design . Flowchart symbols, shapes, stencils and icons ...
- Gym Layout | Fitness Plans | Design elements - Physical training ...
- Performance Indicators | PM Dashboards | Design elements - Sales ...
- Business Report Pie. Pie Chart Examples | Design elements - Sales ...
- Erd Status
- Design elements - Comparison charts and indicators | Performance ...
- Performance Indicators | Enterprise dashboard | Design elements ...
- Status indicators - Vector stencils library | Status Dashboard | Project ...
- How to Create a Sales Dashboard Using ConceptDraw PRO ...
- Status Dashboard | Project management task status dashboard ...
- Performance Indicators | | | Dashboard Indicator
- Android Ui Designer Software
- Finite State Machine | UML Diagram | Status indicators - Vector ...
- Android User Interface | Lock Screen Status Bar Drawer
