Marketing Charts
ConceptDraw PRO diagramming and vector drawing software offers the Marketing Diagrams Solution from the Marketing Area with extensive drawing tools, predesigned vector shapes, templates and samples for fast and easy drawing marketing charts and diagrams, marketing schemes and flow charts, various marketing illustrations, etc.HR Flowchart Symbols
Human resources are the people who make up the employee workforce of an organization or company. Human resource management has four basic functions: staffing, motivation, training and development, and maintenance. It is convenient to use the flowcharts to represent various HR processes and workflows. ConceptDraw PRO diagramming and vector drawing software extended with HR Flowcharts solution from the Management area of ConceptDraw Solution Park supplies you with comprehensive selection of predesigned vector HR flowchart symbols and standardized flowchart notation symbols, which allow you to design effectively the eye-catching infographics and diagrams relating to any human resource management process that will be relevant and understood by all business associates. The ConceptDraw PRO software offers also the set of predesigned flowchart and workflow templates and samples making your drawing process as easy as possible. Use the HR Flowcharts solution to create professional-looking HR Flowcharts and HRM Business Process Diagrams in a matter of moments.
 Gym and Spa Area Plans
Effective promotion of spa complexes, spa resorts, fitness centers, and gym rooms requires professional, detailed, illustrative and attractive spa floor plan, gym floor plan, and other fitness plans designs. They are designed to display common plans of premises, design, Spa furniture, gym and exercise equipment layout, and pools location.
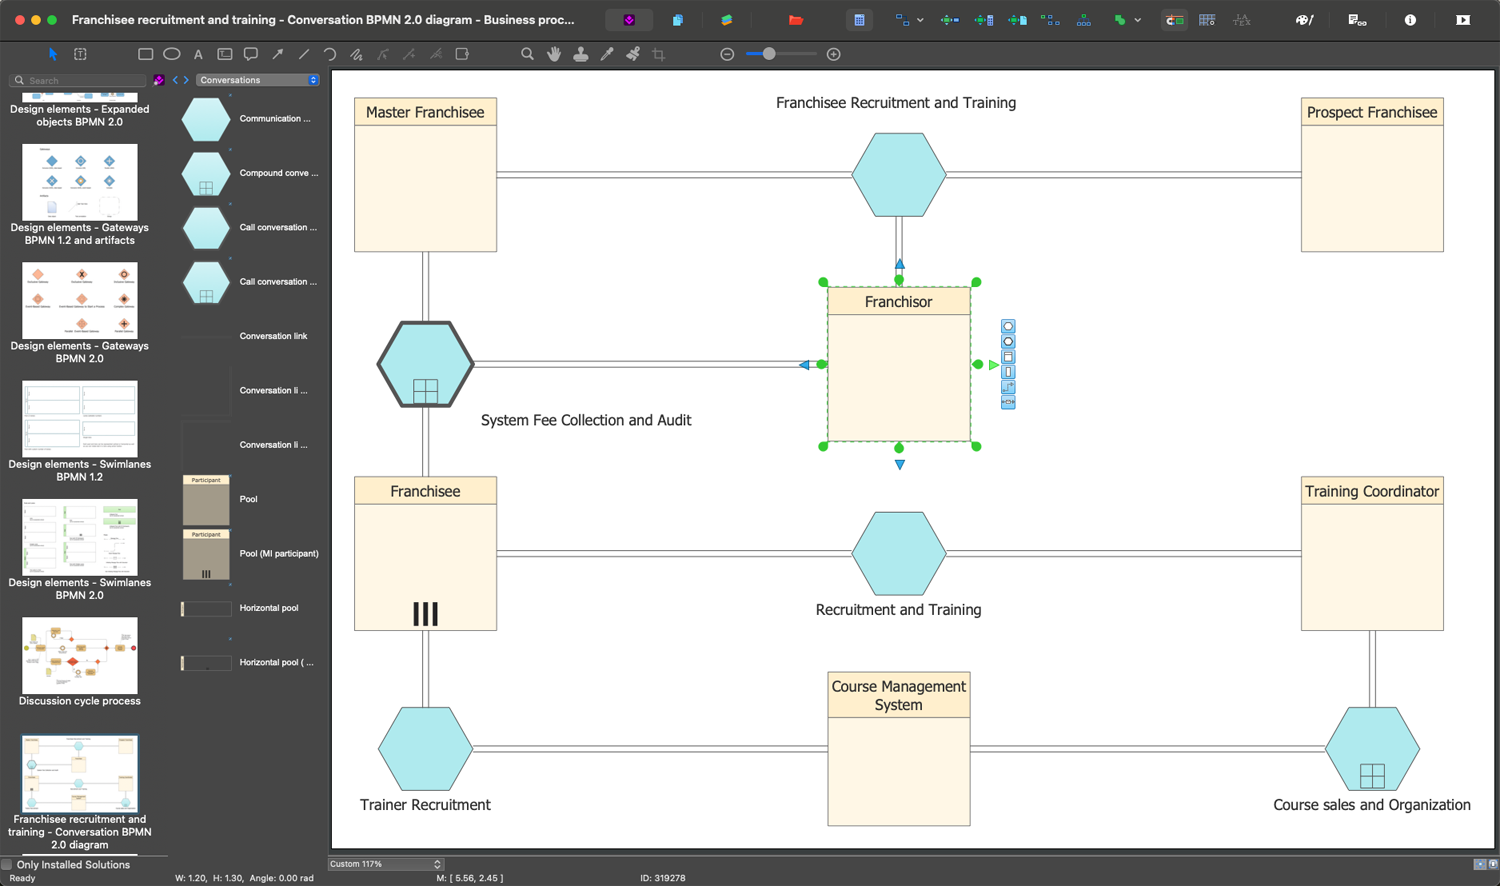
The Best Business Process Modeling Software
ConceptDraw PRO is a best business processes modeling software for graphical documenting processes of the company. ConceptDraw has 142 vector stencils in the 8 libraries that helps you to start using Diagramming Software for designing own Business Process Diagrams.
 PM Planning
This solution extends ConceptDraw MINDMAP and ConceptDraw Project software, allowing you to automatically create documents that reflect a project's status, for people who have different project roles.
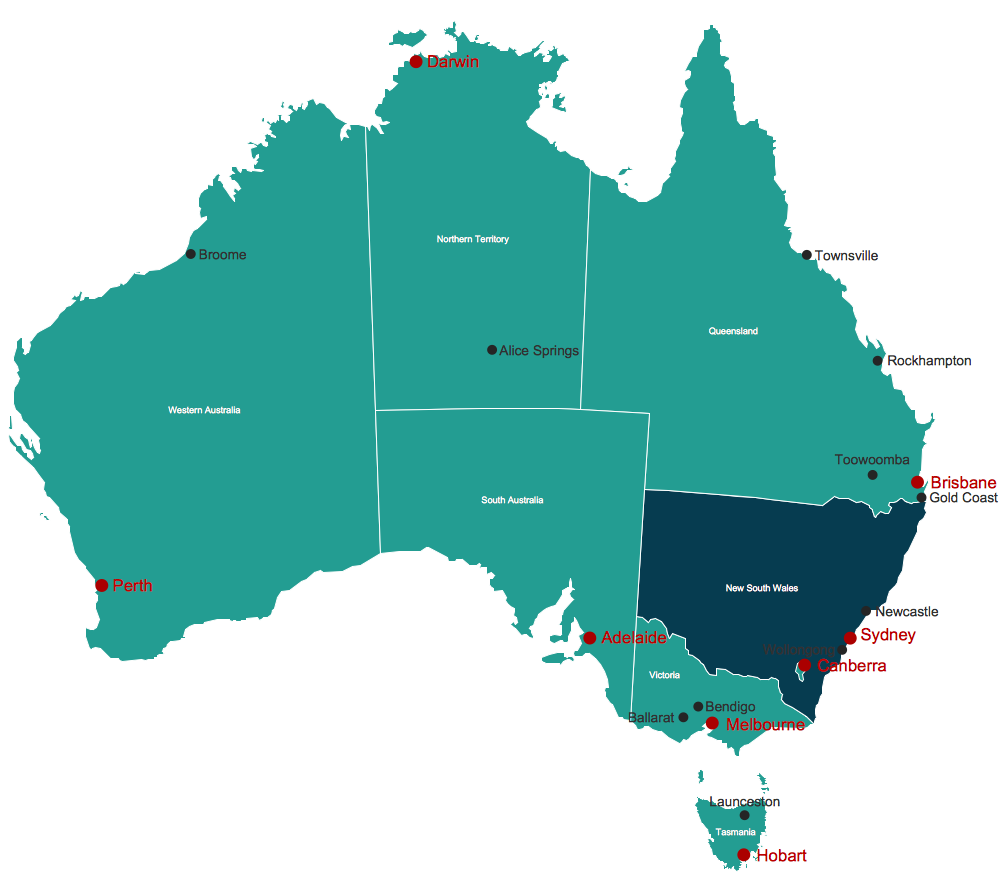
Map Australia
ConceptDraw PRO diagramming and vector drawing software offers the Australia Map Solution from the Maps Area of ConceptDraw Solution Park - the best tool for fast and easy drawing various types of Australia maps, maps of Australia states and islands, Map Australia with cities, thematic Australia maps and cartograms of any degree of detailing.
 Concept Maps
The technique of concept mapping was developed as a constructive way of representing knowledge in science and increasing the meaningfulness of learning. Now, the creation of a concept map is extremely helpful when used in education as learning and teaching techniques that assist memorization. Concept maps are also used for idea generation in brainstorming sessions, and for detailing the structure of complex ideas.
How to Report Task's Execution with Gantt Chart
ConceptDraw PROJECT’s powerful reporting engine lets you generate a set of tabular reports with just one click, or visualize your project as Radial Tasks Structures, Work Breakdown Structures and Resource Calendars. It also provides you with dynamic Project Dashboards.PERT Chart
The program (or project) evaluation and review technique, commonly abbreviated PERT, is a statistical tool, used in project management, which was designed to analyze and represent the tasks involved in completing a given project. ConceptDraw PRO diagramming and vector drawing software extended with Seven Management and Planning Tools Solution from the Management Area offers the extensive drawing tools for effective drawing the PERT Chart of any complexity.Fishbone Diagram Problem Solving
The Ishikawa diagram, Cause and Effect diagram, Fishbone diagram — all they are the names of one and the same visual method for working with causal connections. Originally invented by Kaoru Ishikawa to control the process quality, the Ishikawa diagram is well proven in other fields of management and personal scheduling, events planning, time management. It is a chart in the form of a fish, whose head is a problem, the fins are variants for its causes. To design easily the Fishbone diagram, you can use a special ConceptDraw PRO vector graphic and diagramming software which contains the powerful tools for Fishbone diagram problem solving offered by Fishbone Diagrams solution for the Management area of ConceptDraw Solution Park.- Market Detailing Flow Chart And Who Is Responsible
- Flowchart Marketing Process. Flowchart Examples | Sales Process ...
- Accounts Payable Flowchart | Workflow Diagram | Account ...
- Marketing Environment Flow Charts
- Sales Process Flowchart . Flowchart Examples | Sales Process ...
- Marketing Function Flowchart
- Flowchart Marketing Process. Flowchart Examples | Flowchart ...
- Process Flowchart | Data Flow Diagrams (DFD) | Pyramid Diagram ...
- Marketing Dept Flow Chart
- Flowchart Marketing Process. Flowchart Examples | Marketing Flow ...
- Flowchart Marketing Process. Flowchart Examples | Process ...
- Marketing Flow Chart | Account Flowchart . Flowchart Examples ...
- Flowchart Marketing Process. Flowchart Examples | Process ...
- Material Requisition Flowchart . Flowchart Examples | Flowchart ...
- Marketing Sop Flow Chart
- Flowchart Marketing Process. Flowchart Examples | Process ...
- Marketing and Sales Organization chart. Organization chart Example
- Flowchart of Products. Flowchart Examples | Flowchart Marketing ...
- Flow Chart Of Marketing Environment
- Spatial infographics Design Elements: Location Map | Process ...


