HelpDesk
How to Change the Measurement Units and Drawing Scale
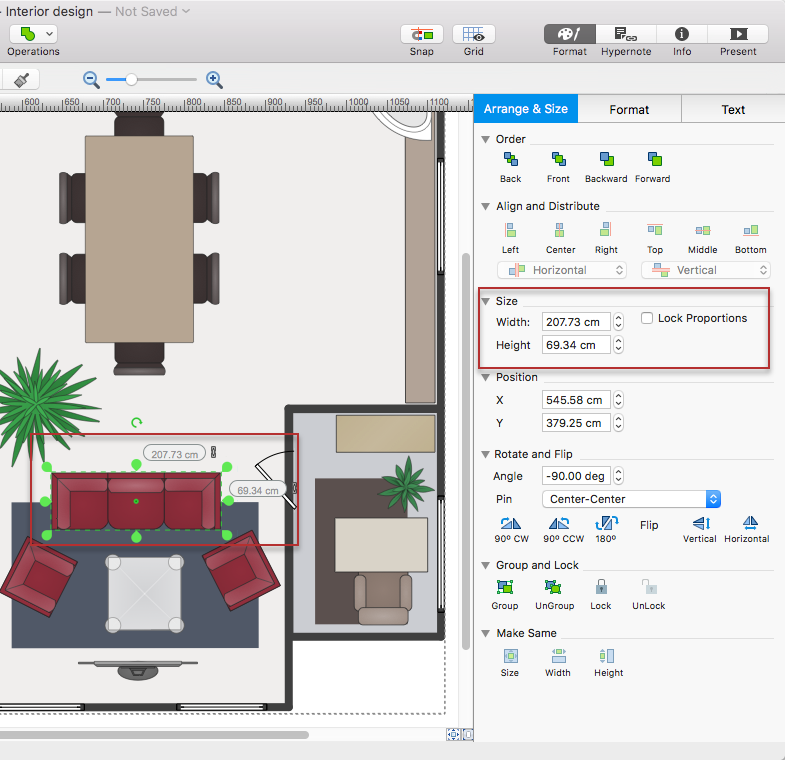
ConceptDraw DIAGRAM allows you to work with drawings with many different measurement units.HelpDesk
How to Create a Floor Plan
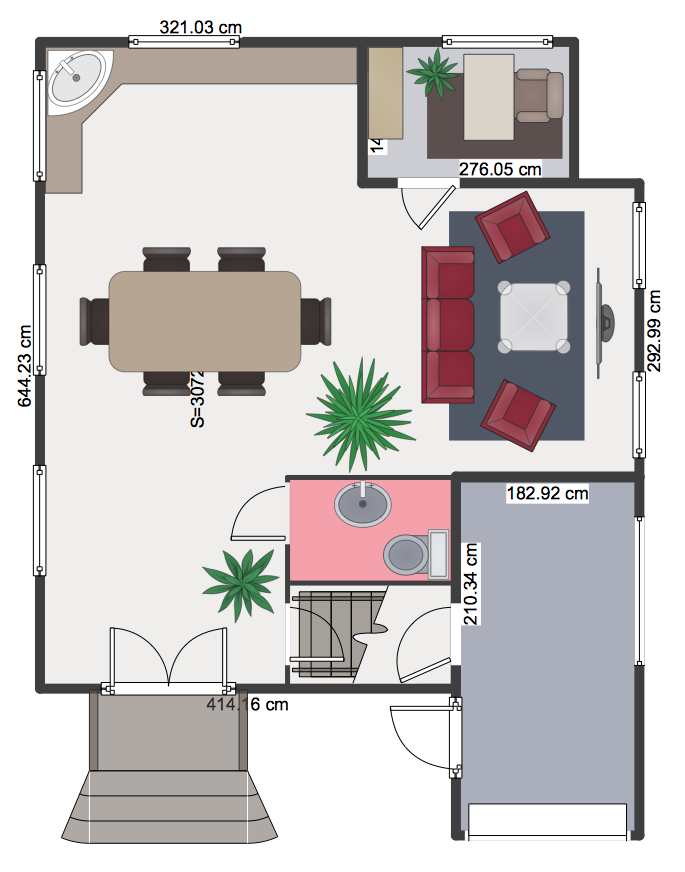
Making a floor plan is the best way to get a handle on how to organize your living space and find out what could be changed. Creating a floor plan to scale is a challenge of the home and interior design process and can be noticeably helpful for visualizing things like furniture layout. You can use ConceptDraw DIAGRAM to produce layouts of real estate properties. ConceptDraw DIAGRAM contains the large quantity of pre-designed vector objects that you can use for quick and easy designing such floor plans. You can easily determine the size of the rooms and distances in your drawing. The ability to create a floor plan is delivered by the Floor Plans solution. This solution extends ConceptDraw DIAGRAM with libraries that contain over 500 objects of floor plan elements. There is a set of special objects that display the sizes, corners, squares and other technical details using the current measurements of units.HelpDesk
How to Create a Plant Layout Design
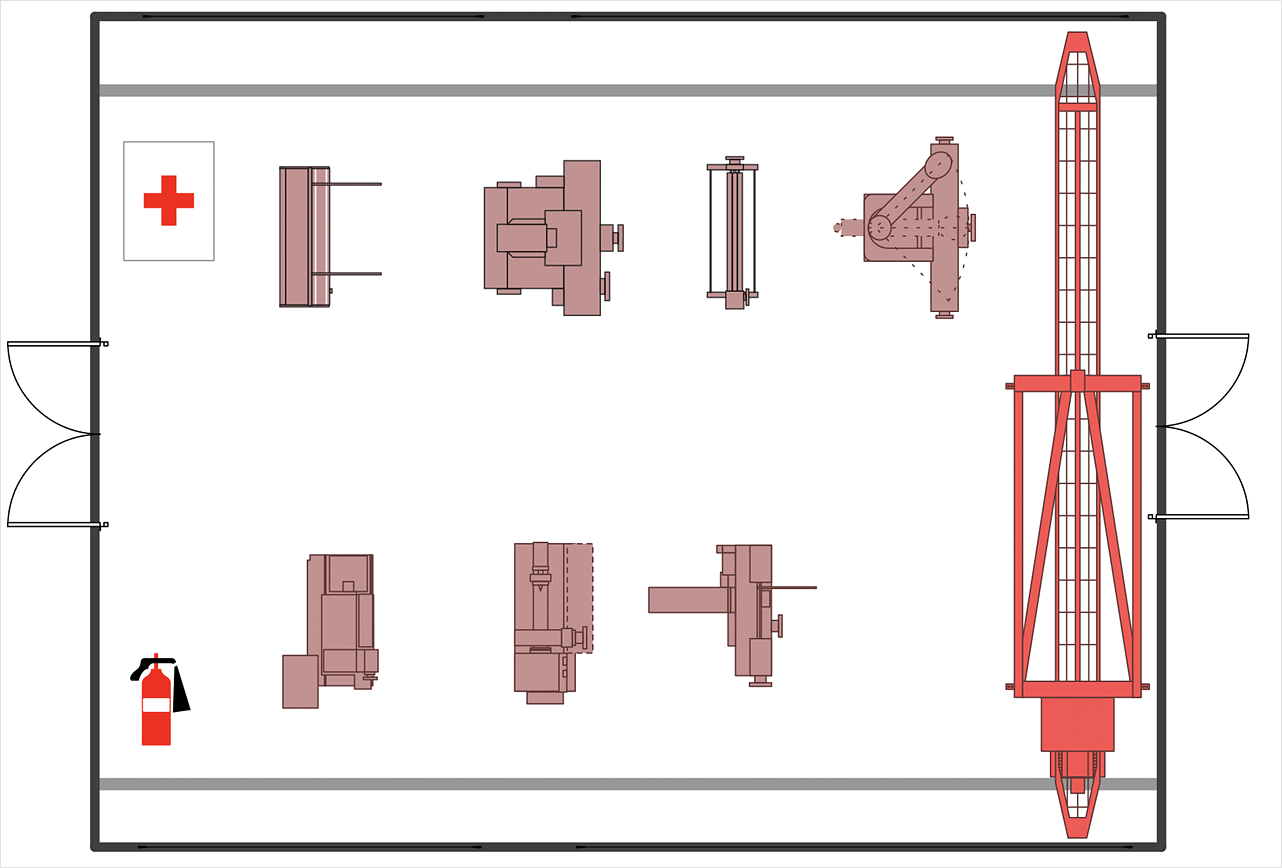
A plant construction process begins from a plant layout stage - an engineering stage used to design, analyze and finally choose the suitable configurations for a manufacturing plant. Plant Layout issues are core to any enterprise and are challenged in all types of manufacturing process. The sufficiency of layout influences the efficiency of subsequent operations. It is an important background for efficient manufacturing and also has a great deal with many questions. Once the place of the plant has been determined, the next important task before the management of the plant is to plan appropriate layout for the enterprise. Plant layout is used to create the most effective physical arrangement of machinery and equipment, with the plant building in such a manner so as to make quickest and cheapest way from a raw material to the shipment of the completed product Making a plan that shows the location of industrial equipment involves many different elements that can be managed using ConCreate Floor Plans Easily with ConceptDraw DIAGRAM
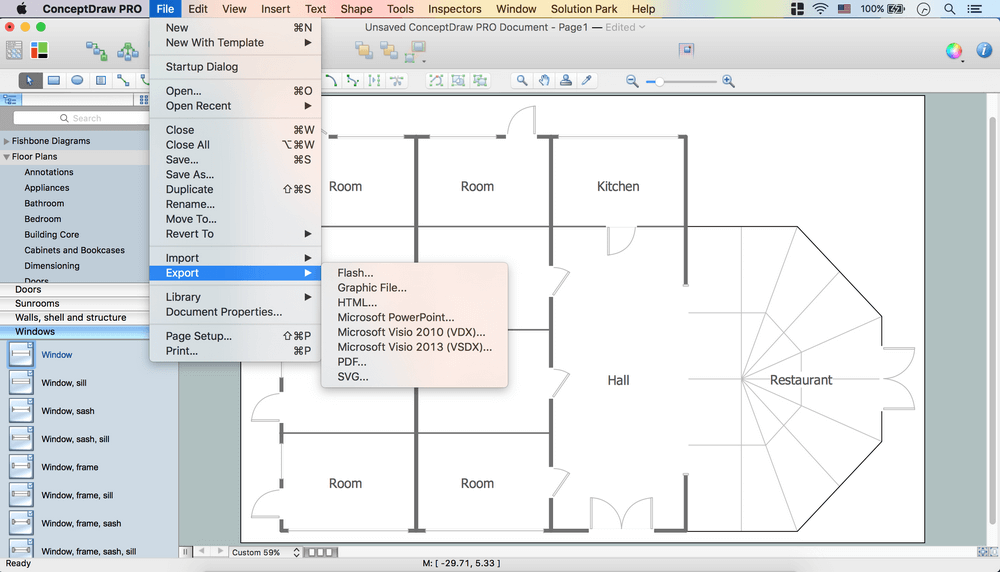
How to create Floor Plan Design easy and effectively? You can invite an interior designer and trust this work to him, which is usually expensive and result may not always meet your expectations. Another way is to design it yourself, but at this case you need to have special skills, knowledges and abilities, among them basic knowledge of the composition rules, color theory, materials science and software for interior design development. The ability to use specialized software for drawing is especially valuable, useful and saves your time. ConceptDraw DIAGRAM is one of the best among similar software, it offers extensive functionality, powerful tools, a lot of features, and is simple for using, so can be applied by everyone without efforts. Enhanced with Floor Plans and other solutions from the Building Plans area, the ConceptDraw DIAGRAM software helps easily create unique and harmonious interior designs, and draw in desired scale professional-looking Floor Plans and Layouts for homes, apartments, hotels, offices, and other buildings. ConceptDraw DIAGRAM is a full Visio compatibility and better alternative for students, teachers and business professionals to reliably create kinds of flowcharts, organizational charts, network diagrams, floor plans, electrical diagrams, software design diagrams, maps and more.
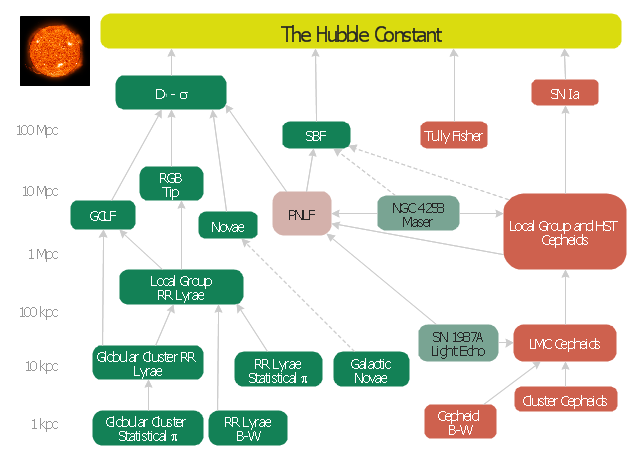
This astronomic diagram example was redesigned from the Wikimedia Commons file: Extragalactic distance ladder.JPG.
[commons.wikimedia.org/ wiki/ File:Extragalactic_ distance_ ladder.JPG]
Red boxes: Technique applicable to star-forming galaxies.
Green boxes: Technique applicable to Population II galaxies.
Cyan boxes: Geometric distance technique.
Pink box: The planetary nebula luminosity function technique is applicable to all populations of the Virgo Supercluster.
Solid lines: Well calibrated ladder step.
Dashed lines: Uncertain calibration ladder step.
"The cosmic distance ladder (also known as the extragalactic distance scale) is the succession of methods by which astronomers determine the distances to celestial objects. A real direct distance measurement of an astronomical object is possible only for those objects that are "close enough" (within about a thousand parsecs) to Earth. The techniques for determining distances to more distant objects are all based on various measured correlations between methods that work at close distances with methods that work at larger distances. Several methods rely on a standard candle, which is an astronomical object that has a known luminosity.
The ladder analogy arises because no one technique can measure distances at all ranges encountered in astronomy. Instead, one method can be used to measure nearby distances, a second can be used to measure nearby to intermediate distances, and so on. Each rung of the ladder provides information that can be used to determine the distances at the next higher rung." [Cosmic distance ladder. Wikipedia]
The astronomy diagram sample "Extragalactic distance ladder" was created using the ConceptDraw PRO diagramming and vector drawing software extended with the Astronomy solution from the Science and Education area of ConceptDraw Solution Park.
Star Network Topology
Star is a basic computer network topology in which all nodes (computers and peripheral devices) of the network are connected to the central hub or switch with a point-to-point connection, forming a physical network segment. Such network segment can function separately or as a part of complex network topology. The switch is a server, the peripherals are the clients. The large workload and functions of network management are entrusted on the central computer, all information exchange goes through it, so it must to be obligatory the most powerful. The star network topology is a simple topology for design and implementation. Its advantages are high performance, flexible administration capabilities, simplicity of adding additional nodes and search of faults, the fact that a failure of one workstation doesn't affect the work of entire network. But the failure of central hub will result the failure of whole network or network segment - it's the main disadvantage. Use the ConceptDraw DIAGRAM with Computer and Networks solution to designing Star Network Topology Diagrams fast and easy.
 Seven Management and Planning Tools
Seven Management and Planning Tools solution extends ConceptDraw DIAGRAM and ConceptDraw MINDMAP with features, templates, samples and libraries of vector stencils for drawing management mind maps and diagrams.
 HR Dashboard
The HR Dashboard solution extends ConceptDraw DIAGRAM functionality with powerful drawing tools and great collection of comprehensive vector design elements, icons, pictograms and objects, navigation elements, live objects of HR charts, HR indicators, and thematic maps. The range of HR Dashboards applications is extensive, among them the human resource management, recruitment, hiring process, human resource development. ConceptDraw DIAGRAM software is perfect for creation HR Dashboard with any goal you need. It gives you all opportunities for designing not only informative, but also professional looking and attractive HR Dashboards of any style and degree of detalization, that are perfect for using in presentations, reports and other thematic documents.
Business Tools Perceptual Mapping
This sample shows the Perceptual map. It was created in ConceptDraw DIAGRAM diagramming and vector drawing software using the Matrices Solution from the Marketing area of ConceptDraw Solution Park. Perception Mapping helps organizations measure and transform all aspects of their business, people and culture. Perception Mapping allows to represent the complex relationships graphically, helps identify potential problems of the organization and make the best decisions.SWOT analysis matrix diagram templates
SWOT analysis or SWOT Matrix is a structured method of the planning which is used to evaluate the S - Strengths, W - Weaknesses, O - Opportunities, and T - Threats involved in a business project or commercial venture. It was introduced at 1960s as a tool for learning the internal capabilities of large companies. A SWOT analysis includes the indication of the project's goal, specification the critical factors (internal and external) that influence on the achievement of company's business goal, that are conducive or adverse for this. SWOT analysis is effective way to successful business, to win in rivalry with competitors and become the best on your market. SWOT Analysis solution from Management area of ConceptDraw Solution Park makes the ConceptDraw DIAGRAM a powerful SWOT and TOWS analysis software. It contains a lot of vector design elements of SWOT and TOWS matrices, numerous examples and templates. The predesigned SWOT example or template is a fastest way of drawing professional-looking SWOT Matrix and presenting analysis results in just one click.- Concept Draw Measure To Scale
- How to Change the Measurement Units and Drawing Scale | How to ...
- How to Change Measurement Units in ConceptDraw Drawing | How ...
- Draw Scale Professional
- Measure Elements
- Restaurant Dimensions For Floor Plan
- How to Change the Measurement Units and Drawing Scale | How to ...
- Floor Plan Samples With Measurements
- Scale Drawing
- Scale
