Microsoft Azure

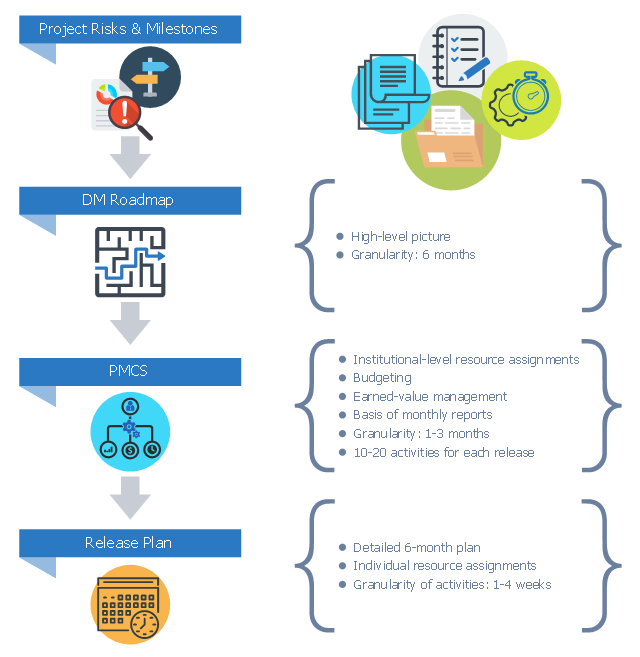
This business infographic sample shows the primary project work plans during research and development (R&D). It was designed on the base of the diagram "Planning Documents Flowdown" from the wiki of the Large Synoptic Survey Telescope (LSST) project.
[dev.lsstcorp.org/ trac/ wiki/ PlanningReportingProcess#DataManagementReportingProcess]
"Research and development (R&D), also known in Europe as research and technical (or technological) development (RTD), is a general term for activities in connection with corporate or governmental innovation. Research and development is a component of Innovation and is situated at the front end of the Innovation life cycle. Innovation builds on R&D and includes commercialization phases." [Research and development. Wikipedia]
The business infographic example "Planning documents flowdown" was designed using ConceptDraw PRO diagramming and vector drawing software extended with the Business and Finance solution from Illustration area of ConceptDraw Solution Park.
Infographic
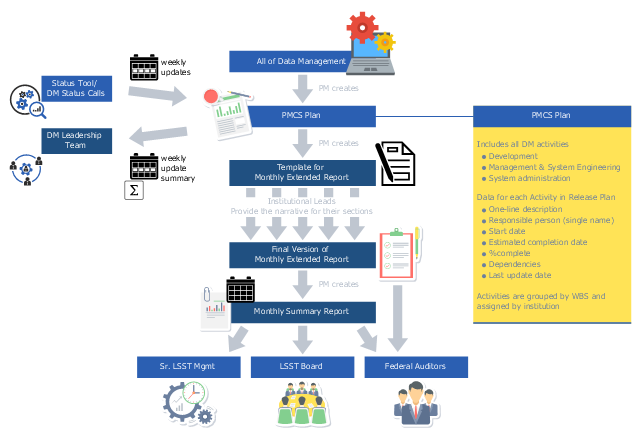
This business infographic sample depicts the project data management reporting system processes. It was designed on the base of the diagram "Weekly Updates and Monthly Reports" from the wiki of the Large Synoptic Survey Telescope (LSST) project.
" The DM project uses the following process for monthly reporting:
1. ... the DM Project Manager maintains data challenge release and management/ system engineering plans in the LSST Project Management Control System (PMCS). Each activity in the plan includes the name of the activity, expected start and end dates, and assignees (with primary/ lead person listed first).
2. The LSST Project provides a web-based tool for weekly status reporting against the plan. The status collected included % complete, actual and expected start and finish dates, and comments."
[dev.lsstcorp.org/ trac/ wiki/ PlanningReportingProcess#DataManagementReportingProcess]
"Data management comprises all the disciplines related to managing data as a valuable resource." [Data management. Wikipedia]
The business infographic example "Data management reporting process" was designed using ConceptDraw PRO diagramming and vector drawing software extended with the Business and Finance solution from Illustration area of ConceptDraw Solution Park.
Infographic
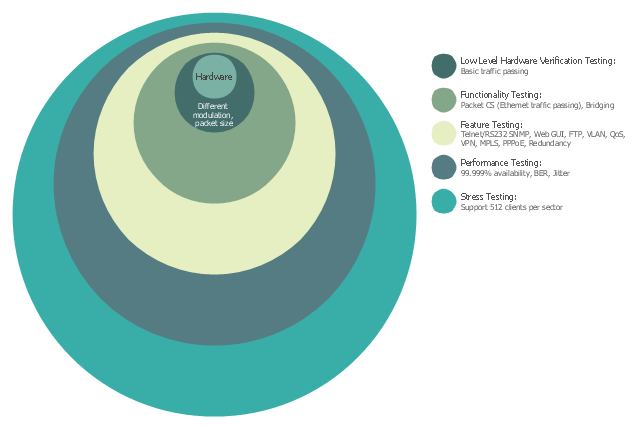
This example was designed on the base of Wikimedia Commons file: Wimax dev onion.jpg. [commons.wikimedia.org/ wiki/ File:Wimax_ dev_ onion.jpg]
"WiMAX (Worldwide Interoperability for Microwave Access) is a family of wireless communications standards initially designed to provide 30 to 40 megabit-per-second data rates, with the 2011 update providing up to 1 Gbit/ s for fixed stations." [WiMAX. Wikipedia]
The example "WiMAX development onion diagram" was drawn using the ConceptDraw PRO software extended with the Stakeholder Onion Diagrams solution from the Management area of ConceptDraw Solution Park.
Onion diagram example
Entity Relationship Diagram Examples


Scrum process work items and workflow

- Chen's ERD of MMORPG | Entity Relationship Diagram Software ...
- iOS 8 / iPhone 6 home screen - Template | Messages - Template ...
- Project Timeline | Program Evaluation and Review Technique ...
- Basic Flowchart Symbols and Meaning | Solving quadratic equation ...
- WiMAX development onion diagram | Tranzeo - Vector stencils ...
- Gant Chart in Project Management | Program Evaluation and ...
- Systems development life cycle | Structured Systems Analysis and ...
- Data flow Model Diagram
- Swim Lane Flowchart Symbols | Cross-Functional Flowchart (Swim ...
- Site Plans | Building Drawing Software for Design Site Plan ...
- Process Flowchart | Basic Flowchart Symbols and Meaning | Types ...
- Process Flowchart | IDEF0 standard with ConceptDraw PRO ...
- Basic Flowchart Symbols and Meaning | Example Process Flow ...
- Project —Task Trees and Dependencies | | Software Work Flow ...
- Top 5 Android Flow Chart Apps | Data Flow Diagrams | Technical ...
- Types of Flowcharts | WiMAX development onion diagram | Trouble ...
- WiMAX development onion diagram | Onion Diagram Process ...
- Excellent Examples of Infographic Maps | Data management ...
- What is Gantt Chart (historical reference) | PM Teams | PM Personal ...
- UML Deployment Diagram Example - ATM System UML diagrams ...