- Electric and Telecom Plans Free
- Fire and Emergency Plans Free
- Floor Plans Free
- Plant Layout Plans Free
- School and Training Plans Free
- Seating Plans Free
- Security and Access Plans Free
- Site Plans Free
- Sport Field Plans Free
- Business Process Diagrams Free
- Business Process Mapping Free
- Classic Business Process Modeling Free
- Cross-Functional Flowcharts Free
- Event-driven Process Chain Diagrams Free
- IDEF Business Process Diagrams Free
- Logistics Flow Charts Free
- Workflow Diagrams Free
- ConceptDraw Dashboard for Facebook Free
- Mind Map Exchange Free
- MindTweet Free
- Note Exchange Free
- Project Exchange Free
- Social Media Response Free
- Active Directory Diagrams Free
- AWS Architecture Diagrams Free
- Azure Architecture Free
- Cisco Network Diagrams Free
- Cisco Networking Free
- Cloud Computing Diagrams Free
- Computer Network Diagrams Free
- Google Cloud Platform Free
- Interactive Voice Response Diagrams Free
- Network Layout Floor Plans Free
- Network Security Diagrams Free
- Rack Diagrams Free
- Telecommunication Network Diagrams Free
- Vehicular Networking Free
- Wireless Networks Free
- Comparison Dashboard Free
- Composition Dashboard Free
- Correlation Dashboard Free
- Frequency Distribution Dashboard Free
- Meter Dashboard Free
- Spatial Dashboard Free
- Status Dashboard Free
- Time Series Dashboard Free
- Basic Circle-Spoke Diagrams Free
- Basic Circular Arrows Diagrams Free
- Basic Venn Diagrams Free
- Block Diagrams Free
- Concept Maps Free
- Family Tree Free
- Flowcharts Free
- Basic Area Charts Free
- Basic Bar Graphs Free
- Basic Divided Bar Diagrams Free
- Basic Histograms Free
- Basic Line Graphs Free
- Basic Picture Graphs Free
- Basic Pie Charts Free
- Basic Scatter Diagrams Free
- Aerospace and Transport Free
- Artwork Free
- Audio, Video, Media Free
- Business and Finance Free
- Computers and Communications Free
- Holiday Free
- Manufacturing and Maintenance Free
- Nature Free
- People Free
- Presentation Clipart Free
- Safety and Security Free
- Analog Electronics Free
- Audio and Video Connectors Free
- Basic Circuit Diagrams Free
- Chemical and Process Engineering Free
- Digital Electronics Free
- Electrical Engineering Free
- Electron Tube Circuits Free
- Electronic Block Diagrams Free
- Fault Tree Analysis Diagrams Free
- GHS Hazard Pictograms Free
- Home Automation and Wiring Free
- Mechanical Engineering Free
- One-line Diagrams Free
- Power Сircuits Free
- Specification and Description Language (SDL) Free
- Telecom and AV Circuits Free
- Transport Hazard Pictograms Free
- Data-driven Infographics Free
- Pictorial Infographics Free
- Spatial Infographics Free
- Typography Infographics Free
- Calendars Free
- Decision Making Free
- Enterprise Architecture Diagrams Free
- Fishbone Diagrams Free
- Organizational Charts Free
- Plan-Do-Check-Act (PDCA) Free
- Seven Management and Planning Tools Free
- SWOT and TOWS Matrix Diagrams Free
- Timeline Diagrams Free
- Australia Map Free
- Continent Maps Free
- Directional Maps Free
- Germany Map Free
- Metro Map Free
- UK Map Free
- USA Maps Free
- Customer Journey Mapping Free
- Marketing Diagrams Free
- Matrices Free
- Pyramid Diagrams Free
- Sales Dashboard Free
- Sales Flowcharts Free
- Target and Circular Diagrams Free
- Cash Flow Reports Free
- Current Activities Reports Free
- Custom Excel Report Free
- Knowledge Reports Free
- MINDMAP Reports Free
- Overview Reports Free
- PM Agile Free
- PM Dashboards Free
- PM Docs Free
- PM Easy Free
- PM Meetings Free
- PM Planning Free
- PM Presentations Free
- PM Response Free
- Resource Usage Reports Free
- Visual Reports Free
- House of Quality Free
- Quality Mind Map Free
- Total Quality Management TQM Diagrams Free
- Value Stream Mapping Free
- Astronomy Free
- Biology Free
- Chemistry Free
- Language Learning Free
- Mathematics Free
- Physics Free
- Piano Sheet Music Free
- Android User Interface Free
- Class Hierarchy Tree Free
- Data Flow Diagrams (DFD) Free
- DOM Tree Free
- Entity-Relationship Diagram (ERD) Free
- EXPRESS-G data Modeling Diagram Free
- IDEF0 Diagrams Free
- iPhone User Interface Free
- Jackson Structured Programming (JSP) Diagrams Free
- macOS User Interface Free
- Object-Role Modeling (ORM) Diagrams Free
- Rapid UML Free
- SYSML Free
- Website Wireframe Free
- Windows 10 User Interface Free
Stakeholder Onion Diagrams
The Stakeholder Onion Diagram is often used as a way to view the relationships of stakeholders to a project goal, project result, or final product. The focus on the project goal is the primary difference that separates the Onion Diagram from other types of diagrams. Because most diagram styles focus on the project, stakeholders, or timeline. The supplementary information is often included in the diagram in addition to the project goal. Also, the Stakeholder Onion Diagram shows the dependencies among parts of an organization or process. Typically, the relationships between stakeholders and specific layers of a defined project are shown. Besides, it displays the importance of stakeholders, their influence on the project and the success of the final product.
Stakeholder Onion Diagram has a simple view that provides ease of reading and perception, but however, it has a strong visual impact on the audience. Most Stakeholder Onion Diagrams are composed of 4+ layers. The diagram contains a base circle, which is the smallest circle placed in the center and surrounded by concentric circles similar to the cross-sections of an onion. The main circle represents a product or solution. Each subsequent layer of the diagram contains additional project data and demonstrates the relationships that exist in the project environment. The component of each outer layer depends on the component within it.
There are no hard rules on what must or must not be contained in the Stakeholder Diagram. The key value of the Stakeholder Onion Diagram is to show the relationships that lead to a successful final product or deliverable. The Stakeholder Onion Diagram is intended to map out how projects are impacted by influence, support, or other KPI project metrics.
A basic Onion Diagram contains rich information. It shows the significance of stakeholders that will have an influence on the final product. The biggest benefit is the stakeholder analysis that passes after creating a diagram. Also, there could be a risk to make a mistake with relationships importance between stakeholders on the Onion Diagram. However, it emphasizes the project stakeholders that is often disregarded by most diagram tools.
The Stakeholder Onion Diagrams solution supplies ConceptDraw DIAGRAM with powerful tools to simplify the process of creating Stakeholder Onion Diagrams. It includes the set of pre-made vector objects and templates for a quick start, and collection of examples illustrating the solution's power. This solution is useful for all specialists in management and business, especially for those who prefer to use the newest progressive tools.
-
Buy this solution $49 -
Solution Requirements - This solution requires the following products to be installed:
ConceptDraw DIAGRAM v18 - This solution requires the following products to be installed:
-
Compatibility - Sonoma (14), Sonoma (15)
MS Windows 10, 11 - Sonoma (14), Sonoma (15)
-
Support for this Solution -
Helpdesk
Design Elements — Onion Diagrams with Sectors

Design Elements — Stakeholder Icons
Design Elements — Stakeholder Onion Diagrams

Stakeholder Onion Diagrams Examples
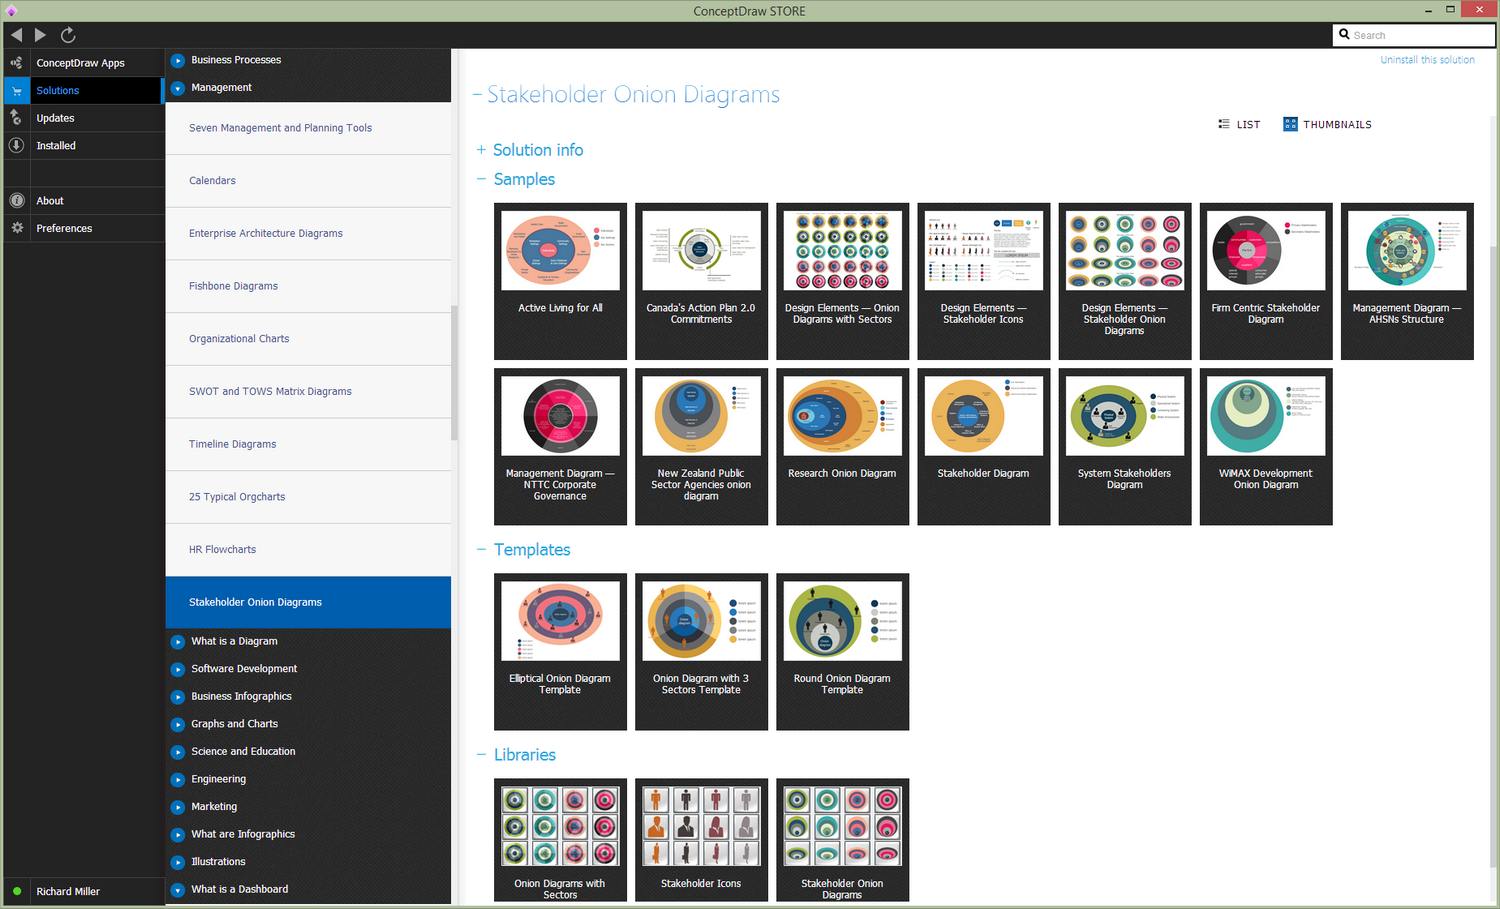
There are a few samples that you see on this page which were created in the ConceptDraw DIAGRAM application by using the Stakeholder Onion Diagrams solution. Some of the solution's capabilities as well as the professional results which you can achieve are all demonstrated here on this page.
All source documents are vector graphic documents which are always available for modifying, reviewing and/or converting to many different formats, such as MS PowerPoint, PDF file, MS Visio, and many other graphic ones from the ConceptDraw Solution Park or ConceptDraw STORE. The Stakeholder Onion Diagrams solution is available to all ConceptDraw DIAGRAM users to get installed and used while working in the ConceptDraw DIAGRAM diagramming and drawing software.
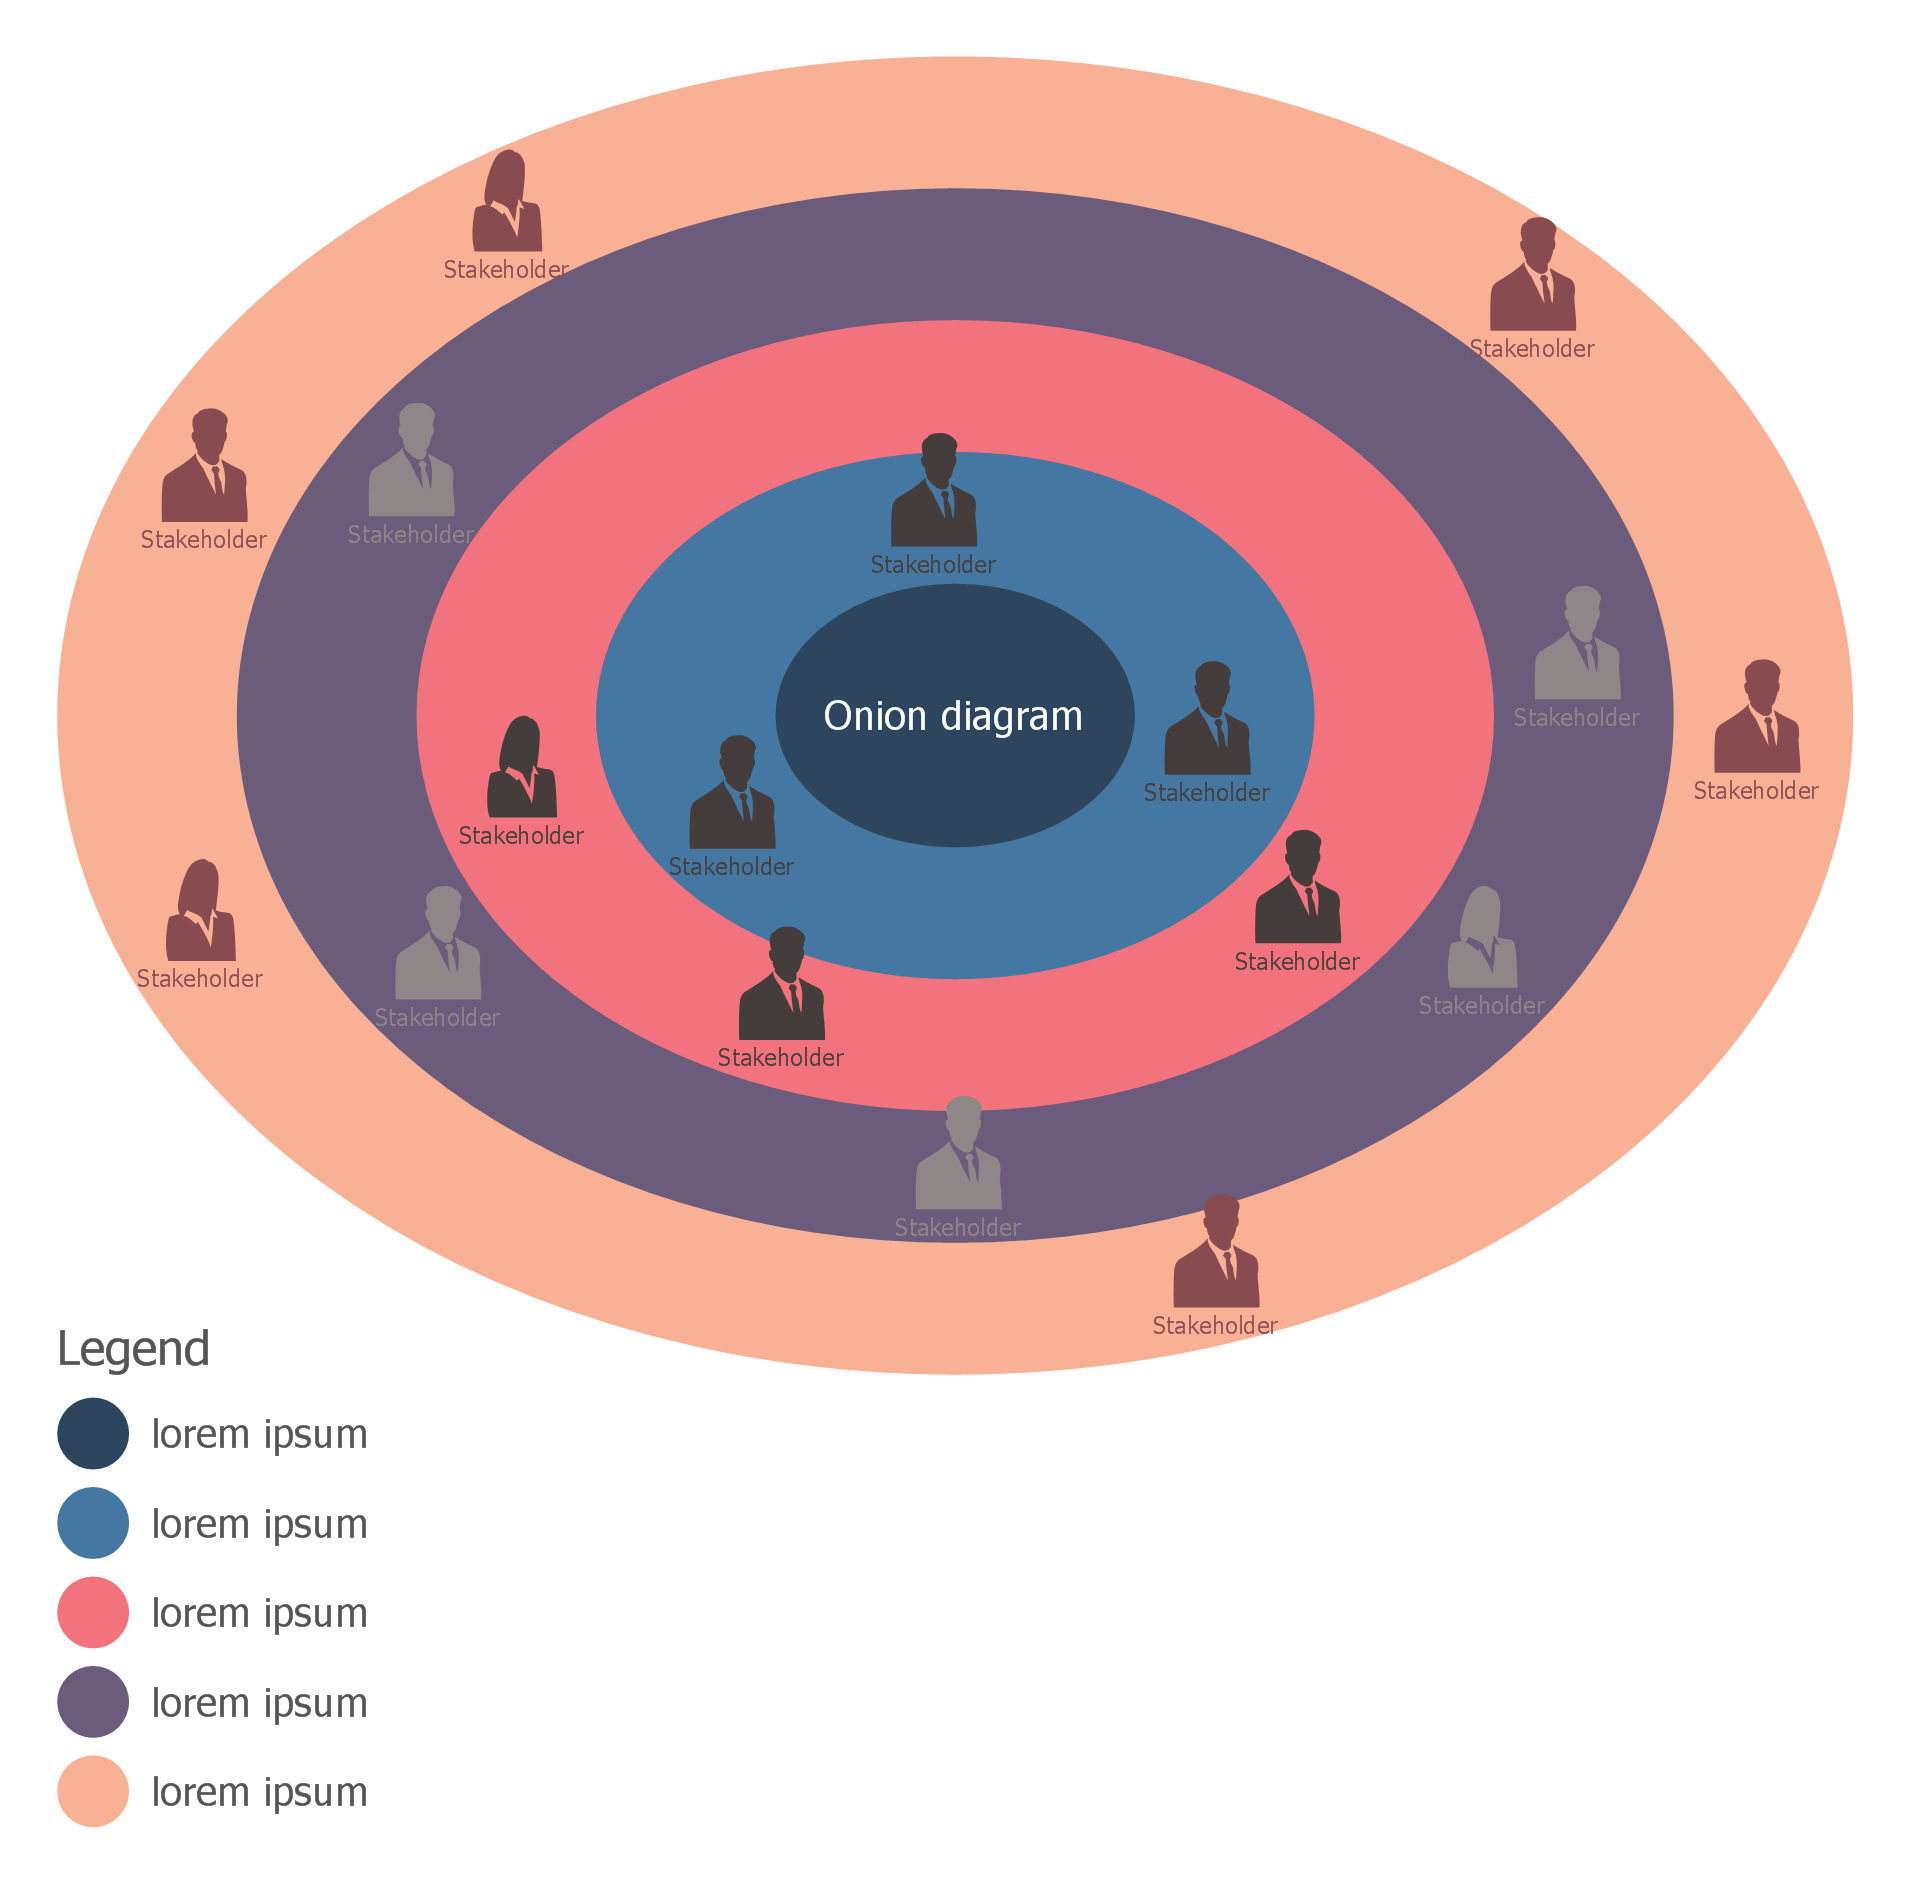
Template 1: Elliptical Onion Diagram
This template is an Elliptical Onion Diagram template included in the Stakeholder Onion solution. You can quick-start with it to create a Stakeholder Onion diagram. This type of diagram helps to identify the groups of stakeholders of different levels for your company. Primarily you can define the top-level stakeholders and then segment this level and identify more specific interest groups. Arrange stakeholders at different levels to determine their level of interest in the project and their impact on the end result of the project. The prioritization of stakeholders with an aim to determine their level of engagement and displaying this information in a visual view is incredibly useful for project management. This allows you to know and immediately determine the level of stakeholder engagement. Concerning that the level of engagement can change over time and vary from project to project, you can always correct your diagram created in ConceptDraw DIAGRAM and supply it with actual information in minutes.
Template 2: Onion Diagram With 3 Sectors
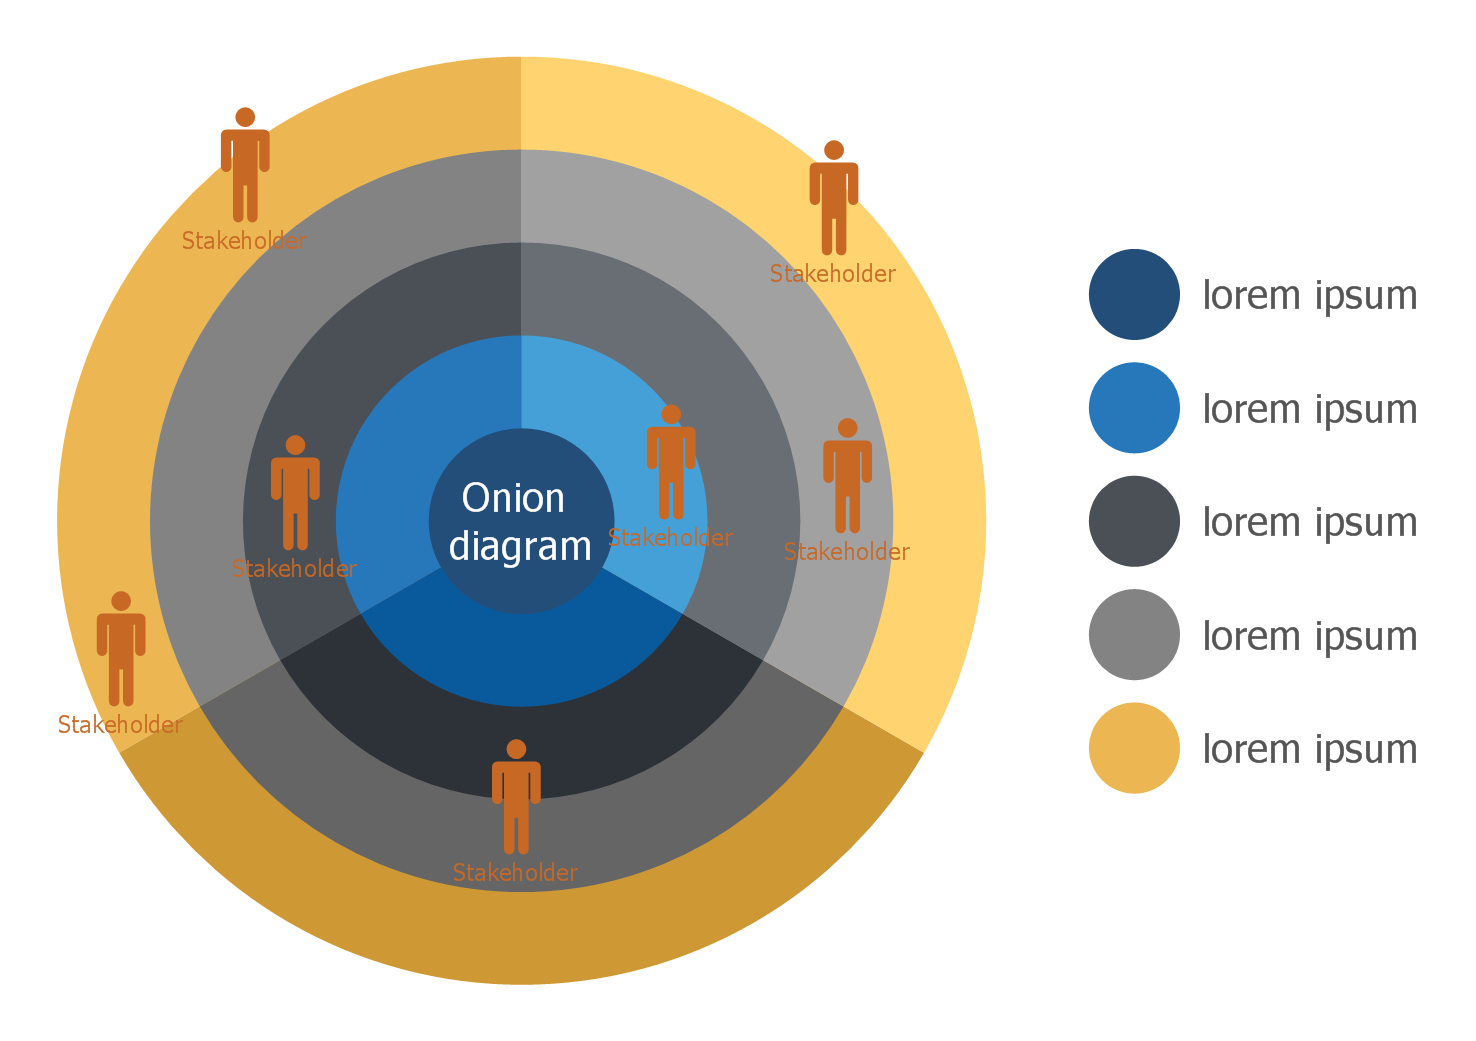
This template is for Stakeholder Onion Diagram with three sectors. Once you have a list of all stakeholders on a project, you can design your Stakeholder Onion Diagram. Use this template as a quick-start to create your own diagram. Open template, define the number of levels, and correct the number of concentric circles if needed. Arrange your stakeholders in circles of the diagram according to their engagement and level of influence on the project. Stakeholder Onion Diagram is a perfect way to explore your project's stakeholders, to understand their interests, motivations, concerns, etc. This template diagram includes three sectors colored with a different intensity that assists in differentiating the stakeholders. Each concentric layer has its own color, the correspondence of which is displayed in a legend, simply fill the legend items. You can change the radius of concentric layers, decrease/increase the width of sectors and change other parameters on your own.
Template 3: Round Onion Diagram
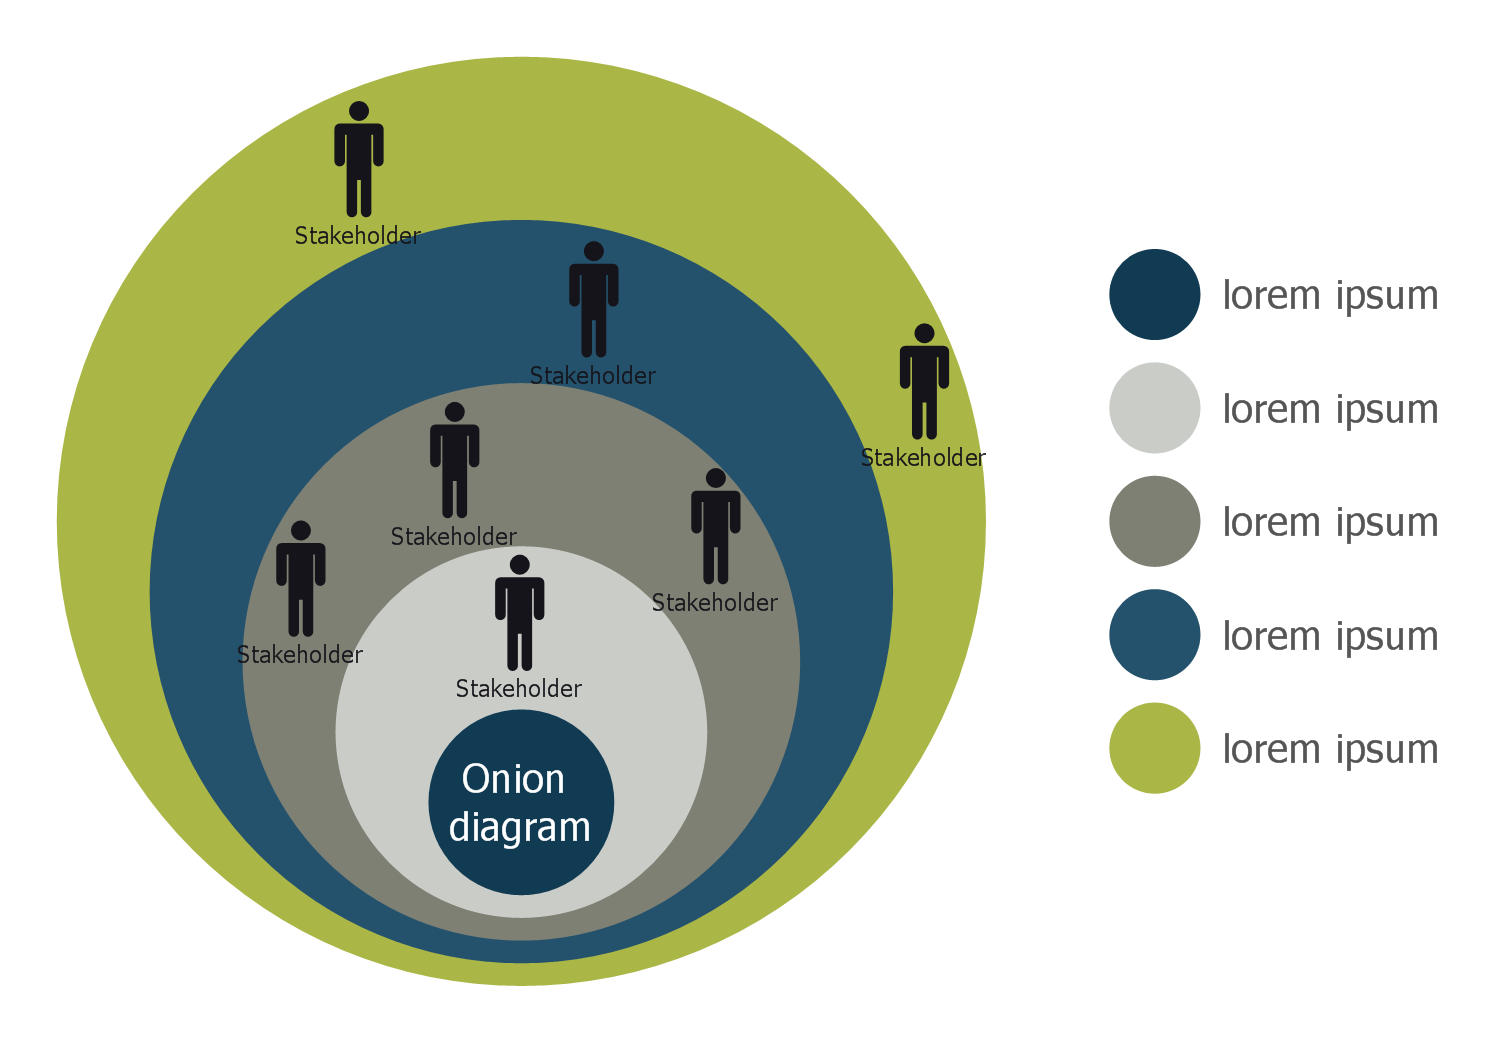
This template is a Round Onion Diagram template ready-made for ConceptDraw DIAGRAM users. It includes a central circle and four concentric layers surrounding it. All you have to do is just filling out this template. Enter the name of the product, solution, or goal in the center of the diagram. Then fill in the concentric layers with information about all stakeholders who interact with the project. On the diagram, they are indicated by the symbols of people. You can include both internal and external stakeholders, but place them at different levels. The higher is an influence of a stakeholder on the project, the closer to the center he is placed in the diagram. The stakeholders who are outside the company are commonly placed at the last level. Once the diagram is ready, you can change its style. You can select any layer and change its color or decrease/increase its radius using the control dots. You can also highlight those stakeholders who are particularly important for the project.
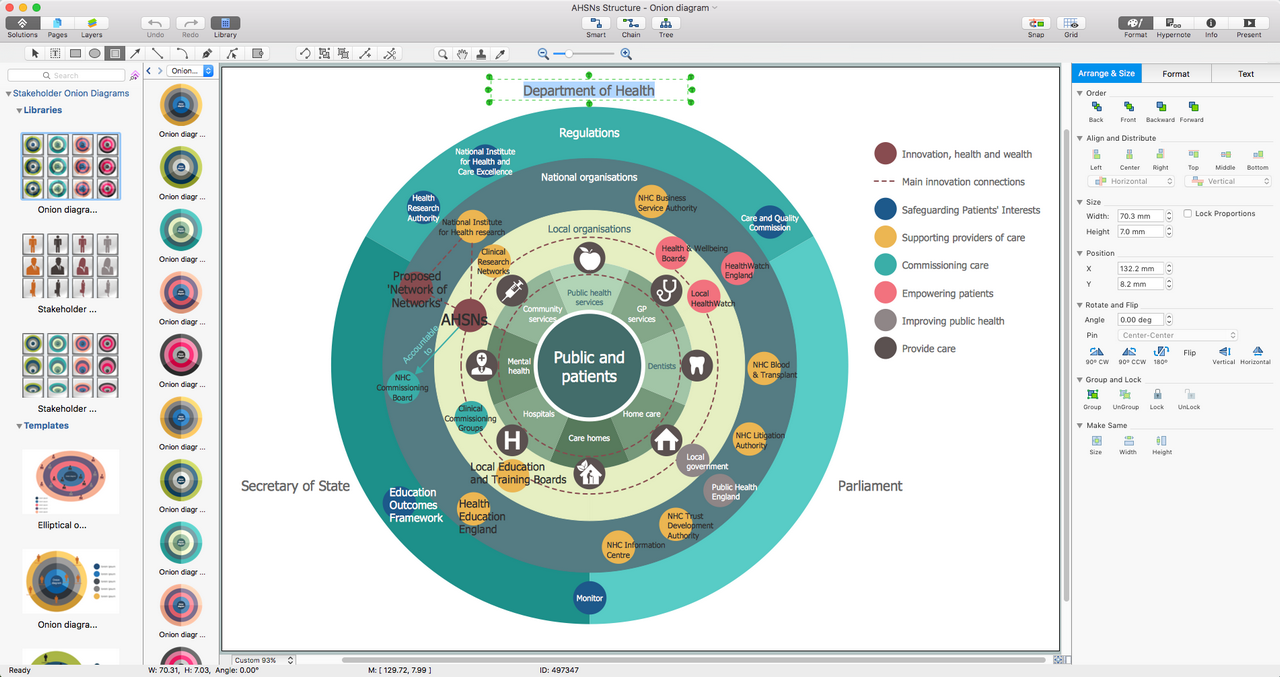
Example 1: Management Diagram — AHSNs Structure
This diagram was created in ConceptDraw DIAGRAM using the Onion Diagrams with Sectors and Stakeholder Icons libraries from the Stakeholder Onion Diagrams Solution. An experienced user spent 20 minutes creating this sample.
This Stakeholder Management Diagram excellently depicts the structure of Academic Health Science Networks (AHSNs). AHSNs is an organization created in England in 2013 with the purpose of unification of the health services, academic and industry members. Increasing the quality of medical care for patients and improving their outcomes are the AHSNs' key goals. AHSNs supposes the unification of healthcare and clinical research with informatics and innovations, adoption of integrated health care services. The innovations in healthcare and their adoption in use are encouraged and are actively promoted by AHSNs. Naturally, all this offers great economic benefits for the UK, because healthcare is one of the key economic factors and achievements in this sector entail the overall economic growth. This sample displays local and national healthcare organizations, the services provided for public and patients in the health sector, regulations and innovations in health and wealth, ways to provide care, improve public health, support providers of care, and much more useful information.

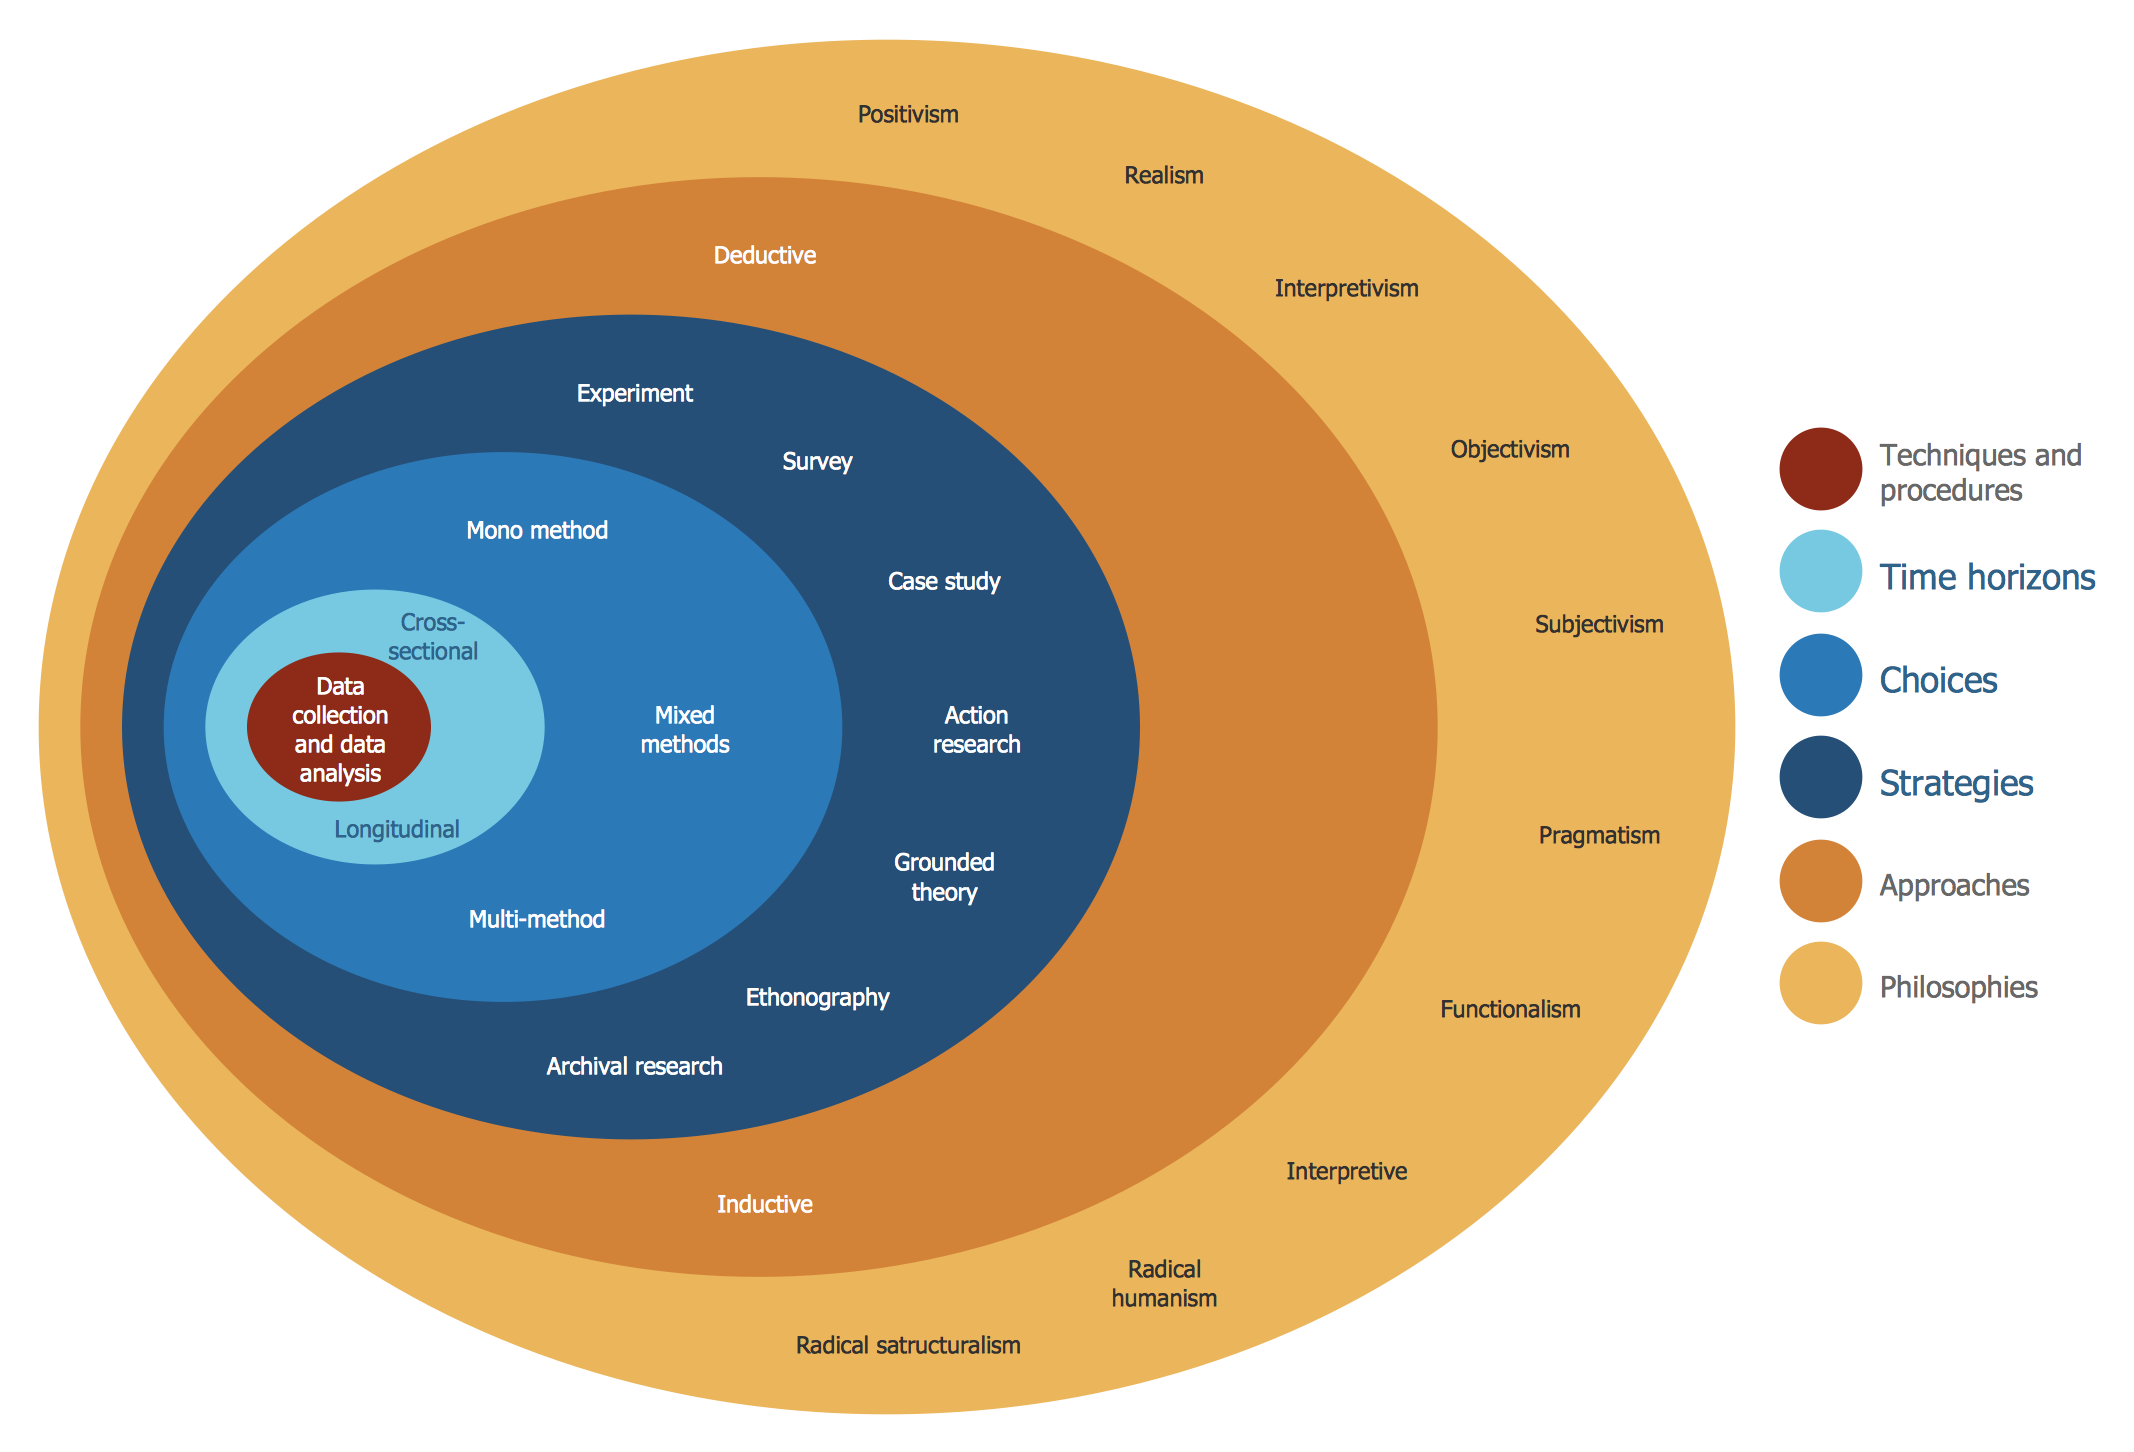
Example 2: Research Onion Diagram
This diagram was created in ConceptDraw DIAGRAM using the Stakeholder Onion Diagrams and Stakeholder Icons libraries from the Stakeholder Onion Diagrams Solution. An experienced user spent 10 minutes creating this sample.
This sample shows the research Onion Diagram. The research onion was introduced by Saunders et al in 2007. It displays the steps a researcher goes through to develop an effective methodology. The field of study includes six levels: philosophy of research, approaches to research, research strategies, choice of research, time horizons, techniques, and procedures. The key idea is that you start from the outside layer and peel each new one away until you reach the core. The research philosophy describes the set of beliefs the research is built on. The next layer provides two kinds of research approaches to collect and analyze data (inductive and deductive). The research strategy layer includes the ways to conduct research. The choices layer defines how many data types will be used in the research (mono, mixed, or multi-method). The time horizon describes the number of points to collect data (cross-sectional or longitudinal). Finally, it focuses on the methods and procedures used to collect data and conduct research.
Example 3: System Stakeholders Diagram
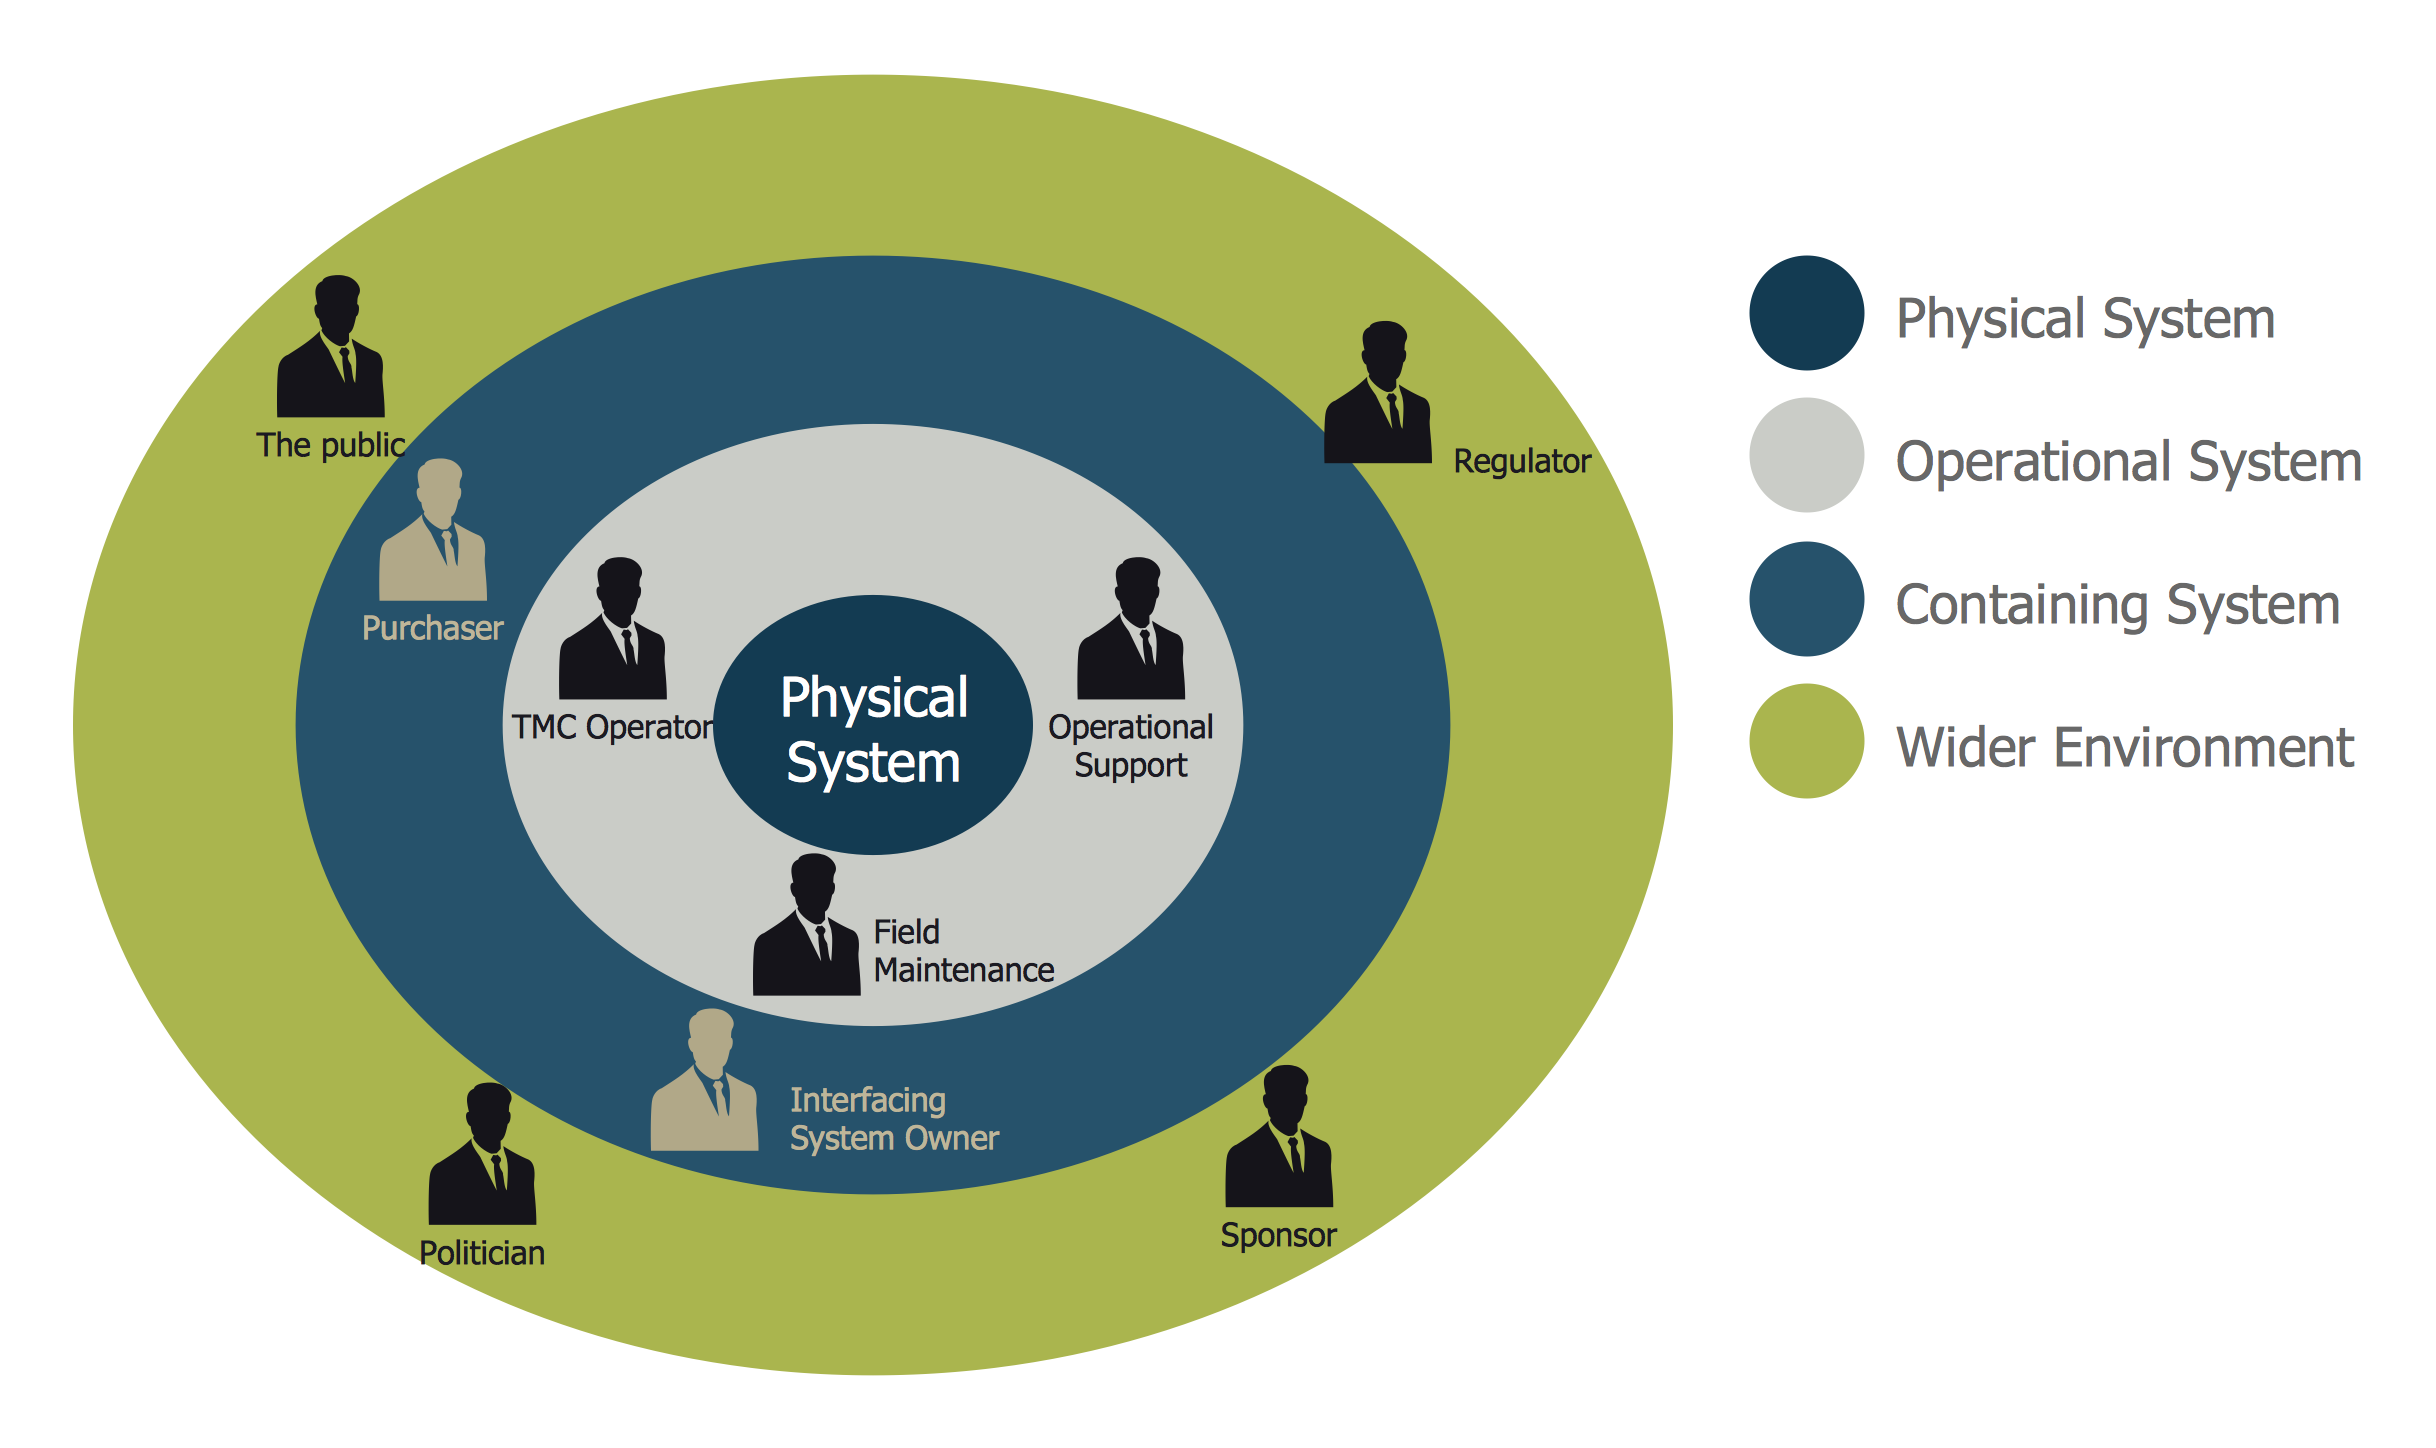
This diagram was created in ConceptDraw DIAGRAM using the Stakeholder Onion Diagrams and Stakeholder Icons libraries from the Stakeholder Onion Diagrams Solution. An experienced user spent 5 minutes creating this sample.
This sample shows the System Stakeholder Diagram and was designed based on the slide from the presentation "A103: Introduction to ITS Standards Requirements Development" published on the website of the U.S. Department of Transportation. The diagram is constructed in accordance with all rules of building Stakeholder Onion Diagrams and includes four ring layers. A physical system is placed in the central ring, the second ring contains an operational system. The third and fourth rings display a containing system and a wider environment correspondingly. All stakeholders are also displayed in the diagram. Each stakeholder is presented by a person's symbol and has its own role in a project. The stakeholder's level of influence on the physical system is defined from its layer in the diagram. The central circle presents a physical system and has no people. The second layer includes three persons — TMC operator, operational support, and field maintenance. The third layer includes only two persons — a system owner and a purchaser. And the last layer has four persons — a sponsor of the project, a regulatory agency, the public, and a politician.
Example 4: Management Diagram — NTTC Corporate Governance
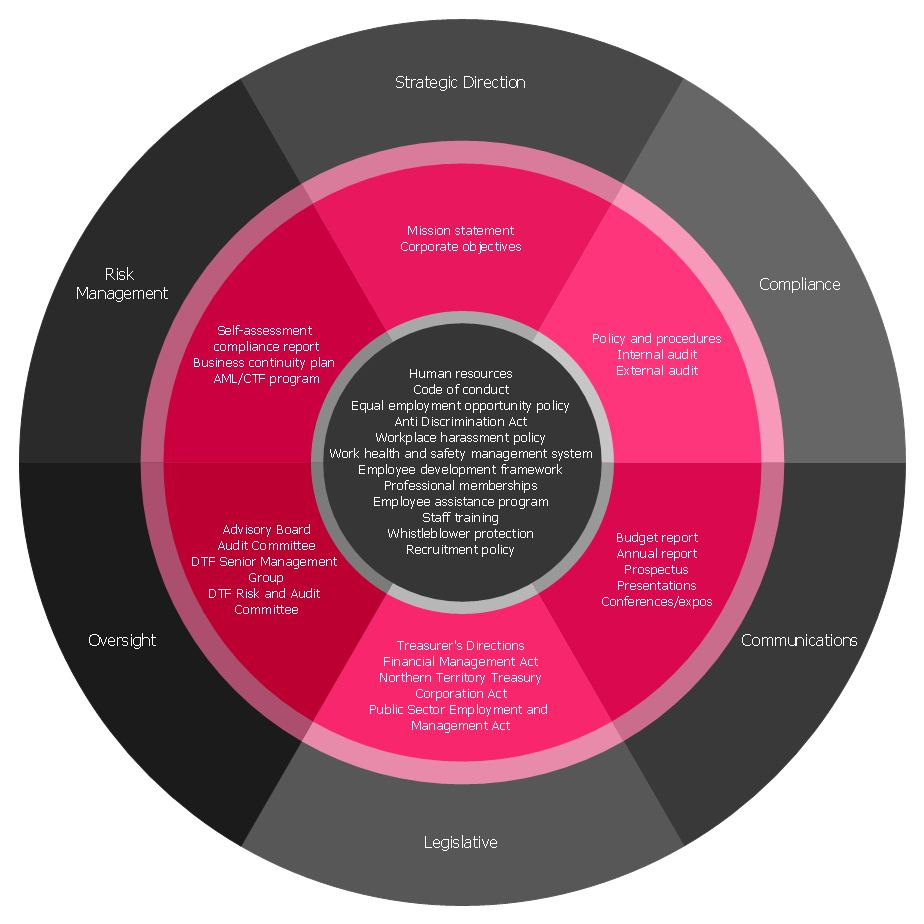
This diagram was created in ConceptDraw DIAGRAM using the Onion Diagrams with Sectors library from the Stakeholder Onion Diagrams Solution. An experienced user spent 10 minutes creating this sample.
This Management diagram shows the structure and processes of NTTC corporate governance. The distribution of rights and responsibilities and guidance relations among different participants in the corporation is realized by corporate governance. Corporate governance coordinates the interests of all stakeholders and helps to avoid conflicts between them. In general, corporate governance includes all mechanisms, processes, principles, and relationships that management uses to control and manage the corporation. It also includes rules, structures and procedures for making decisions, tracking actions, policies, practices, and decisions of the corporation and affected stakeholders. NTTC's corporate governance is displayed as a pie chart — an onion chart with three layers of rings. Make your diagrams colorful, eye-catching, and vibrant to ensure their success, and add accents of color to grab the attention of your coworkers and others who are following your diagram for important details.
Example 5: Canada's Action Plan 2.0 Commitments
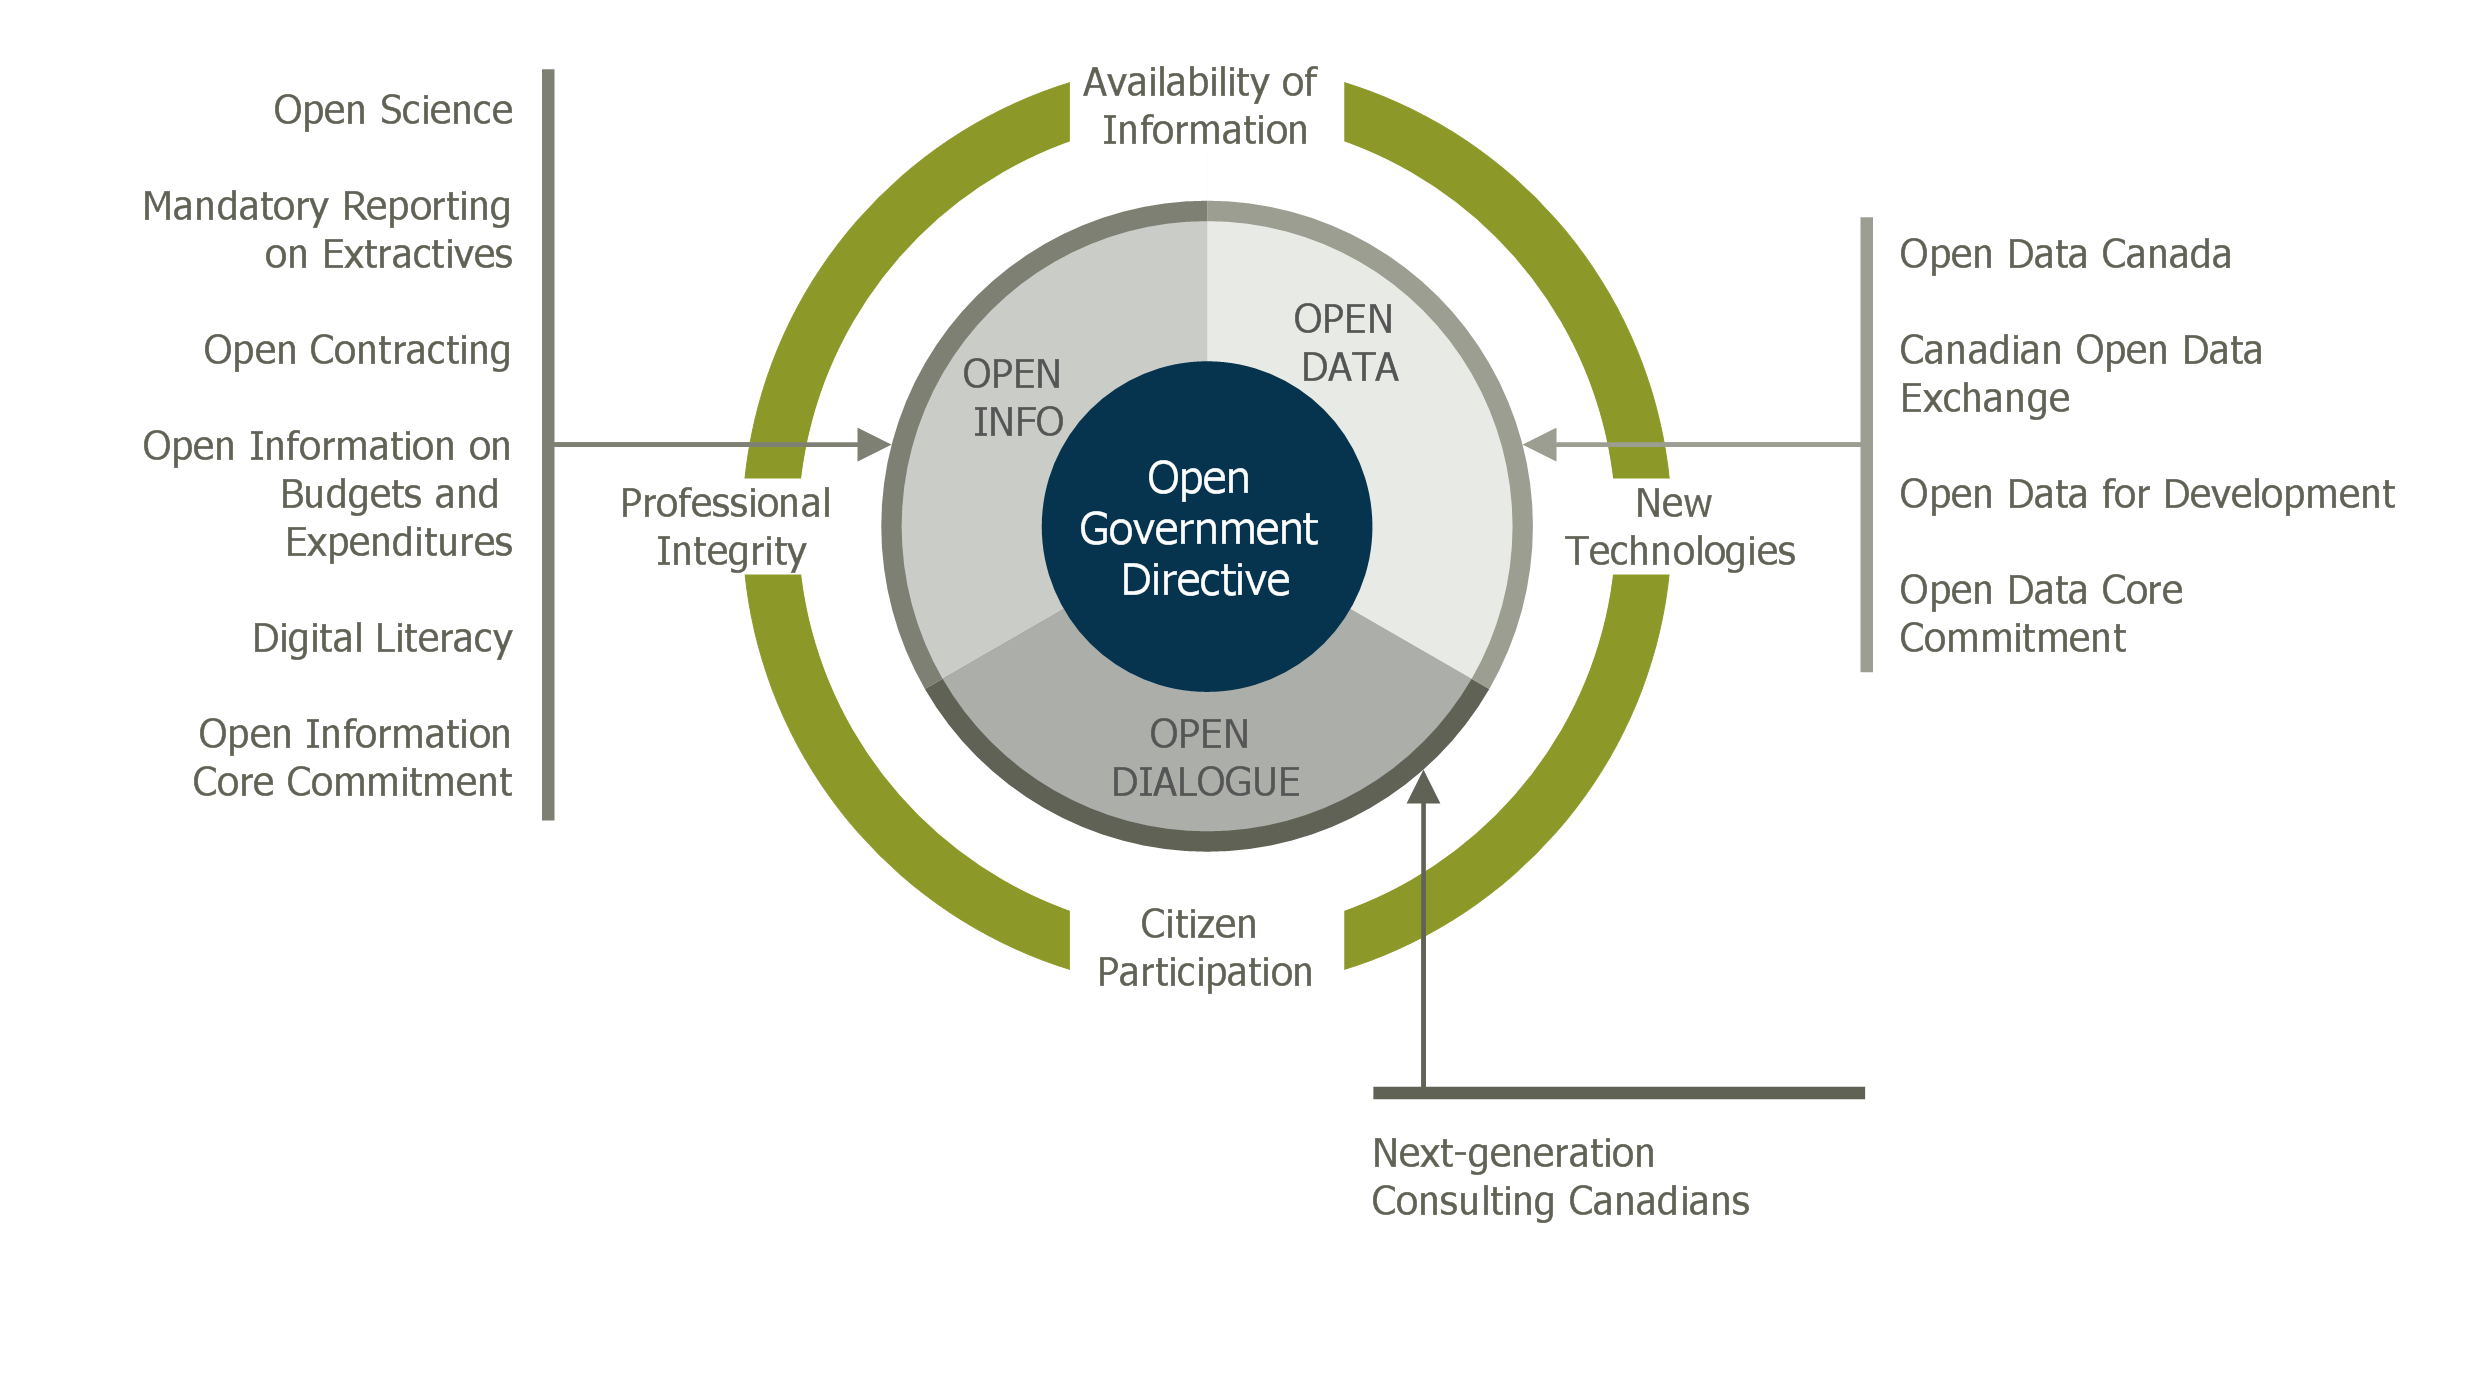
This diagram was created in ConceptDraw DIAGRAM using the Onion Diagrams with Sectors library from the Stakeholder Onion Diagrams Solution. An experienced user spent 10 minutes creating this sample.
This Stakeholder Onion Diagram visually structures information about the Open Government Action Plan 2.0 launched by Canada's Government in November 2014. It was developed in consultation with citizens, the private sector, and civil society organizations. The plan consists of 12 commitments and specifies the ways for the federal government to create a more open and transparent government, and maximize sharing of government information. Open government includes three key streams, including open information, open data, and open dialogue. Open data includes Open Data Core Commitment, Open Data in Canada, Open Data for Development, and Open Data Exchange commitments in Canada. The open information commitments included to the Action Plan 2.0 suppose Open Science, Mandatory Reporting on Extractives, Open Contracting, Digital Literacy, Open Information Core Commitment, Open Information on Budgets and Expenditures. The open dialogue supposes the Next-generation Consulting Canadians. As for the key open government principles, they include four points: availability of information, citizen participation, professional integrity, and new technologies.
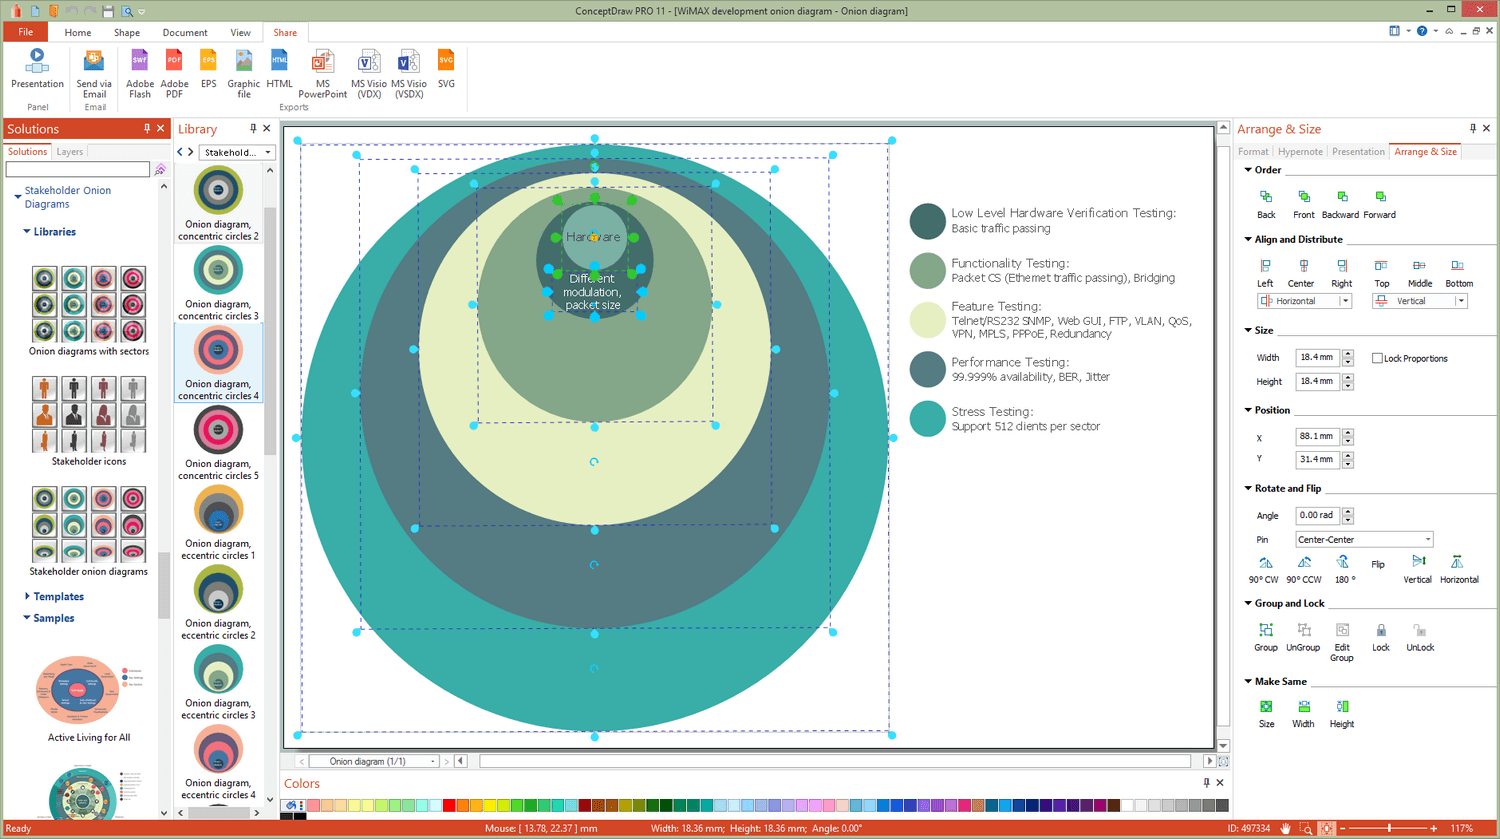
Example 6: WiMAX Development Onion Diagram
This diagram was created in ConceptDraw DIAGRAM using the Onion Diagrams with Sectors library from the Stakeholder Onion Diagrams Solution. An experienced user spent 10 minutes creating this sample.
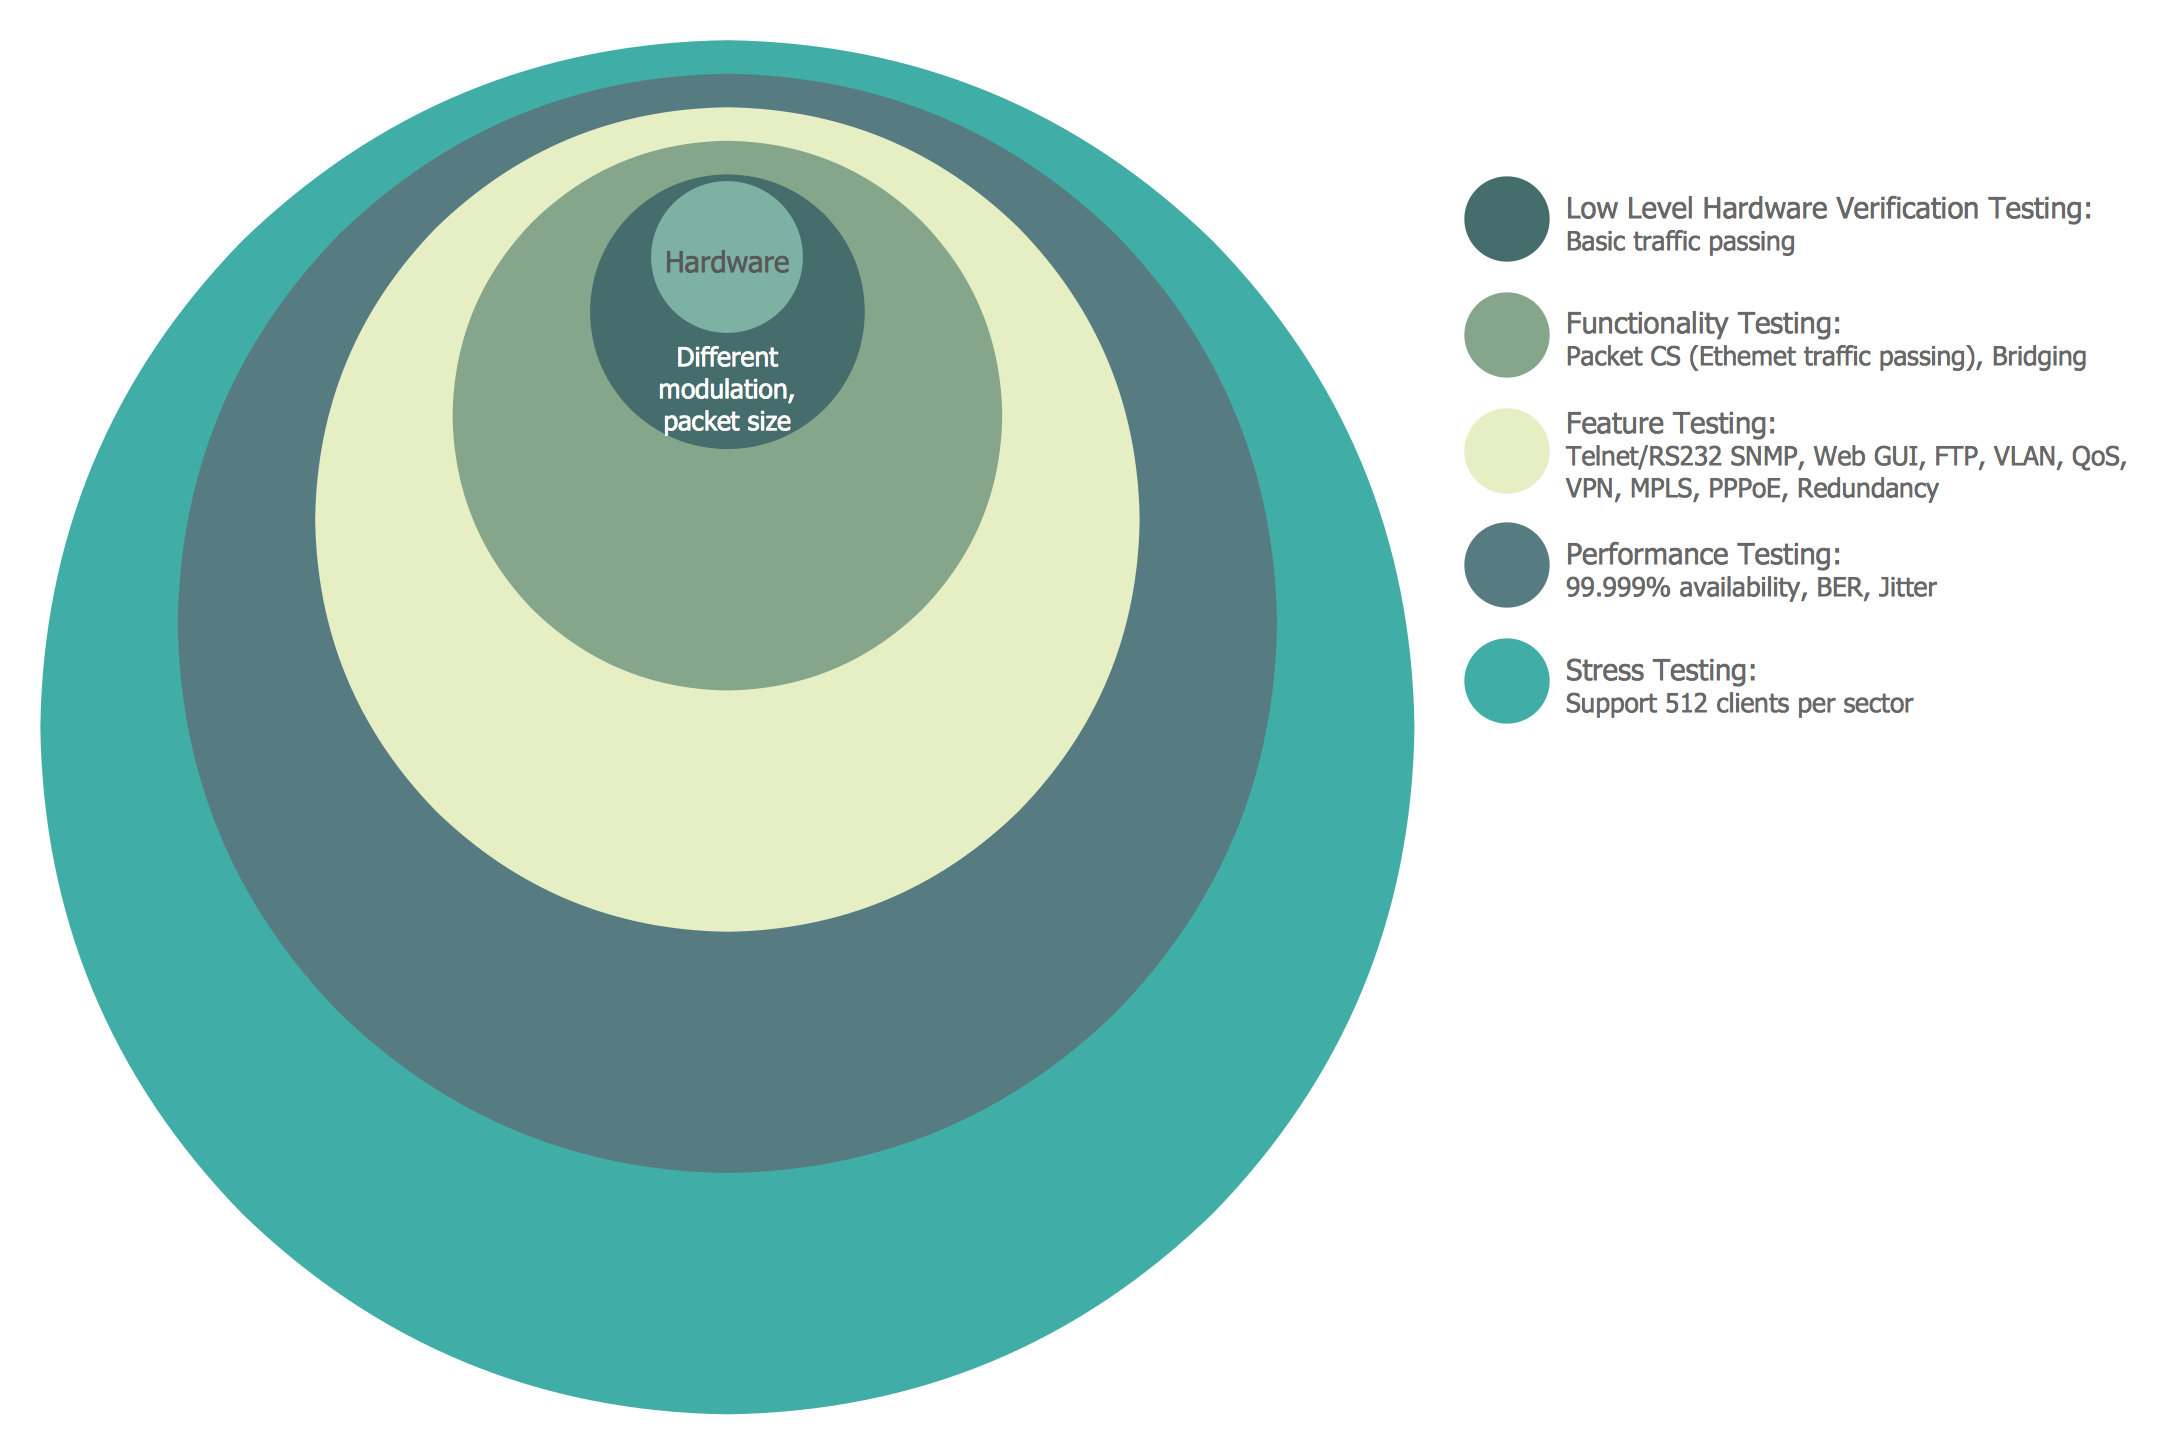
This sample is an Onion Diagram dedicated to the development of the Worldwide Interoperability for Microwave Access (WiMAX). WiMAX is a set of wireless broadband communication standards based on the WirelessMAN-Advanced or IEEE 802.16 standards intended in 2001. Since then, a large number of versions have been released and deployed in many countries. Currently, we have the IEEE 802.16-2017 standard for air interface for broadband wireless access systems. WiMAX provides a physical layer and media access control options. Being similar to Long-range Wi-Fi, WiMAX operates at much greater distances than the first one. This standard supplies up to 1 Gbit/s data rates for fixed stations. WiMAX is used for a number of applications, including home Internet access and portable mobile broadband connections in cities and countries, cellular backhaul networks, VoIP and IPTV services, and hotspots. Also, it is used for smart grids and metering, and as a wireless alternative to cable and digital subscriber lines.
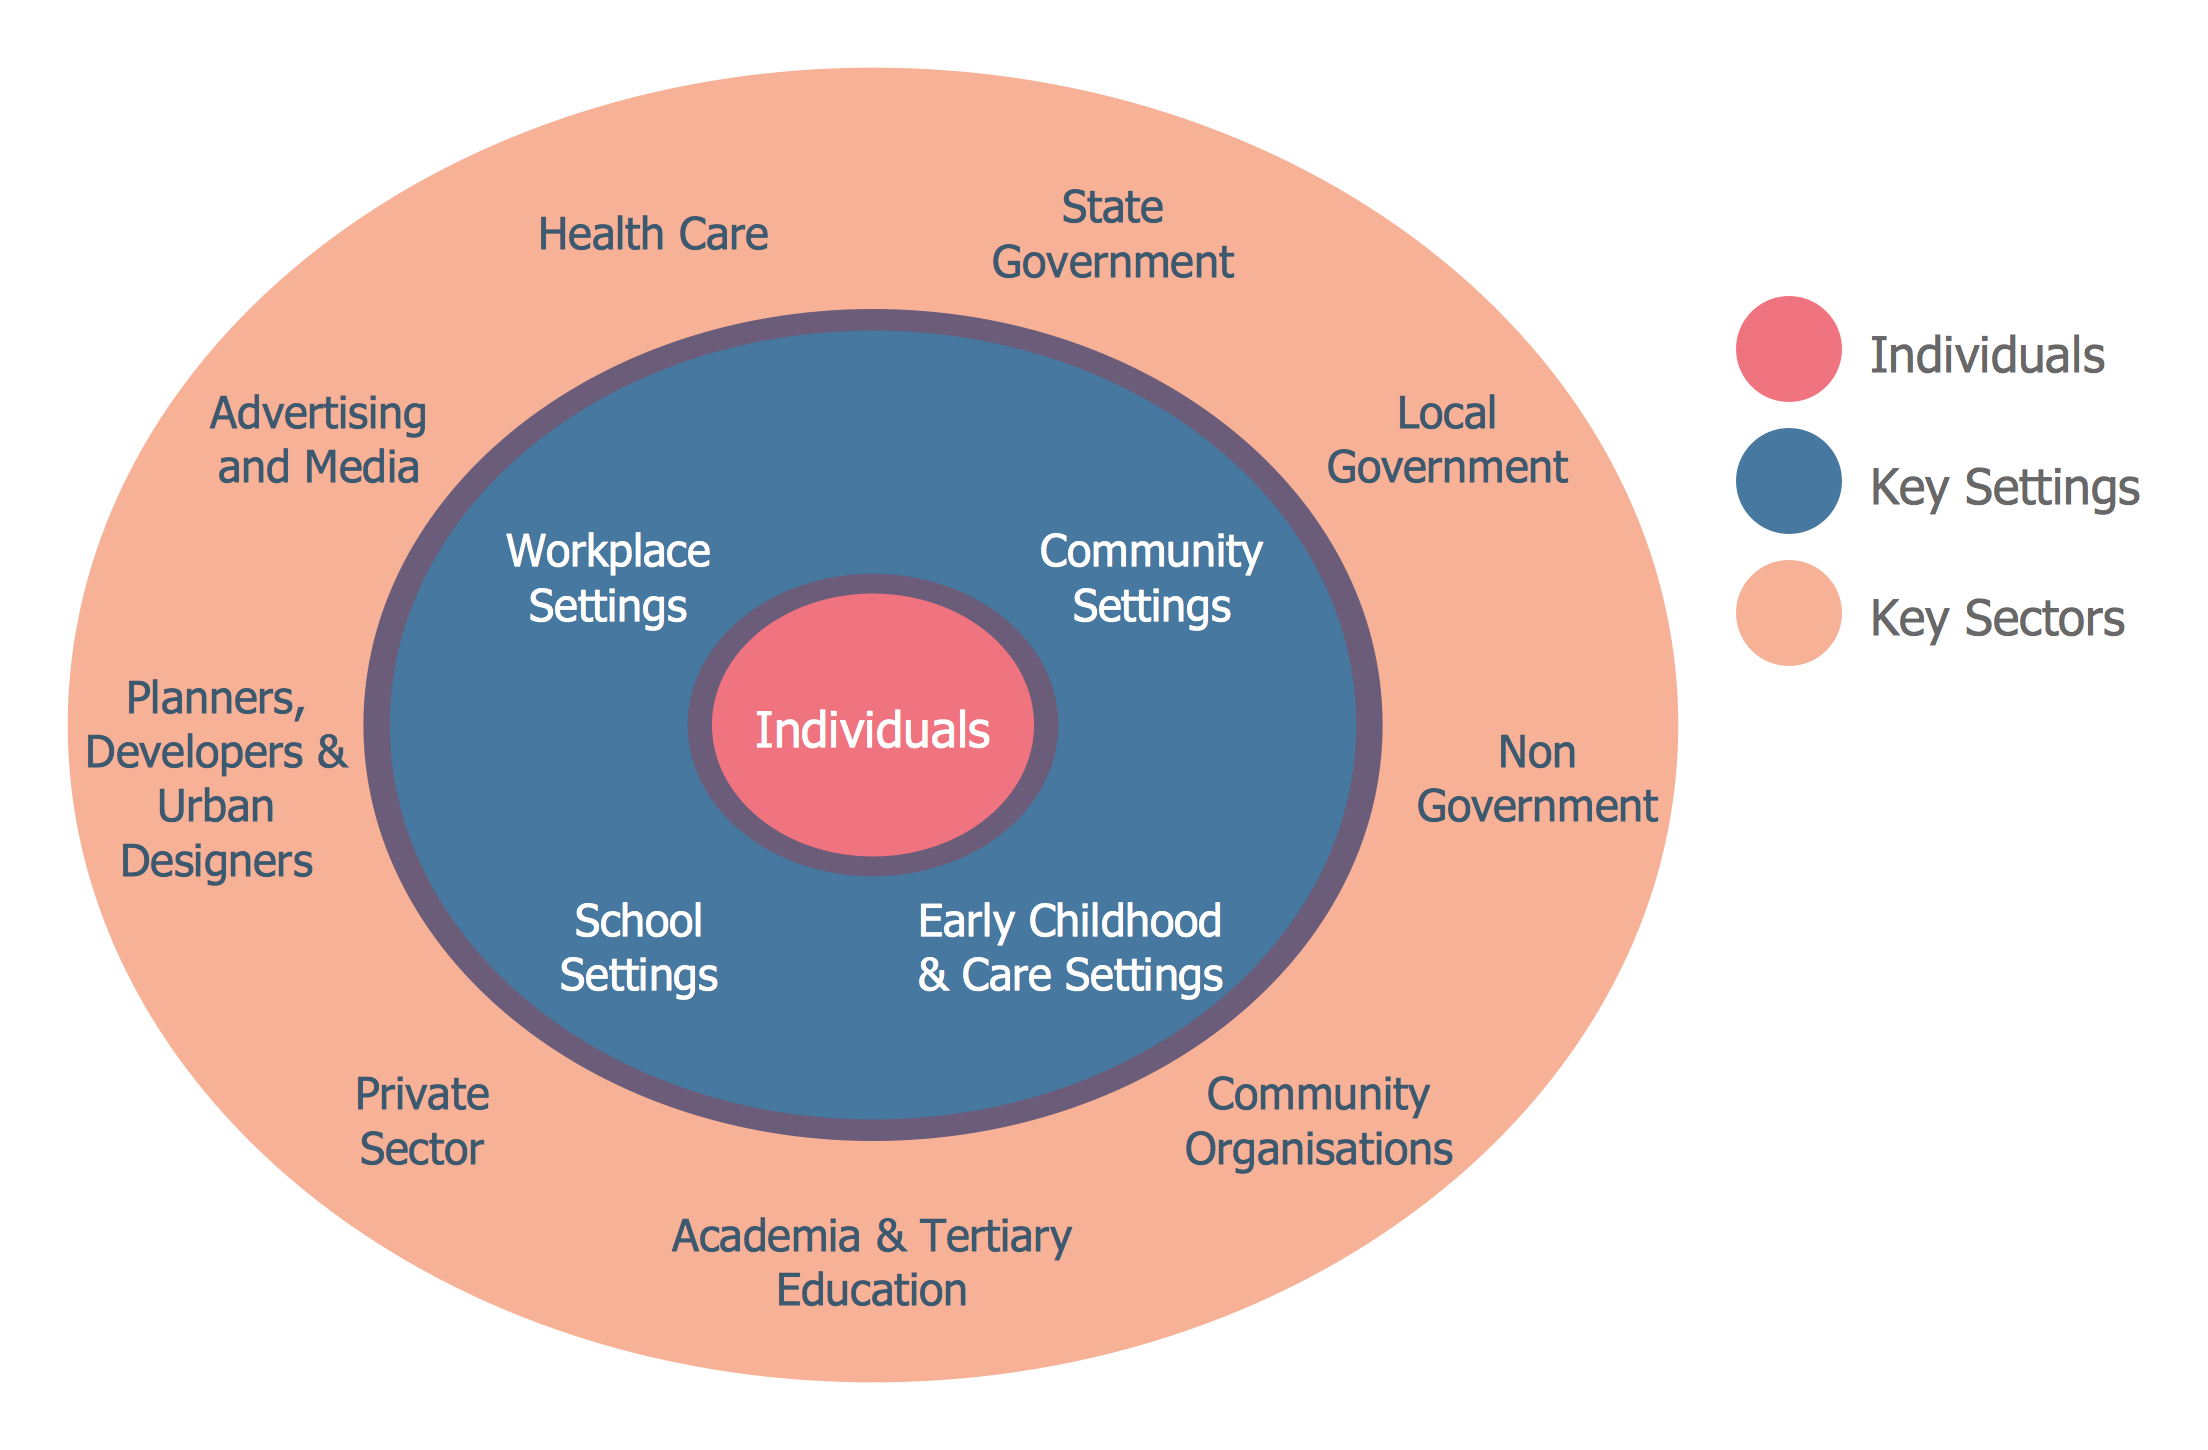
Example 7: Stakeholder Onion Diagrams Active Living for All
This diagram was created in ConceptDraw DIAGRAM using the Onion Diagrams with Sectors library from the Stakeholder Onion Diagrams Solution. An experienced user spent 10 minutes creating this sample.
This Onion diagram example was created based on the diagram from the article "Active Living for All" published on the website "Be Active WA". It is dedicated to active living for all individuals in Western Australia. This diagram reflects the collective approach in implementing active living. First of all, active living is justified by health reasons and obligatory integrates physical activity into daily routines. However, social and economic reasons are also significant. This diagram displays all kinds of key settings: early childhood, school, community, workplace, and care. It also depicts the numerous key sectors including health care, advertising and media, state government, local government, and non-government, private sector, academia and tertiary education, community organizations, planners, developers, and urban designers. If you want, you can supplement this onion table with ideas for actions, key roles and responsibilities in minutes and without special drawing skills. The legend gives your diagram the additional clarity.
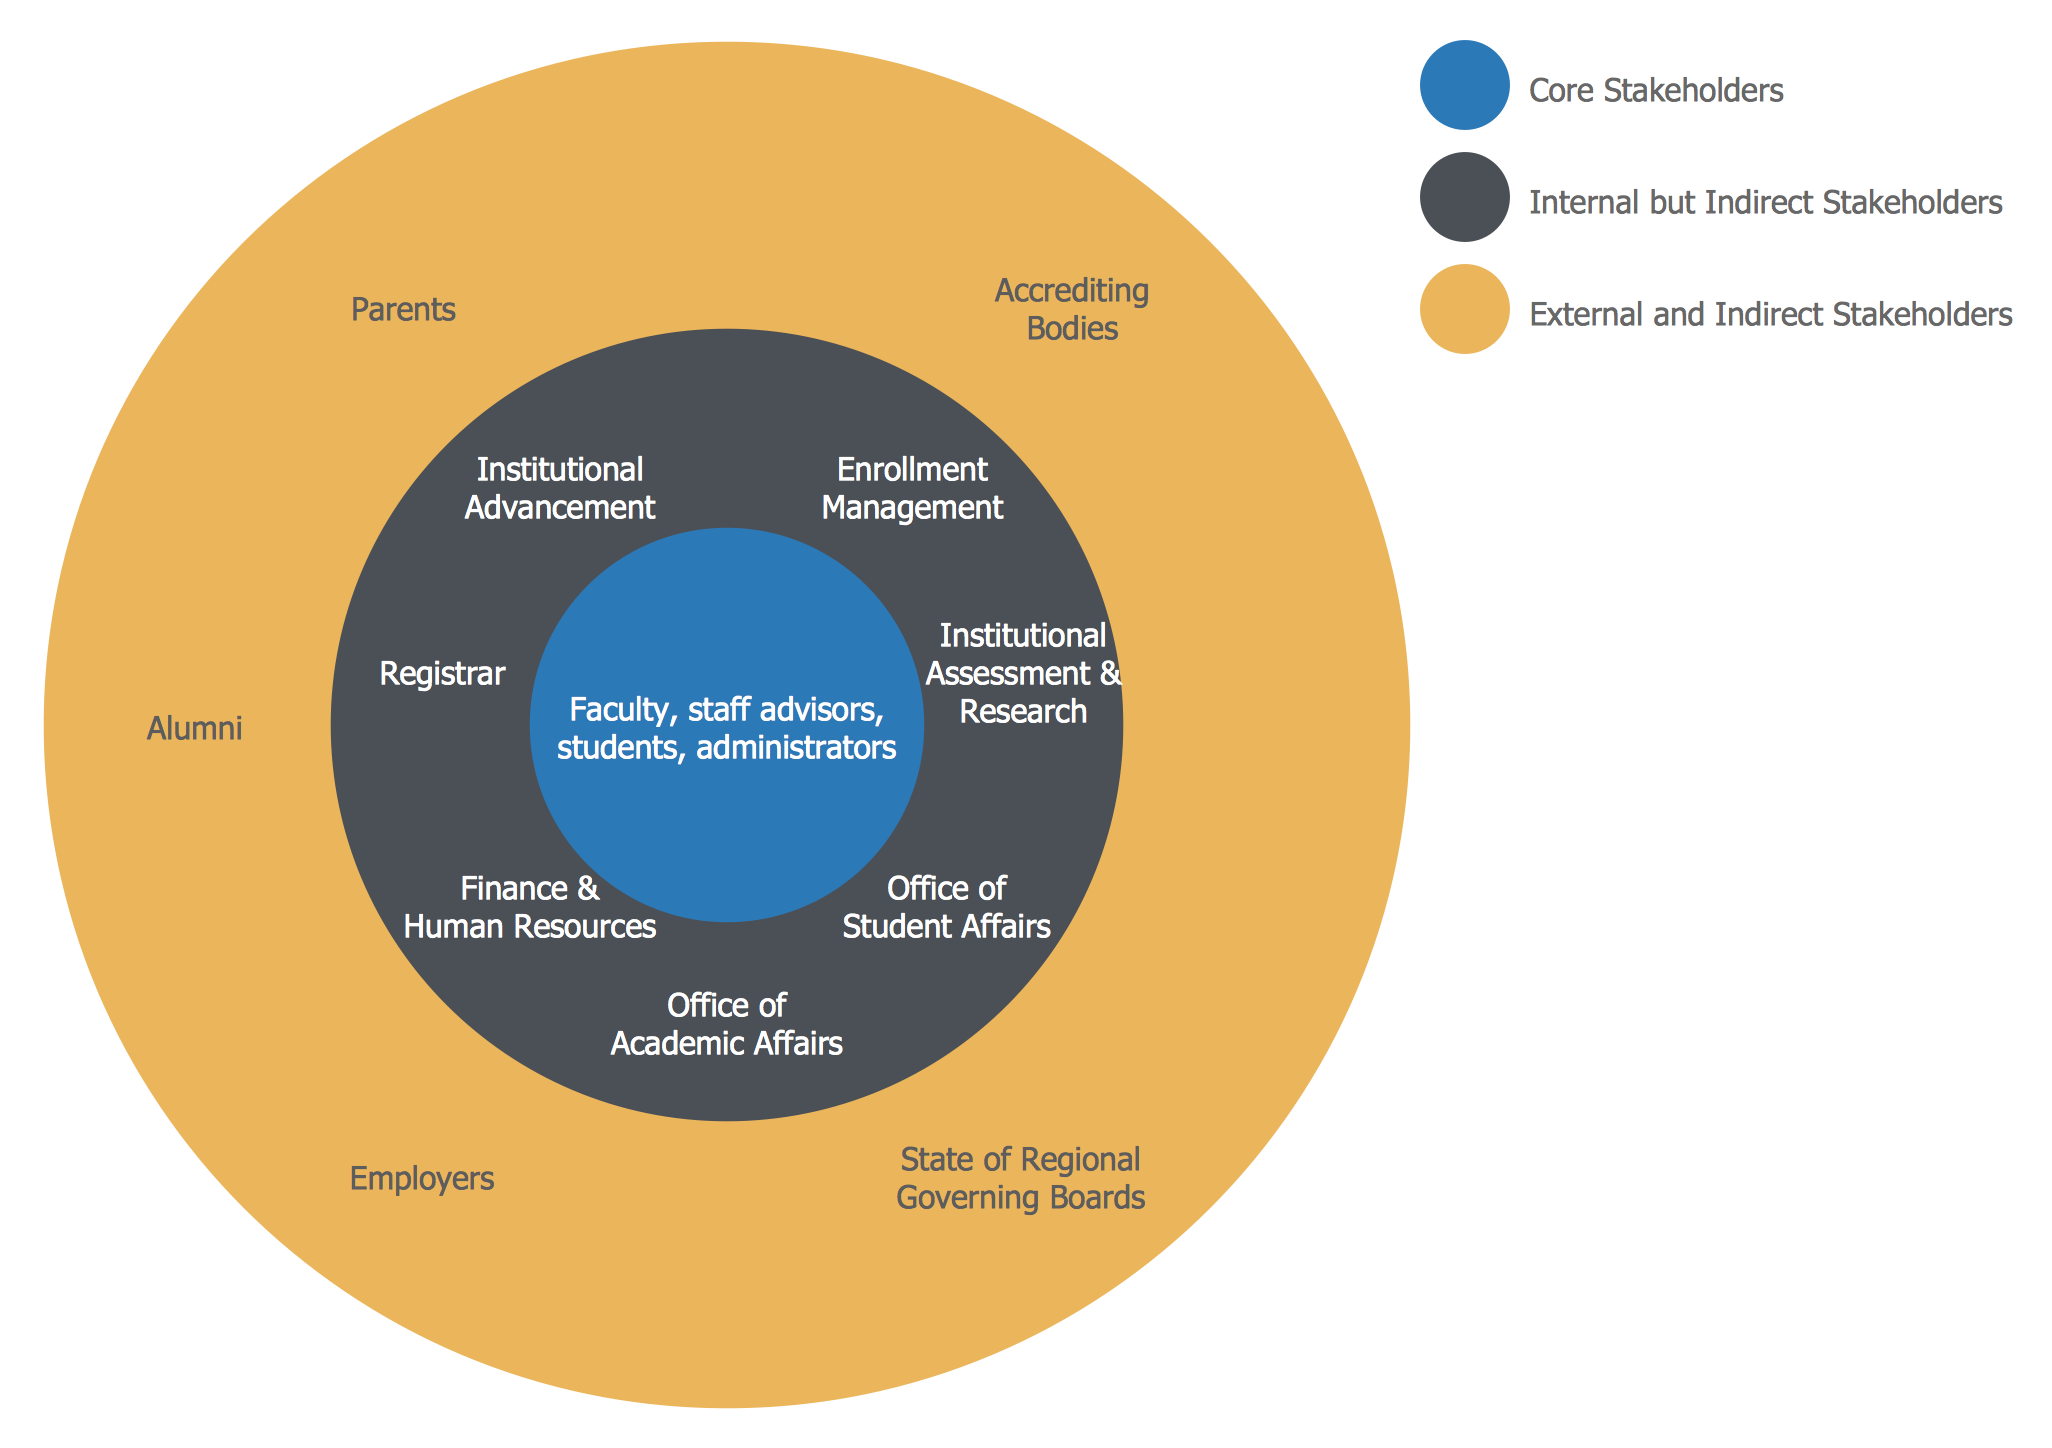
Example 8: Stakeholder Diagram
This diagram was created in ConceptDraw DIAGRAM using the Onion Diagrams with Sectors library from the Stakeholder Onion Diagrams Solution. An experienced user spent 10 minutes creating this sample.
This Stakeholder Onion Diagram example classifies the stakeholders of academic advising. It was designed based on the diagram "Academic advising stakeholder framework" published in the article "Defining Advising Stakeholder Groups" by Julianne Messia on the website of NACADA Executive Office, Kansas State University. Academic advising is a program in which faculty, counselors, students, and administrators are key stakeholders. It has an impact and also is impacted by both internal and external constituents of the college community. The group of internal but indirect stakeholders includes institutional advancement, enrollment management, institutional assessment and research, office of student affairs, office of academic affairs, finance and human resources, and the registrar. The parents, alumni accrediting bodies, state of regional governing boards, and employers are included in the group of external and indirect stakeholders. All these stakeholders are involved at the different stages of the academic advising program.
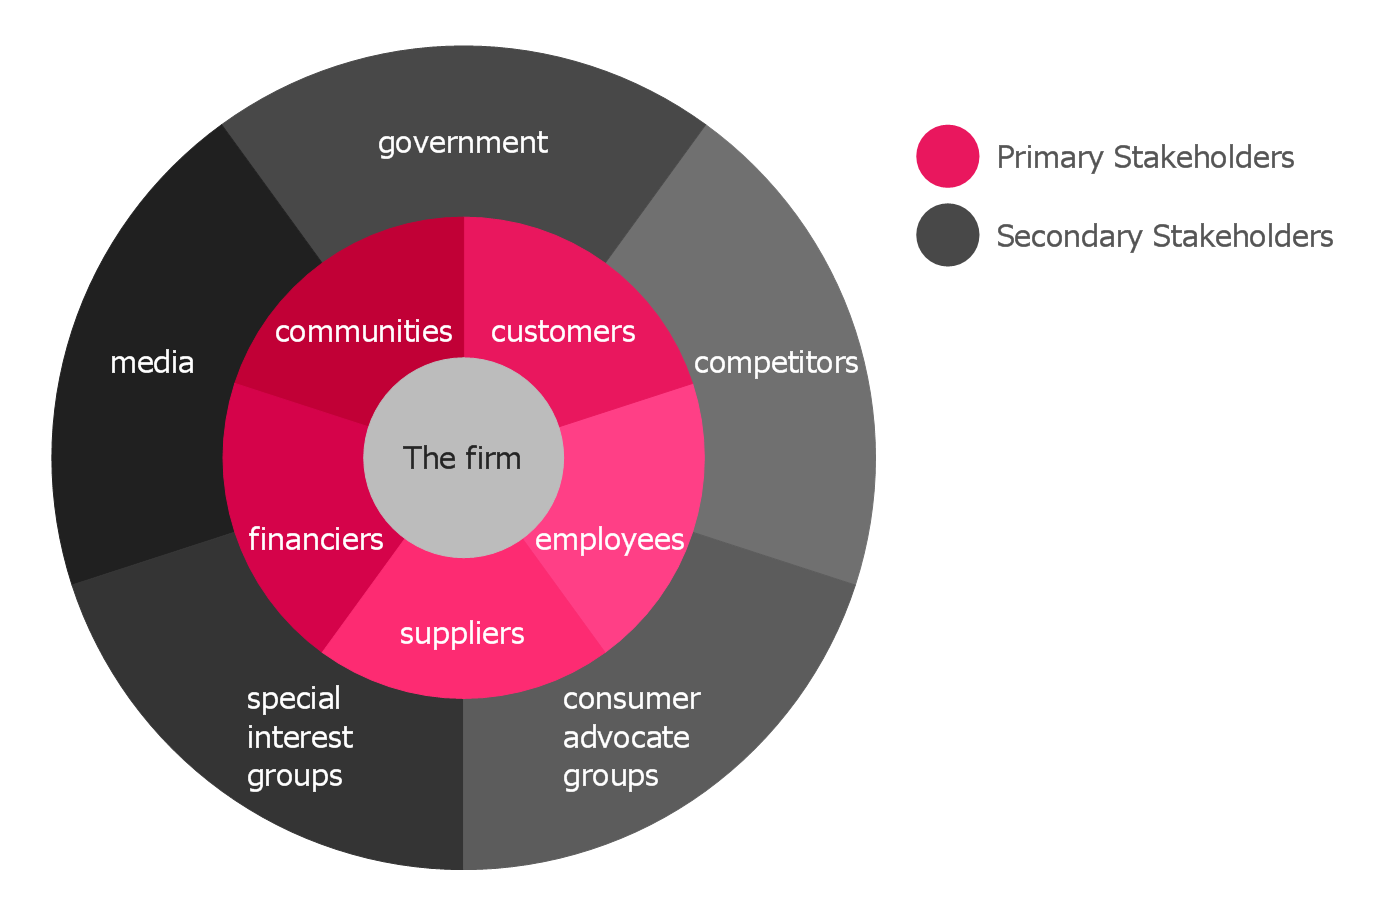
Example 9: Firm Centric Stakeholder Diagram
This diagram was created in ConceptDraw DIAGRAM using the Onion Diagrams with Sectors library from the Stakeholder Onion Diagrams Solution. An experienced user spent 10 minutes creating this sample.
This sample shows a stakeholder diagram for a specific firm. It is designed around the financial goals of a particular firm, but broader than its financial goals. The firm's primary stakeholders are financiers, suppliers, customers, communities and employees. The secondary stakeholders include media, government, competitors, consumer advocate groups, and special interest groups. Major stakeholders are highlighted in shades of red, minor stakeholders are highlighted in shades of black. You can use this sample as a template for more diagrams. For example, you can create a diagram oriented on the finance of a firm or separate diagrams for each of the stakeholders to show their priorities. Typically the priorities and values differ for the stakeholders. The comparison of the firm-oriented and finance-oriented diagrams helps to define the difference between the overall goals of the firm and its finance. The analysis of the diagrams will help you create creative investing scenarios.
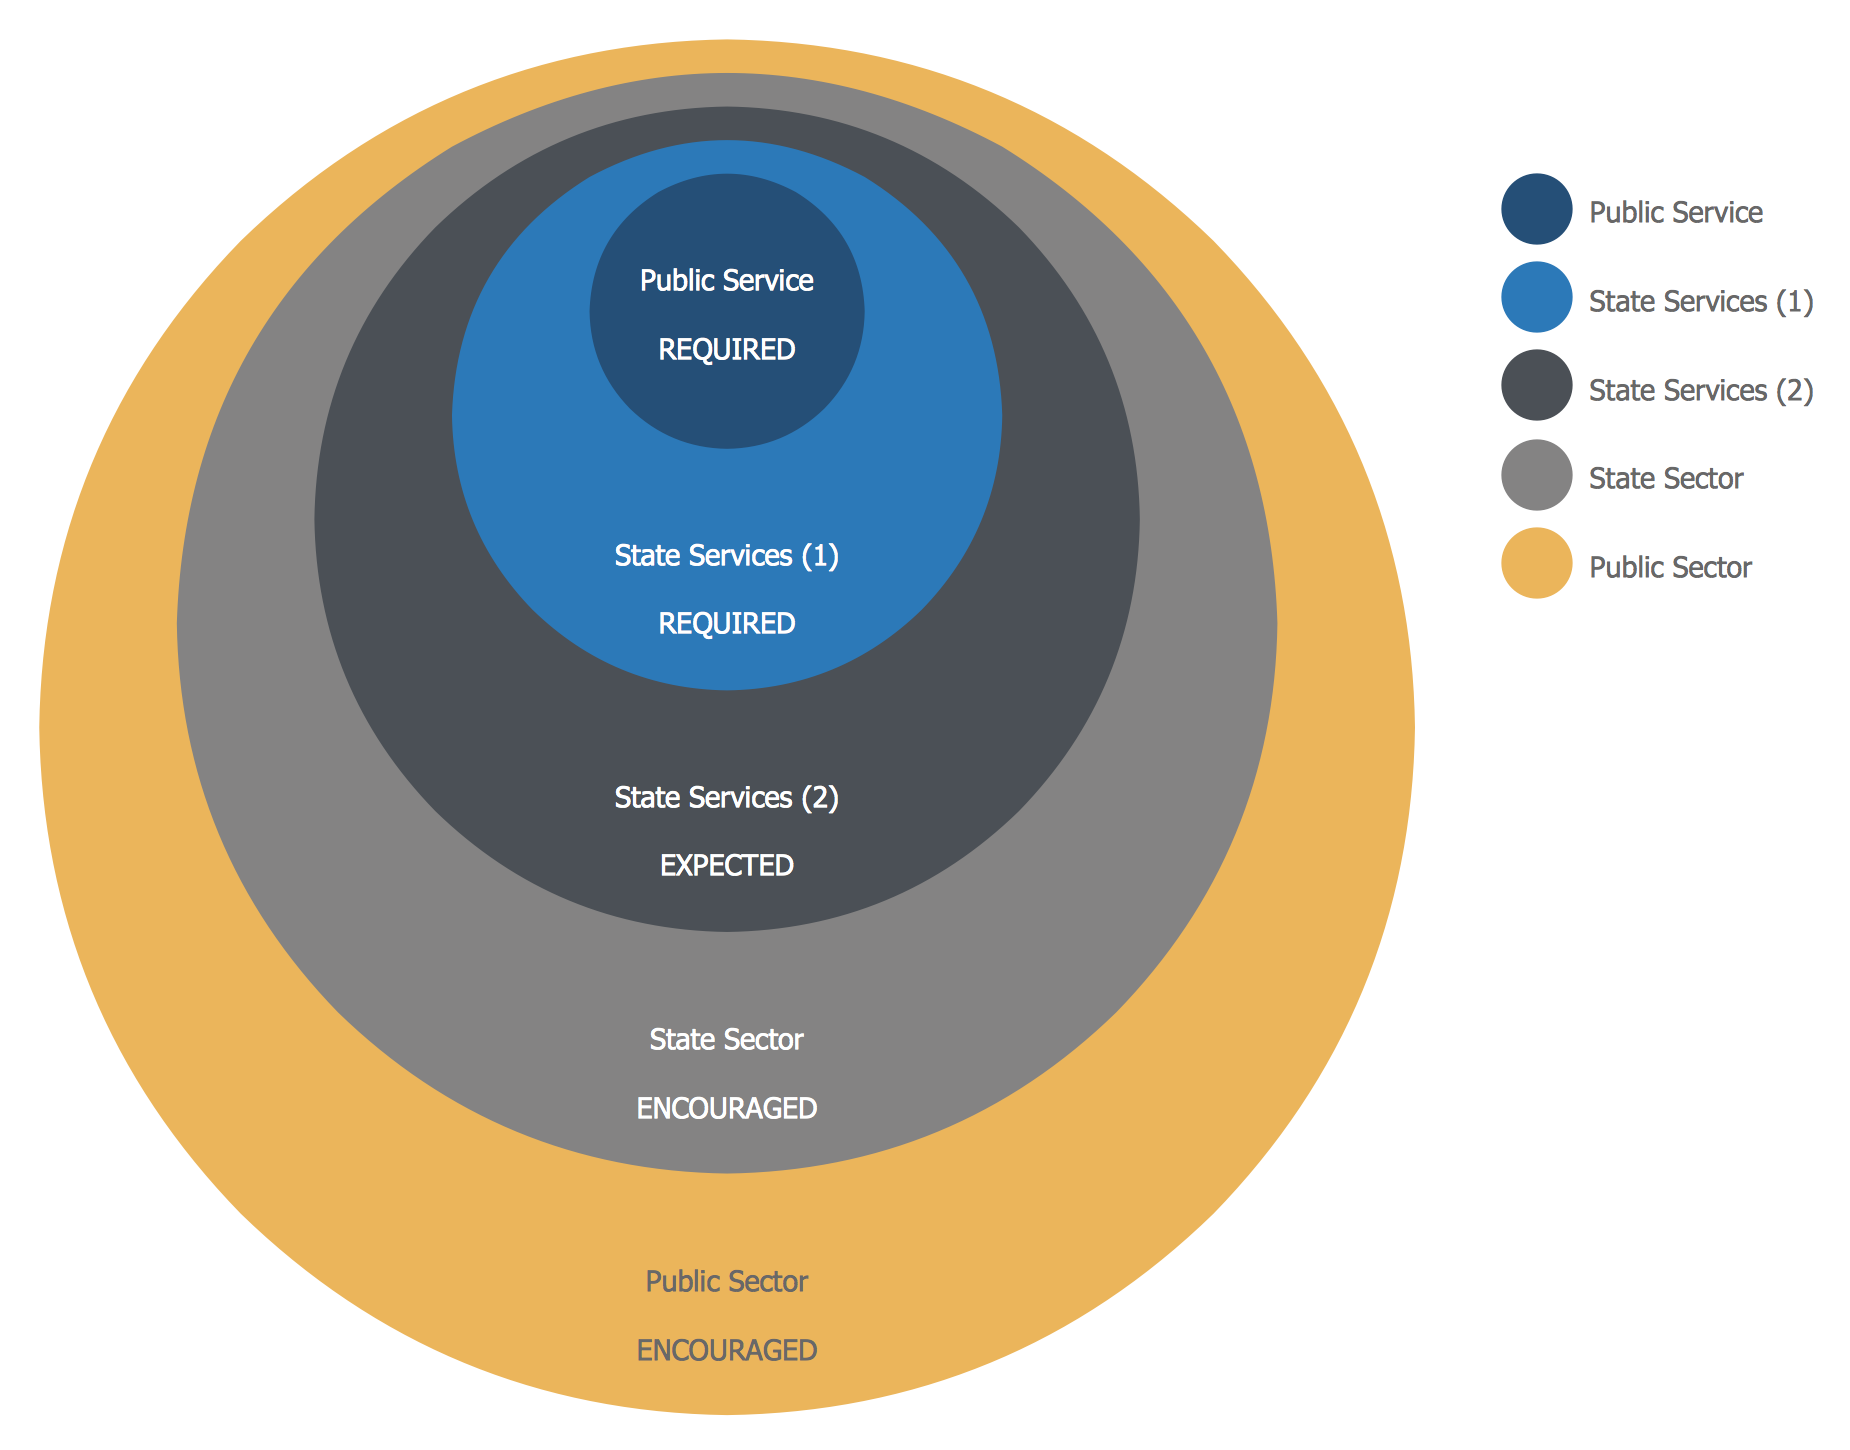
Example 10: New Zealand Public Sector Agencies Onion Diagram
This diagram was created in ConceptDraw DIAGRAM using the Onion Diagrams with Sectors library from the Stakeholder Onion Diagrams Solution. An experienced user spent 10 minutes creating this sample.
This Onion Diagram shows the public sector agencies in New Zealand. This country is a constitutional monarchy with a parliamentary democracy. However, the constitutional constraints limit the powers of the monarch and the governor-general and their activity is coordinated with the advice of ministers. The Crown includes the legislative branch non-public service departments, executive branch non-public service departments, and the public service departments. The public sector of New Zealand contains a lot of different organizational forms. These forms vary in parameters including how they are governed and how closely they are to ministers. The public sector in New Zealand includes the state sector and organizations of local government. The state sector provides the state services presented by two sectors in this diagram. The public service lies within the state services. Each sector has a mark like required, encouraged, or expected, and its own color in a diagram for additional visibility.
Inside
What I Need to Get Started
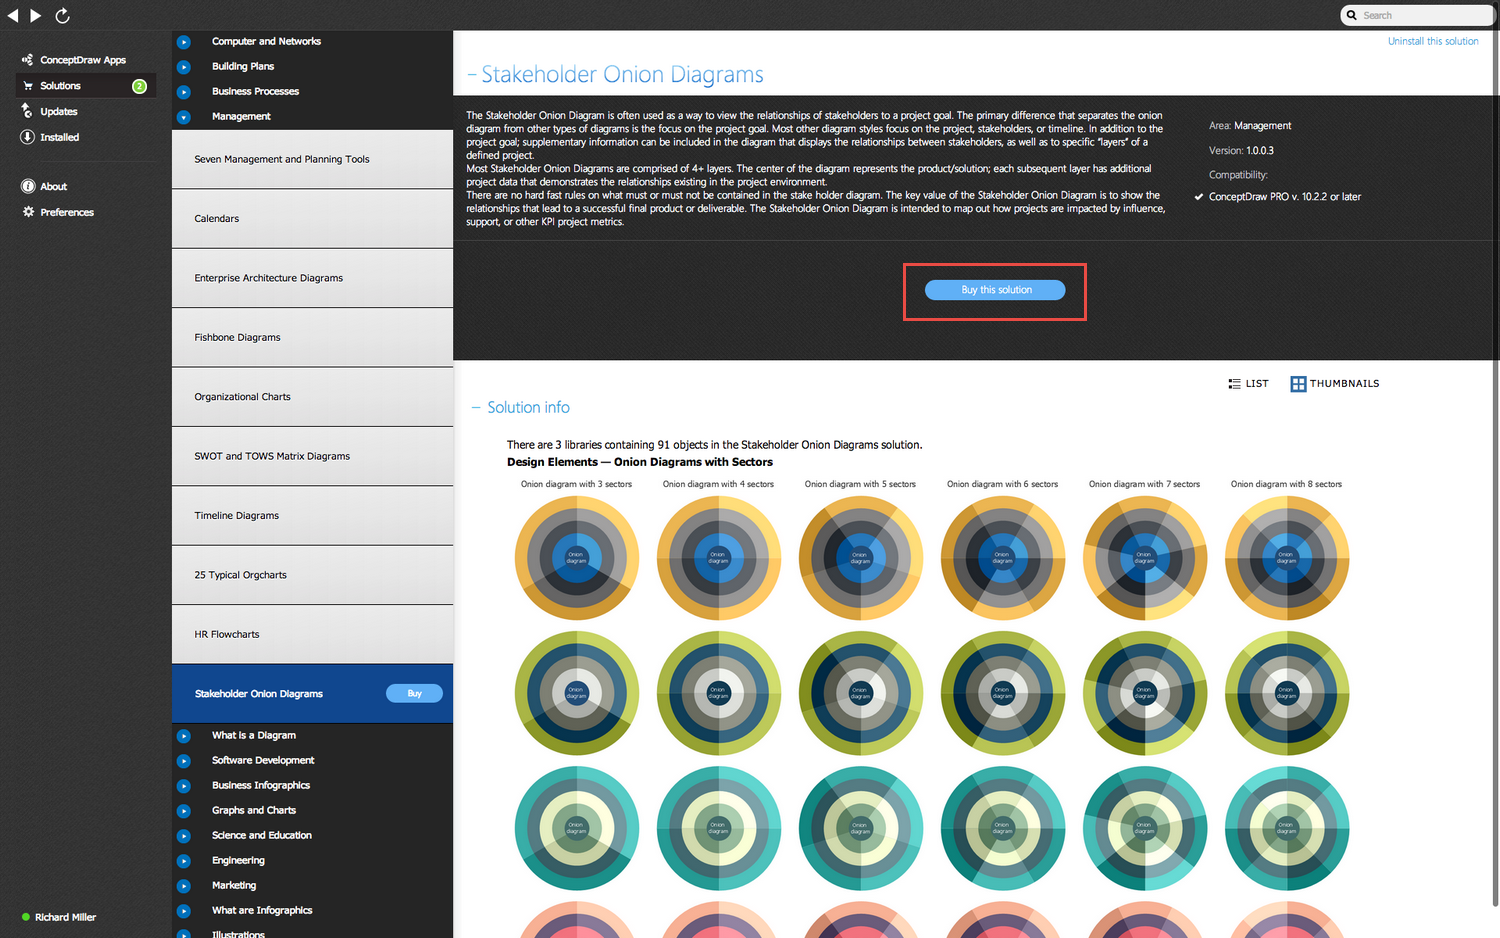
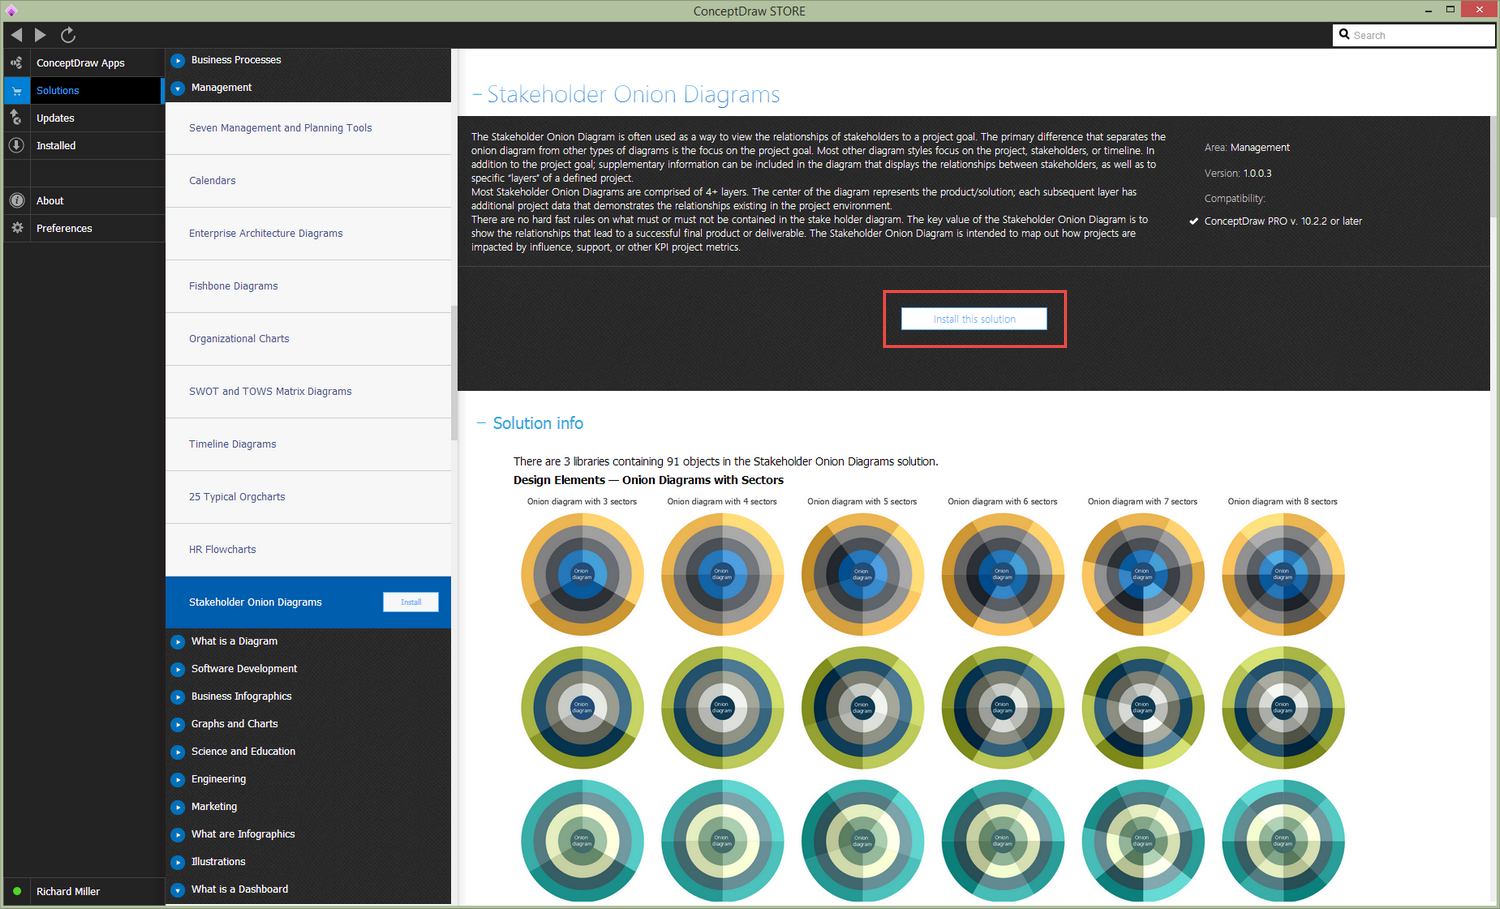
After ConceptDraw DIAGRAM is installed, the Stakeholder Onion Diagrams solution can be purchased either from the Management area of ConceptDraw STORE itself or from our online store. Thus, you will be able to use the Stakeholder Onion Diagrams solution straight after.
How to install
First of all, make sure that both ConceptDraw STORE and ConceptDraw DIAGRAM applications are downloaded and installed on your computer. Next, install the Stakeholder Onion Diagrams solution from the ConceptDraw STORE to use it in the ConceptDraw DIAGRAM application.
Start using
Start using the Stakeholder Onion Diagrams solution to make the professionally looking business planning diagrams by adding the design elements taken from the stencil libraries and editing the pre-made examples that can be found there.
