Physics Diagrams
ConceptDraw PRO diagramming and vector drawing software extended with Physics solution from the Science and Education area is the best for creating: physics diagrams, pictures which describe various physical facts and experiments, illustrations of various electrical, mechanical and optic processes, of any complexity quick and easy.
 Science and Education Area
The solutions from Science and Education Area of ConceptDraw Solution Park collect templates, samples and libraries of vector stencils for drawing the scientific and educational illustrations, diagrams and mind maps.
HelpDesk
How to Purchase ConceptDraw Products for Academic/Nonprofit Institutions
CS Odessa offers special academic and non-profit pricing.
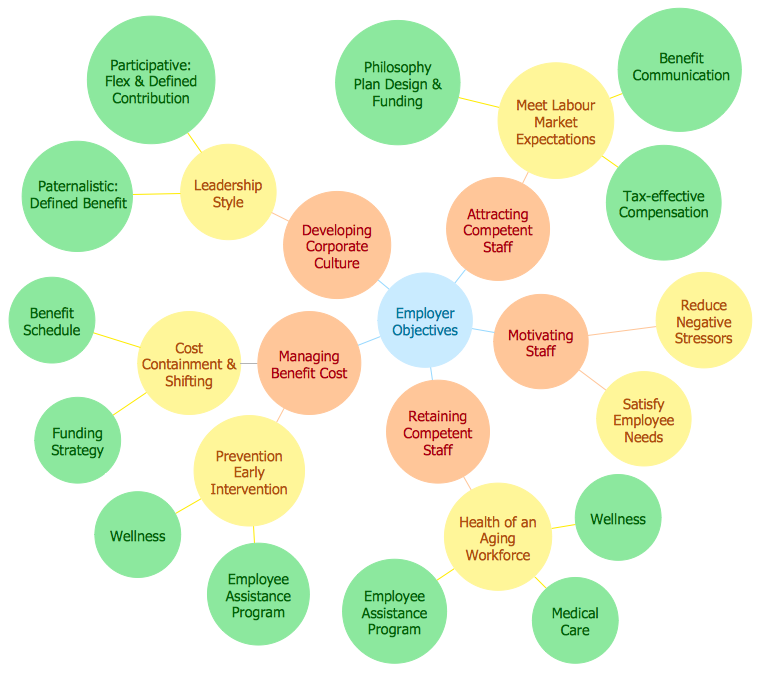
 Circle-Spoke Diagrams
Examples of subject areas that are well suited to this approach are marketing, business, products promotion, process modeling, market, resource, time, and cost analysis. Circle-Spoke Diagrams are successfully used in presentations, conferences, management documents, magazines, reportages, reviews, reports, TV, and social media.
 Basic Circle-Spoke Diagrams
Basic circle-spoke diagrams are well suited for marketing, management documents, and presentations.
HelpDesk
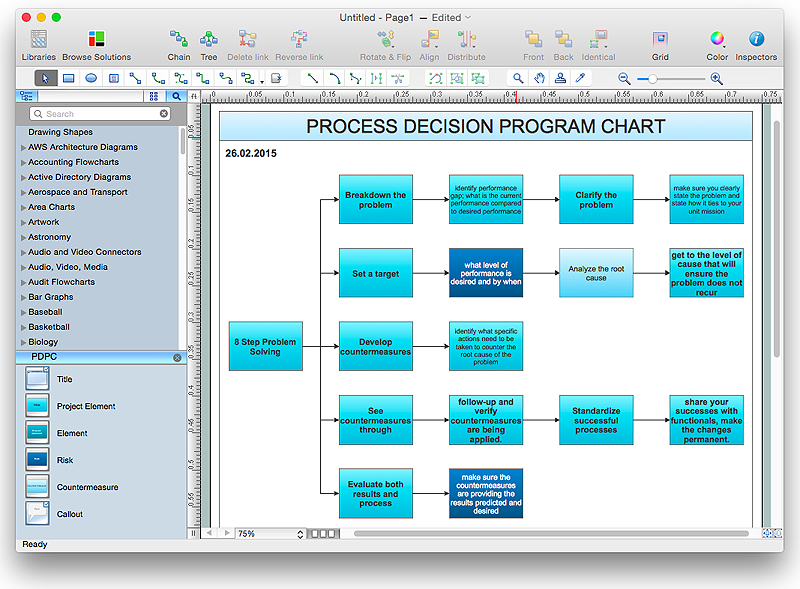
How To Create Risk Diagram (PDPC)
Article on how to identify possible risks when carrying out corrective actions, and define preventive actions
Visual Presentations Made Easy with Diagramming Software
Automatically create a presentation-quality diagram in one click with ConceptDraw PRO.
 Presentation Exchange
This solution extends ConceptDraw MINDMAP software with the ability to import presentations from Microsoft PowerPoint, as well as enhancing its existing presentation capabilities.
HelpDesk
How to Create a Bubble Diagram Using ConceptDraw PRO
Bubble Diagram is a simple chart that consists of circles (bubbles) repesening certain topics or processes. Bubbles are connected by lines depicting the type of relationships between the bubbles. The size of each bubble is depended on the importance of the entity it represents. Bubble charts are widely used throughout social, economical, medical, and other scientific researches as well as throughout architecture and business management. Bubble charts are often used during the early stages of product development to visualize thoughts and ideas for the purpose of sketching out a development plan. ConceptDraw PRO allows you to draw a bubble diagrams using the Bubble Diagrams solution.- Business Diagram Software | PM Response | Science and ...
- Educational Diagrams
- Education | How to Connect an Image to a Topic in Your Mind Map ...
- Educational Chart In The Topic Drawing
- Science and Education Area | Biochemistry Topics For Mind Map
- Physics Diagrams | Sketching Software | Scientific Symbols Chart ...
- Types Of Education Flowchart
- Basic Flowchart Symbols and Meaning | | Education | Prepare A ...
- Topic Of Mathematics Diagram
- Physics Diagrams | Types of Flowcharts | How to Create ...
- Chemistry Topics Diagrams
- Math Topics Flow Chart Examples
- Population Education Diagram
- Dna model of seduction - Triangular diagram | Education pictograms ...
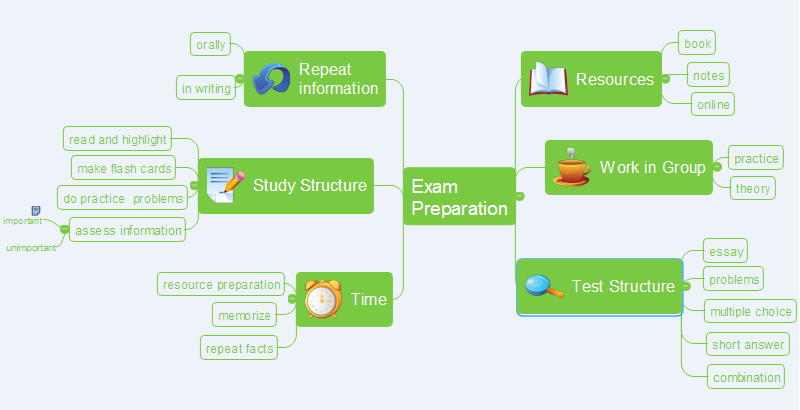
- Education | Exam Preparation Mind Map | Physics Diagrams | Mind ...
- Cross-Functional Flowchart (Swim Lanes) | Swim Lane Diagrams ...
- Biology Illustration | Educational Technology Tools | Education ...
- Astronomy | UK Map | Education | Example Pictures Of Natural ...
- Education | Education Information | How to Support Your Mind Map ...
- Best Diagram Mathematical Topic Of Square


