HelpDesk
How to Create an IDEF0 Diagram for an Application Development
IDEF0 methods are intended to model the functions of a process, creating a graphical model that displays: what controls the function, who makes it, what resources are used and how they are connected with other functions. The IDEF0 tool is used to model the decisions, actions, and activities of a software system during the development process. IDEF0 diagram graphically depicts a model of a desired version of the application. ConceptDraw DIAGRAM allows you to create and communicate the IDEF0 diagrams of any complexity.Software development with ConceptDraw DIAGRAM
Modern software development requires creation of large amount of graphic documentation, these are the diagrams describing the work of applications in various notations and cuts, also GUI design and documentation on project management. ConceptDraw DIAGRAM technical and business graphics application possesses powerful tools for software development and designing technical documentation for object-oriented projects. Solutions included to the Software Development area of ConceptDraw Solution Park provide the specialists with possibility easily and quickly create graphic documentation. They deliver effective help in drawing thanks to the included package of templates, samples, examples, and libraries with numerous ready-to-use vector objects that allow easily design class hierarchies, object hierarchies, visual object-oriented designs, flowcharts, GUI designs, database designs, visualize the data with use of the most popular notations, including the UML and Booch notations, easy manage the development projects, automate projection and development.Entity Relationship Diagram Software Engineering
Entity Relationship Diagram (aka ER Diagram, E-R Diagram, ERD) is a time-tested and widespread software development and software engineering method for data modeling, illustrating the logical structure of databases and system design. For ERDs construction are used three basic elements: entities, attributes, and relationships. Chen's notation for ERD supposes the use of rectangles (boxes) to represent entities and diamonds to depict relationships between first-class objects. This notation is popular when creating conceptual data models of information systems. Another standardized notation for ER diagrams is Crow's foot notation. ConceptDraw DIAGRAM as a powerful Entity Relationship Diagram software engineering provides the tools of Entity-Relationship Diagram (ERD) solution from Software Development area of ConceptDraw Solution Park for instantly describing databases using ERDs of Crow’s Foot and Chen’s notations. Use the predesigned vector elements for both these notations from 2 libraries included to Entity-Relationship Diagram (ERD) solution.
 IDEF0 Diagrams
IDEF0 Diagrams visualize system models using the Integration Definition for Function Modeling (IDEF) methodology. Use them for analysis, development and integration of information and software systems, and business process modelling.
JSD - Jackson system development
Jackson System Development (JSD) is a linear method of system development created by Michael A. Jackson and John Cameron in the 1980s. It comprises the whole software life cycle directly or providing a framework for more specialized techniques. When implementing the Jackson System Development method and designing JSD diagrams, you can succesfully use the powerful and helpful tools of ConceptDraw DIAGRAM software extended with Entity-Relationship Diagram (ERD) solution from the Software Development area of ConceptDraw Solution Park.Object-Oriented Development (OOD) Method
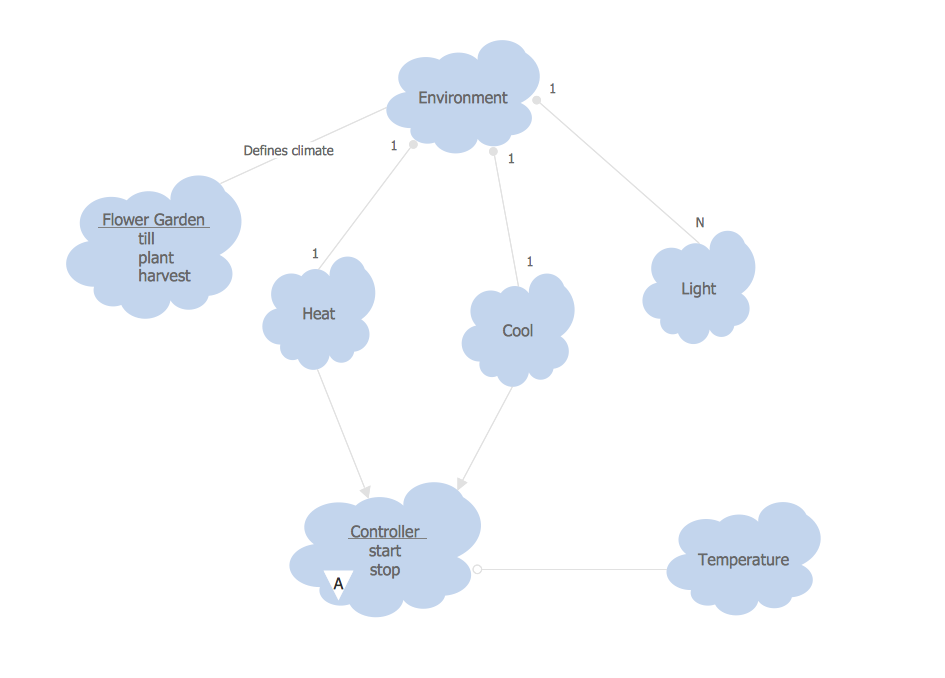
This sample shows the Booch OOD diagram of the environment. The Booch method (developed by Grady Booch) is an object modeling language and methodology used in software engineering. This sample was created in ConceptDraw DIAGRAM diagramming and vector drawing software using the Rapid UML Solution from the Software Development area of ConceptDraw Solution Park.Agile Methodology
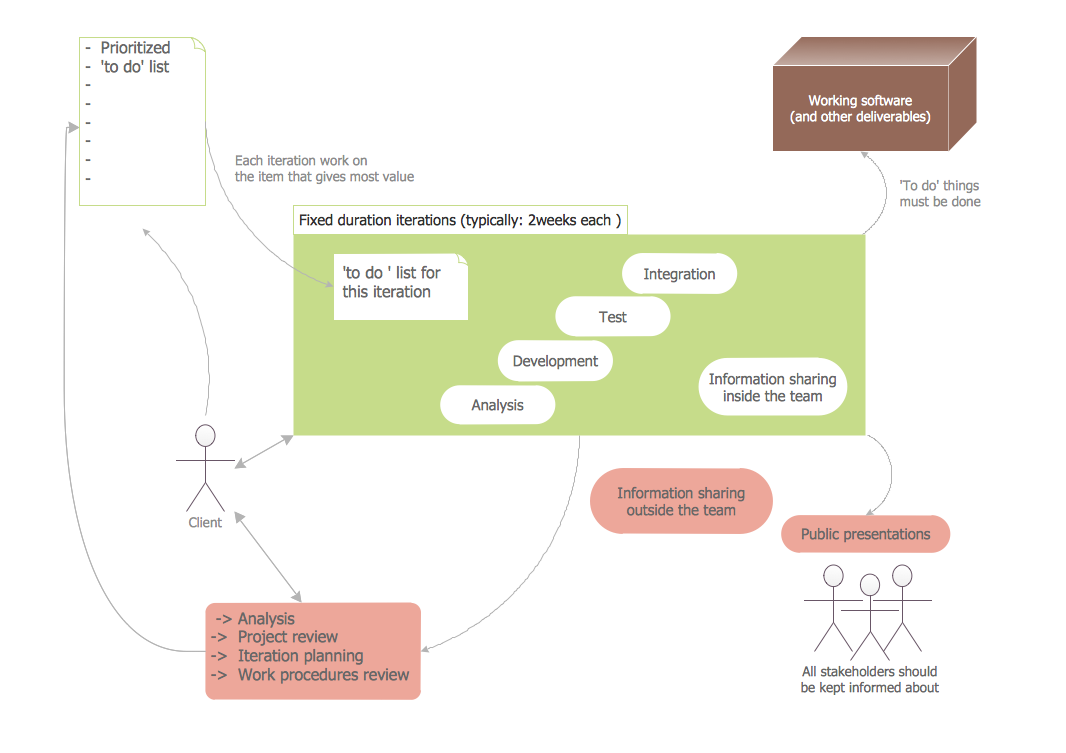
Agile methodology is an excellent alternative to waterfall and traditional sequential development. ConceptDraw DIAGRAM software extended with SCRUM Workflow solution is ideal for quick and easy designing various diagrams, charts, mind maps and schematics illustrating software development using Agile methodologies, and in particular Scrum methodology."The IDEF0 Functional Modeling method is designed to model the decisions, actions, and activities of an organization or system. ...
IDEF0 includes both a definition of a graphical modeling language (syntax and semantics) and a description of a comprehensive methodology for developing models. ...
IDEF0 is used to show data flow, system control, and the functional flow of lifecycle processes. IDEF0 is capable of graphically representing a wide variety of business, manufacturing and other types of enterprise operations to any level of detail. It provides rigorous and precise description, and promotes consistency of usage and interpretation." [IDEF0. Wikipedia]
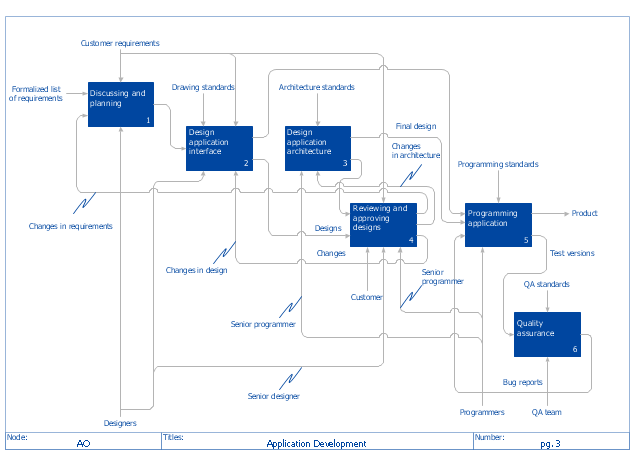
The IDEF0 diagram example "Application development" was created using the ConceptDraw PRO diagramming and vector drawing software extended with the IDEF0 Diagrams solution from the Software Development area of ConceptDraw Solution Park.
SSADM Diagram
The vector stencils library SSADM from the solution Systems engineering contains specific symbols of SSADM diagrams for ConceptDraw DIAGRAM diagramming and vector drawing software. The Systems engineering solution is contained in Software Development area of ConceptDraw Solution Park. The example below illustrates the waterfall model used in SSADM. This model involves 5 stages of developing a product such as requirements specification and its' analysis, design, coding and testing.Human Resource Development
Human Resource Development (HRD) focuses on the help employees develop their personal and organizational skills, abilities, and knowledge, HRD also helps to adapt an organization to the changing of external environment. ConceptDraw DIAGRAM diagramming and vector drawing software supplied with HR Flowcharts Solution from the Management Area of ConceptDraw Solution Park can effectively help in labour-intensive process of human resource development.Data Flow Diagram Example
ConceptDraw DIAGRAM extended with Data Flow Diagrams solution is the best diagramming and vector drawing software for quick and easy designing the Data Flow Diagram Example of any complexity.UML Class Diagrams. Diagramming Software for Design UML Diagrams
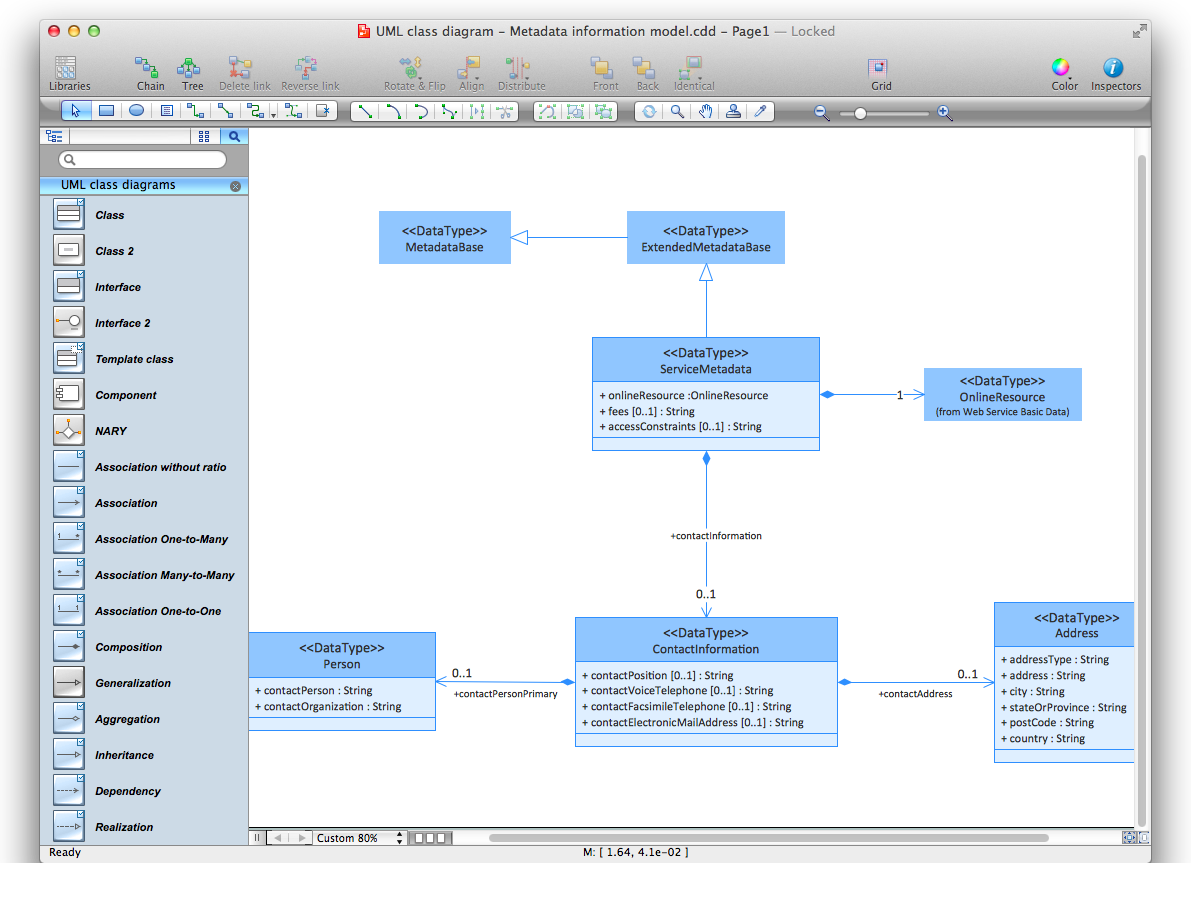
In software engineering, a UML Class Diagrams is a type of static structure diagram that is used both for general conceptual modeling of the systematics of the application, and for detailed modeling translating the models into programming code. Use ConceptDraw DIAGRAM with UML class diagram templates, samples and stencil library from Rapid UML solution to show the classes of system, their attributes, operations or methods, and the relationships among the classes.
Developing Entity Relationship Diagrams
When you need to visually represent the structure of relational database, Entity relationship diagram (ERD) is a type of diagram for that case. Most entity-relationship diagrams can be built with objects from Flowchart solution or ERD Solution which contains inbuilt templates. Follow these steps to create your own custom ERD diagram. Don't be frightened if it looks complex, ConceptDraw DIAGRAM makes it easy to create an ERD, and hundreds of other diagrams, in minutes.Software Diagram Templates
Use Software Diagram Templates from the solutions of Software Development area for ConceptDraw DIAGRAM to create your own professional looking Software Diagrams in minutes. The Software Diagrams designed with ConceptDraw DIAGRAM are vector graphic documents and are available for reviewing, modifying, converting to a variety of formats (image, HTML, PDF file, MS PowerPoint Presentation, Adobe Flash or MS Visio XML), printing and send via e-mail in one moment.Software Diagrams
Modern software development begins with designing different software diagrams and also uses a large amount of diagrams in project management and creation graphic documentation. Very popular diagrams that depict a work of applications in various cuts and notations, describe databases and prototype Graphical User Interfaces (GUIs). Software engineering specialists and software designers prefer to use special technical and business graphics tools and applications for easy creation diagrams. One of the most popular is ConceptDraw DIAGRAM diagramming and vector drawing software. ConceptDraw DIAGRAM offers the possibility of drawing with use of wide range of pre-drawn shapes and smart connectors, which allow to focus not on the process of drawing, but on the task's essence. It is a perfect application for design and document development, planning tasks, visualization of data, design the databases, object-oriented design, creation flowcharts of algorithms, modeling business processes, project management, automation of management and development processes, and for many other tasks.This IDEF0 diagram sample was created on the base of the figure from the website of the Engineering Laboratory of the National Institute of Standards and Technology (NIST). [mel.nist.gov/ msidlibrary/ doc/ kc_ morris/ gsa-final_ files/ image002.gif]
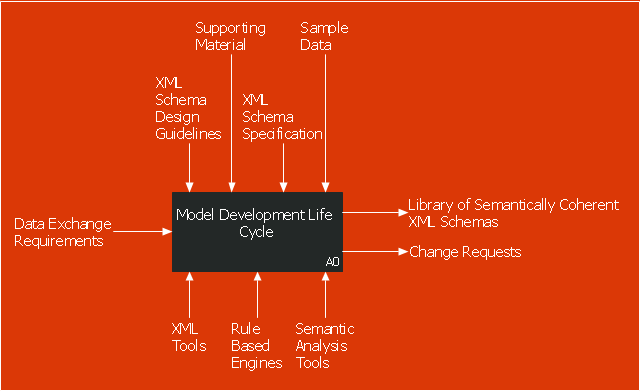
"The systems development life cycle (SDLC), also referred to as the application development life-cycle, is a term used in systems engineering, information systems and software engineering to describe a process for planning, creating, testing, and deploying an information system. The systems development life-cycle concept applies to a range of hardware and software configurations, as a system can be composed of hardware only, software only, or a combination of both." [Systems development life cycle. Wikipedia]
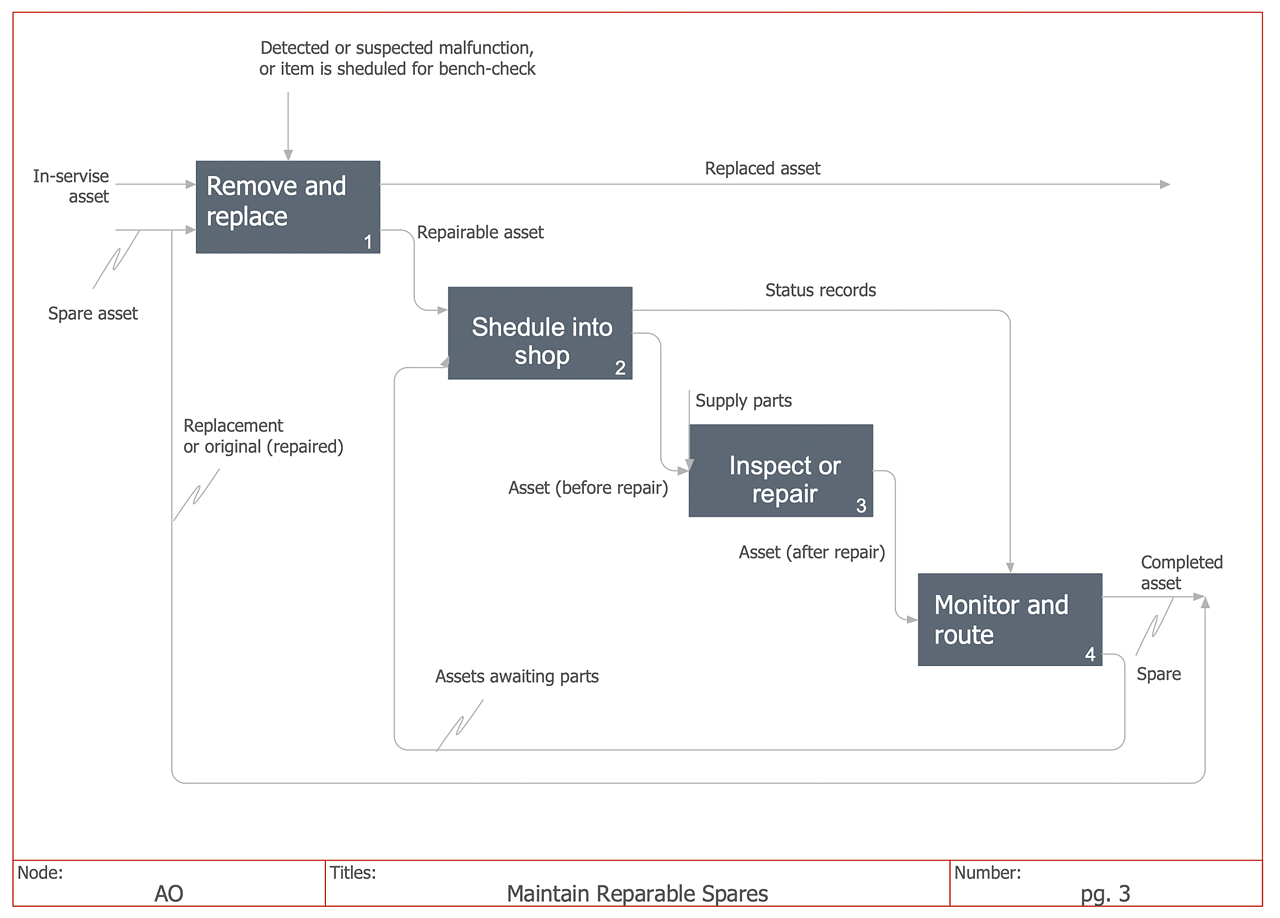
The IDEF0 diagram example "Model development life cycle" was created using the ConceptDraw PRO diagramming and vector drawing software extended with the IDEF0 Diagrams solution from the Software Development area of ConceptDraw Solution Park.
Software Diagram Examples and Templates
ConceptDraw DIAGRAM is a powerful tool for business and technical diagramming. Software Development area of ConceptDraw Solution Park provides 5 solutions: Data Flow Diagrams, Entity-Relationship Diagram (ERD), Graphic User Interface, IDEFO Diagrams, Rapid UML.Gane Sarson Diagram
The Gane-Sarson methodology uses the graphical techniques for building the logical models for the systems. It is helpful for analysts and designers to make common and clear picture of the system, to depict all its processes and how they transform the data. The Gane-Sarson methodology lets represent all this information in a way understandable for the users and other interested people, and gives the possibility to see instantly how the system's parts serve together to meet their needs. This methodology supposes the building of a system top-down. First you need create an overall system data flow, then determine the details of the data structures, the process logic and design the modular structures. ConceptDraw DIAGRAM diagramming and vector drawing software offers the Data Flow Diagrams solution with Gane-Sarson Notation library rich for the specific symbols of the Gane-Sarson notation. All they are vector and fully ready-to-use for drawing the Data Flow Diagrams, which will be then successfully used in presentations, websites, and various business documents.Financial Trade UML Use Case Diagram Example
This sample represents the actors, use cases and dependencies between them, and also the relationships between use cases. There are used dependency and use case generalization associations on this UML diagram. Use case generalization is used when you have two similar use cases, but one of them does more than another. This sample shows the work of the Financial Trade sphere and can be used by trading companies, commercial organizations, traders, different exchanges.- Systems development life cycle | SSADM Diagram | Process ...
- Venn Diagrams | Community elements overlapping | Path to ...
- Path to sustainable development | Venn Diagram Examples for ...
- Process Flowchart | JSD - Jackson system development | Systems ...
- Software Development Flow Diagram
- New Software Development Solutions for ConceptDraw DIAGRAM
- Sustainable Development Diagram
- Annotated Diagram Iterative Development
- Systems development life cycle | Block Diagrams | Circular Arrows ...
- Venn Diagram Examples for Problem Solving. Environmental Social ...
- Sustainable development | Venn Diagram | Path to sustainable ...
- Venn Diagram Of Growth And Development
- Gantt Chart For Software Development Sample
- Flow Chart For Development And Release Of New Product
- Path to sustainable development | Venn Diagrams | Sustainability ...
- Principle On Human Development In Venn Diagram
- Activities Involved In Developing An Entity Relationship Diagram
- Systems development life cycle | SSADM Diagram | Circular Flow ...
- Sustainable development | Path to sustainable development | Venn ...
