Diffusion of innovations (DOI) diagram illustrate the diffusion of innovations theory.
"Diffusion of innovations is a theory that seeks to explain how, why, and at what rate new ideas and technology spread through cultures. Everett Rogers, a professor of communication studies, popularized the theory in his book Diffusion of Innovations... The book says that diffusion is the process by which an innovation is communicated through certain channels over time among the members of a social system. ... The book espouses the theory that there are four main elements that influence the spread of a new idea: the innovation, communication channels, time, and a social system. This process relies heavily on human capital. The innovation must be widely adopted in order to self-sustain. Within the rate of adoption, there is a point at which an innovation reaches critical mass. The categories of adopters are: innovators, early adopters, early majority, late majority, and laggards ... Diffusion of Innovations manifests itself in different ways in various cultures and fields and is highly subject to the type of adopters and innovation-decision process." [Diffusion of innovations. Wikipedia]
This DOI chart example was created using the ConceptDraw PRO diagramming and vector drawing software extended with the Marketing Diagrams solution from the Marketing area of ConceptDraw Solution Park.
Venn Diagram Examples for Problem Solving. Computer Science. Chomsky Hierarchy
A Venn diagram, sometimes referred to as a set diagram, is a diagramming style used to show all the possible logical relations between a finite amount of sets. In mathematical terms, a set is a collection of distinct objects gathered together into a group, which can then itself be termed as a single object. Venn diagrams represent these objects on a page as circles or ellipses, and their placement in relation to each other describes the relationships between them. The Venn diagram example below visualizes the the class of language inclusions described by the Chomsky hierarchy.
 Marketing Diagrams
This solution extends ConceptDraw PRO with samples, templates and library of design elements for drawing the marketing diagrams.
Stakeholder Onion Diagrams
The Stakeholder Onion Diagram is a popular and widely used way to view the relationships of stakeholders to a project goal. The Onion Diagram focuses on the project goal, most of other diagram styles focus on the project, stakeholders, and timeline. This difference favorably distinguishes and separates the Onion Diagram from other types of diagrams. Design fast and easy Stakeholder Onion Diagrams of any complexity in ConceptDraw PRO diagramming and vector drawing software using the powerful tools of Stakeholder Onion Diagrams Solution from the Management Area of ConceptDraw Solution Park.
 Seven Management and Planning Tools
Seven Management and Planning Tools solution extends ConceptDraw PRO and ConceptDraw MINDMAP with features, templates, samples and libraries of vector stencils for drawing management mind maps and diagrams.
3 Tips for a Killer Presentation
Why to import PowerPoint slides into ConceptDraw MINDMAP?"SWOT Analysis.
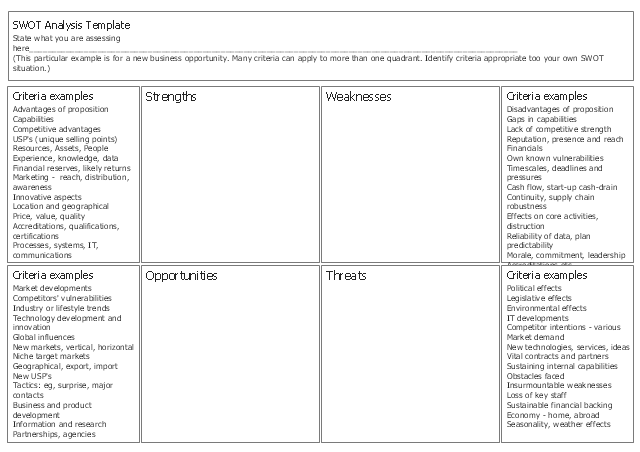
A way to identify and analyze a company's goals by assessing its strength, weaknesses, opportunities, and threats. An advantage to SWOT analysis is that it separates internal factors (strengths and weaknesses) from external ones (opportunities and threats). This allows the company to match what it could do in theory with what is possible in reality. Another advantage is the fact that conducting SWOT analysis is straightforward if the company conducting it is honest with itself." [financial-dictionary.thefreedictionary.com/ SWOT+Analysis]
This form template "New business opportunity SWOT analysis matrix" for the ConceptDraw PRO diagramming and vector drawing software is included in the SWOT Analysis solution from the Management area of ConceptDraw Solution Park.
- Diffusion of innovations graph | Diffusion And Innovation Theory ...
- Diffusion of innovations graph | Marketing Diagrams | Diffusion ...
- Diffusion of innovations graph | Marketing Diagrams | Marketing ...
- Diffusion of innovations graph | Marketing Diagrams | Roger S ...
- Diagram Of Diffusion Of Innovation Theory
- Diffusion of innovations graph | Doi Chart
- Marketing Diagrams | Think. Act. Accomplish. | Customer Loyalty ...
- Leaky bucket diagram | Explain The Leaky Bucket Principle
- Diffusion of innovations graph | How to Create a Cross Functional ...
- Workflow Diagram | Invoice payment process - Flowchart | Diffusion ...
- Bucket Theory Of Marketing
- Research cycle - Circle diagram | Innovation life cycle - Arrow loop ...
- Innovation life cycle - Arrow loop diagram | Drawing Illustration ...
- Amazon Web Services Diagrams diagramming tool for architecture ...
- Design elements - Android system icons (social) | Design elements ...
- Research cycle - Circle diagram | Word Exchange | The Conclusion ...
- Innovation life cycle - Arrow loop diagram | Systems development ...
- Proton-proton chain reaction diagram | BPR Diagram . Business ...
- Tree Diagram Software
-diffusion-of-innovations-graph.png--diagram-flowchart-example.png)


