 Event-driven Process Chain Diagrams
Event-driven Process Chain (EPC) Diagram is a type of flowchart widely used for modeling in business engineering and reengineering, business process improvement, and analysis. EPC method was developed within the Architecture of Integrated Information Systems (ARIS) framework.
 Business Process Diagrams
Business Process Diagrams solution extends the ConceptDraw PRO BPM software with RapidDraw interface, templates, samples and numerous libraries based on the BPMN 1.2 and BPMN 2.0 standards, which give you the possibility to visualize equally easy simple and complex processes, to design business models, to quickly develop and document in details any business processes on the stages of project’s planning and implementation.
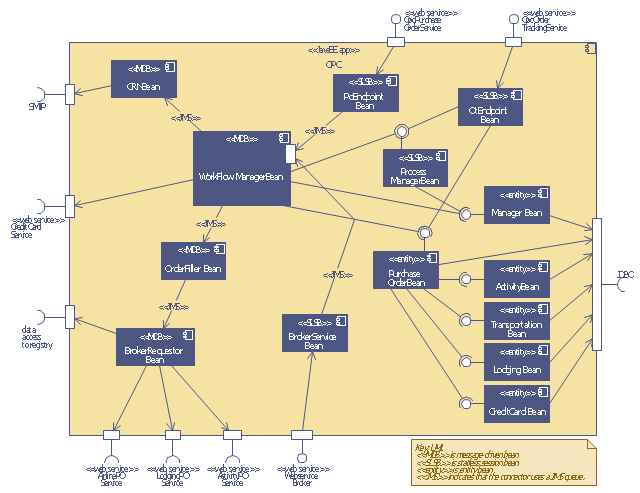
This UML sequence diagram of order processing center (OPC) was created on the base of sequence diagram from the software architecture documentation wiki of the Software Engineering Institute (SEI) of Carnegie Mellon University (CMU).
[wiki.sei.cmu.edu/ sad/ index.php/ Image:OPCRuntimeRefinementView_ PP2.png]
"Order processing is the process or work-flow associated with the picking, packing and delivery of the packed items to a shipping carrier. Order processing is a key element of order fulfillment. Order processing operations or facilities are commonly called "distribution centers"." [Order processing. Wikipedia]
This order processing center UML sequence diagram example was created using the ConceptDraw PRO diagramming and vector drawing software extended with the ATM UML Diagrams solution from the Software Development area of ConceptDraw Solution Park.
HelpDesk
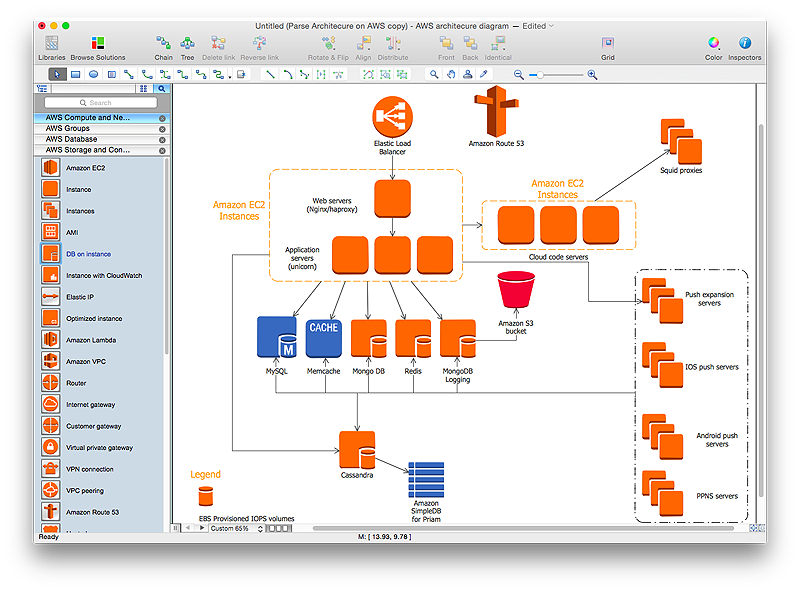
How to Create an AWS Architecture Diagram
Displaying an Amazon Web Service (AWS) cloud actually requires large amounts of attention to detail. Every element of technology has to be addressed: software, middle ware, transaction processing, scaling, data storage; the complete list is staggering. Using the ConceptDraw AWS Architecture Diagrams solution makes much easier the work on documenting the Amazon Web Service architecture. The ConceptDraw AWS Architecture Diagrams solution includes icons, sample and templates for some Amazon Web Services products and resources, to be used when buiding architecture diagrams. The icons are simple so that user can easily incorporate them in his drawings. AWS Architecture Diagrams can be used in presentations, datasheets, or any other technical visualizations.
 Computer Network Diagrams
Computer Network Diagrams solution extends ConceptDraw PRO software with samples, templates and libraries of vector icons and objects of computer network devices and network components to help you create professional-looking Computer Network Diagrams, to plan simple home networks and complex computer network configurations for large buildings, to represent their schemes in a comprehensible graphical view, to document computer networks configurations, to depict the interactions between network's components, the used protocols and topologies, to represent physical and logical network structures, to compare visually different topologies and to depict their combinations, to represent in details the network structure with help of schemes, to study and analyze the network configurations, to communicate effectively to engineers, stakeholders and end-users, to track network working and troubleshoot, if necessary.
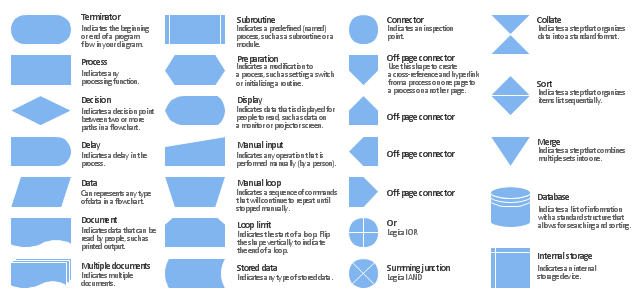
The vector stencils library "Flowchart" contains 26 symbols for drawing the flow charts using the ConceptDraw PRO diagramming and vector drawing software.
"Flowcharts are used in designing and documenting complex processes or programs. Like other types of diagrams, they help visualize what is going on and thereby help the viewer to understand a process, and perhaps also find flaws, bottlenecks, and other less-obvious features within it. There are many different types of flowcharts, and each type has its own repertoire of boxes and notational conventions. The two most common types of boxes in a flowchart are:
(1) a processing step, usually called activity, and denoted as a rectangular box;
(2) a decision, usually denoted as a diamond.
A flowchart is described as "cross-functional" when the page is divided into different swimlanes describing the control of different organizational units. A symbol appearing in a particular "lane" is within the control of that organizational unit. This technique allows the author to locate the responsibility for performing an action or making a decision correctly, showing the responsibility of each organizational unit for different parts of a single process. ...
Common alternate names include: flowchart, process flowchart, functional flowchart, process map, process chart, functional process chart, business process model, process model, process flow diagram, work flow diagram, business flow diagram. The terms "flowchart" and "flow chart" are used interchangeably." [Flowchart. Wikipedia]
The example "Design elements - Flowchart" is included in the Flowcharts solution from the area "What is a Diagram" of ConceptDraw Solution Park.
- Computers - Vector stencils library | 2-bit ALU - Logic gate diagram ...
- Design elements - Data Flow Diagram (DFD) | How to Create ...
- Design elements - Bank UML activity diagram | UML activity diagram ...
- 5 level pyramid model diagram of information systems types ...
- Order processing center - UML sequence diagram | Event-driven ...
- Business Process Elements : Swimlanes | Swim Lane Diagrams ...
- Swim Lane Diagrams | Cross-Functional Flowchart (Swim Lanes ...
- Event-driven Process Chain Diagrams EPC | Types of Flowcharts ...
- UML activity diagram - Alarm trigger processing | Design elements ...
- Design elements - Chemical engineering | Engineering | Process ...
- Event-driven Process Chain Diagrams EPC | How to Draw EPC ...
- Business Process Elements : Data | Workflow Diagram Data | Types ...
- Payroll process - Swim lane process mapping diagram | Design ...
- Design elements - Alarm and access control | UML activity diagram ...
- Process Flowchart | How to Create a Chemical Process Flow ...
- Design elements | Data Flow Diagram (DFD)
- Chemical and Process Engineering | Design elements - Chemical ...
- Design elements - Office | Office - Design Elements | Cisco Security ...
- Process flow diagram (PFD) template | Crude oil distillation unit ...


