Types of Flowcharts


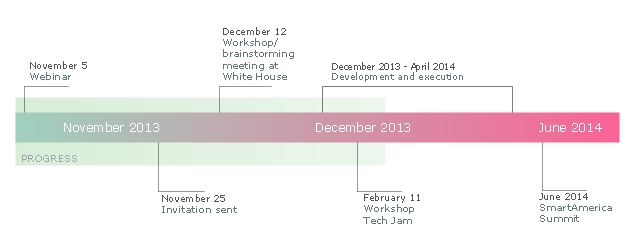
This sample was created on the base of the figure illustrating the webpage "SmartAmerica Challenge Timeline" from the website of the National Institute of Standards and Technology (NIST), an agency of the U.S. Department of Commerce. [nist.gov/ el/ sactl.cfm]
"The SmartAmerica Challenge is a White House Presidential Innovation Fellow project with the goal to bring together research in Cyber-Physical Systems (CPS) and to combine test-beds, projects and activities from different sectors, such as Smart Manufacturing, Healthcare, Smart Energy, Intelligent Transportation and Disaster Response, to show tangible and measurable benefits to the US economy and the daily lives of American citizens.
Cyber-Physical Systems is a name for the combination of the Internet of Things and System Control. So rather than just being able to “sense” where something is, CPS adds the capability to control the “thing” or allow it to interact with physical world around it.
Over 65 Companies, Government Agencies and Academic institutions came together on December 12, 2013 and launched 12 teams/ projects. Since that time 12 new projects have been formed. These teams have been hard at work over the past months building systems, prototypes, pilots and products that demonstrate the capabilities of CPS, but more importantly as the goal of the SmartAmerica Challenge they will show how these technologies will deliver socio-economic benefits to America.
The Challenge will culminate with the SmartAmerica Expo on June 11 at the Washington DC Convention Center." [smartamerica.org/ about/ ]
The timeline diagram example "" was created using the ConceptDraw PRO diagramming and vector drawing software extended with the Timeline Diagrams solution from the Management area of ConceptDraw Solution Park.
Timeline diagram
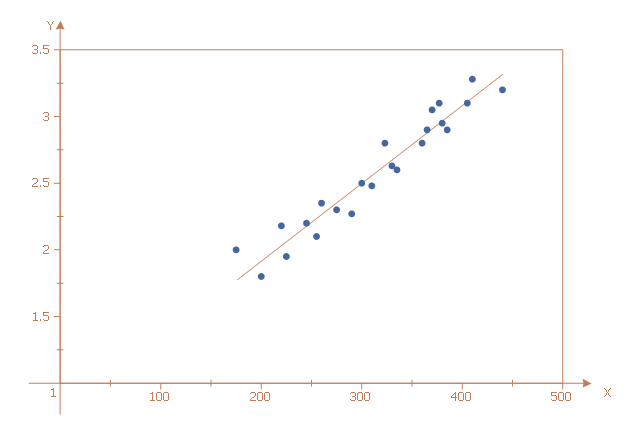
This scatter graph (scattergraph. scatter chart, scatter plot, scatterplot, scatter diagram) sample illustrates strong positive linear correlation. It was designed on the base of data from the Engineering Statistics Handbook on the website of the National Institute of Standards and Technology (NIST), the U.S. Department of Commerce.
"Note in the plot ... how a straight line comfortably fits through the data; hence a linear relationship exists. The scatter about the line is quite small, so there is a strong linear relationship. The slope of the line is positive (small values of X correspond to small values of Y; large values of X correspond to large values of Y), so there is a positive co-relation (that is, a positive correlation) between X and Y." [itl.nist.gov/ div898/ handbook/ eda/ section3/ scatter2.htm]
The scatter chart example "Strong positive linear correlation" was created using the ConceptDraw PRO diagramming and vector drawing software extended with the Scatter Diagrams solution from the Graphs and Charts area of ConceptDraw Solution Park.
Scatter chart
 Sales Flowcharts
The Sales Flowcharts solution lets you create and display sales process maps, sales process workflows, sales steps, the sales process, and anything else involving sales process management.
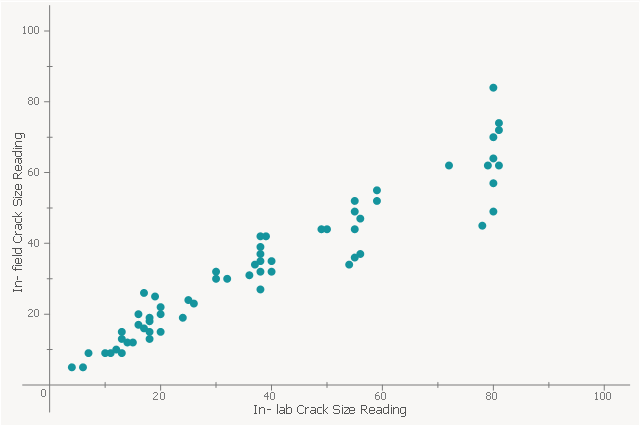
This scatter graph (scattergraph. scatter chart, scatter plot, scatterplot, scatter diagram) sample shows that a linear relationship between the two variables indicating that a linear regression model might be appropriate. It was designed on the base of data from the Engineering Statistics Handbook on the website of the National Institute of Standards and Technology (NIST), the U.S. Department of Commerce. [itl.nist.gov/ div898/ handbook/ eda/ section3/ eda33q.htm]
"In statistics, linear regression is an approach for modeling the relationship between a scalar dependent variable y and one or more explanatory variables (or independent variables) denoted X. The case of one explanatory variable is called simple linear regression." [Linear regression. Wikipedia]
The scatter chart example "Linear regression" was created using the ConceptDraw PRO diagramming and vector drawing software extended with the Scatter Diagrams solution from the Graphs and Charts area of ConceptDraw Solution Park.
Scatter chart
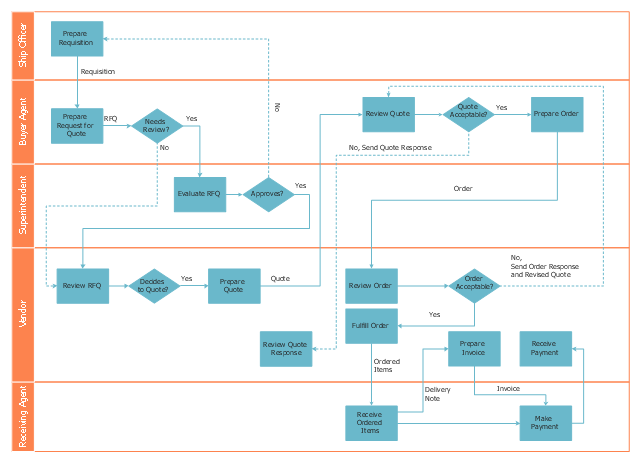
This deployment flow chart sample shows the trading process flow.
"Trade, also called goods exchange economy, is to transfer the ownership of goods from one person or entity to another by getting something in exchange from the buyer. Trade is sometimes loosely called commerce or financial transaction or barter. A network that allows trade is called a market. ...
Modern traders ... generally negotiate through a medium of exchange, such as money. As a result, buying can be separated from selling, or earning. ...
Retail trade consists of the sale of goods or merchandise from a very fixed location, such as a department store, boutique or kiosk, or by mail, in small or individual lots for direct consumption by the purchaser. Wholesale trade is defined as the sale of goods that are sold merchandise to retailers, to industrial, commercial, institutional, or other professional business users, or to other wholesalers and related subordinated services." [Trade. Wikipedia]
The swim lane diagram example "Deployment flowchart - Trading process diagram" was created using the ConceptDraw PRO diagramming and vector drawing software extended with the Cross-Functional Flowcharts solution from the Business Processes area of ConceptDraw Solution Park.
Swim lane diagram
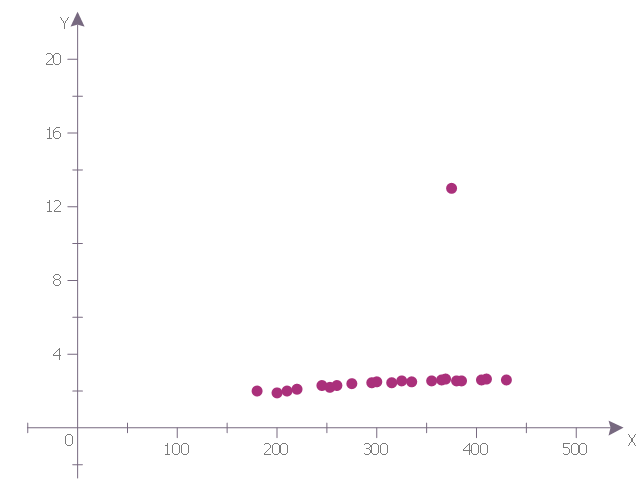
This scatter graph (scattergraph. scatter chart, scatter plot, scatterplot, scatter diagram) sample shows outliers. It was designed on the base of data from the Engineering Statistics Handbook on the website of the National Institute of Standards and Technology (NIST), the U.S. Department of Commerce.
"An outlier is defined as a data point that emanates from a different model than do the rest of the data. The data here appear to come from a linear model with a given slope and variation except for the outlier which appears to have been generated from some other model.
Outlier detection is important for effective modeling. Outliers should be excluded from such model fitting. If all the data here are included in a linear regression, then the fitted model will be poor virtually everywhere. If the outlier is omitted from the fitting process, then the resulting fit will be excellent almost everywhere (for all points except the outlying point)." [itl.nist.gov/ div898/ handbook/ eda/ section3/ eda33qa.htm]
The scatter chart example "Outlier detection" was created using the ConceptDraw PRO diagramming and vector drawing software extended with the Scatter Diagrams solution from the Statistical Charts and Diagrams area of ConceptDraw Solution Park.
Scatter chart
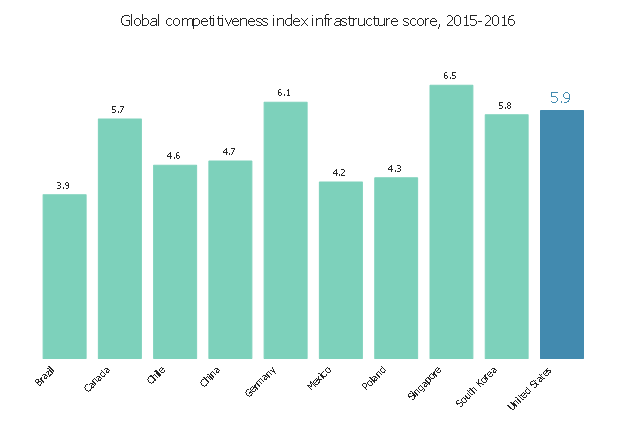
This vertical bar chart sample shows the global competitiveness index infrastructure score in 2015-2016. It was designed using data from the website "Assess Costs Everywhere (ACE)" of the United States Department of Commerce. [acetool.commerce.gov/ shipping]
"The Global Competitiveness Report (GCR) is a yearly report published by the World Economic Forum. Since 2004, the Global Competitiveness Report ranks countries based on the Global Competitiveness Index, developed by Xavier Sala-i-Martin and Elsa V. Artadi. Before that, the macroeconomic ranks were based on Jeffrey Sachs's Growth Development Index and the microeconomic ranks were based on Michael Porter's Business Competitiveness Index. The Global Competitiveness Index integrates the macroeconomic and the micro/ business aspects of competitiveness into a single index." [Global Competitiveness Report. Wikipedia]
The column graph example "Global competitiveness index infrastructure score chart" was created using the ConceptDraw PRO diagramming and vector drawing software extended with the Bar Graphs solution from the Graphs and Charts area of ConceptDraw Solution Park.
Vertical bar graph
Sales Plan

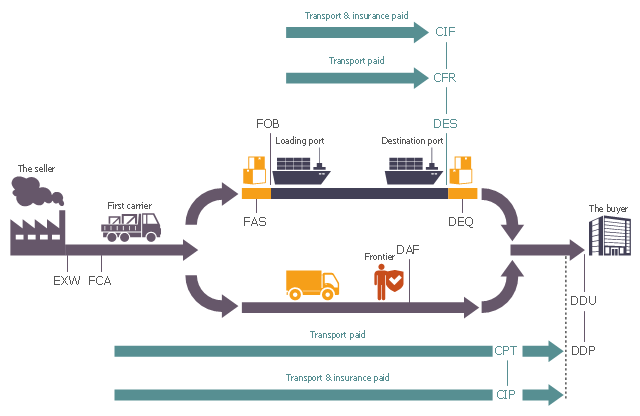
This logistic flow chart sample illustrates the transfer of risk from the seller to the buyer.
It was designed on the base of the Wikimedia Commons file: Incoterms Robert Wielgorski Revised EN.png. [commons.wikimedia.org/ wiki/ File:Incoterms_ Robert_ Wielgorski_ Revised_ EN.png]
This file is licensed under the Creative Commons Attribution-Share Alike 3.0 Unported license. [creativecommons.org/ licenses/ by-sa/ 3.0/ deed.en]
"The Incoterms rules or International Commercial Terms are a series of pre-defined commercial terms published by the International Chamber of Commerce (ICC) relating to international commercial law. They are widely used in International commercial transactions or procurement processes as the use in international sales is encouraged by trade councils, courts and international lawyers." [Incoterms. Wikipedia]
The logistic flowchart example "Transfer of risk from the seller to the buyer" was created using ConceptDraw PRO diagramming and vector drawing software extended with the Logistics Flow Charts solution from the Business Processes area of ConceptDraw Solution Park.
Logistic flowchart
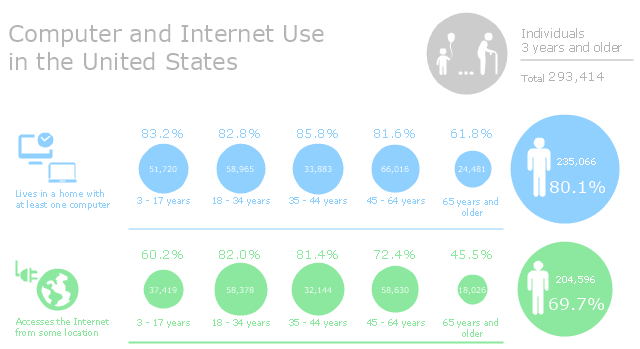
This infographic sample was created on the base of "Computer and Internet Use in the United States. Population Characteristics. Thom File. Issued May 2013." from the website of U.S. Census Bureau (U.S. Department of Commerce. Economics and Statistics Administration). [census.gov/ prod/ 2013pubs/ p20-569.pdf]
The infogram example "Computer and Internet Use in the United States" was created using the ConceptDraw PRO diagramming and vector drawing software extended with the Pictorial Infographic solition from the area "What is infographics" in ConceptDraw Solution Park.
The infogram example "Computer and Internet Use in the United States" was created using the ConceptDraw PRO diagramming and vector drawing software extended with the Pictorial Infographic solition from the area "What is infographics" in ConceptDraw Solution Park.
Pictorial infogram
- Diagram Of Commerce Flowchart
- Flow Chart Of Commerce And Trade
- | With The Aid Of Diagram Explain Division Of Commerce
- Example of DFD for Online Store (Data Flow Diagram ) DFD ...
- Draw The Diagram To Show The Various Division Of Commerce
- Online shop - Concept map | Business Process Mapping | Types of ...
- Process flowchart - Trading process | Business Process Diagrams ...
- Flow chart Example. Warehouse Flowchart | Business Process Flow ...
- Draw The Commerce Flow Chart
- SmartAmerica Challenge - Timeline | Internet Of Things Healthcare
- Example of DFD for Online Store (Data Flow Diagram ) | UML Use ...
- Global competitiveness index infrastructure score | Bar Graphs ...
- Business Process Mapping | Business Process Diagrams | Business ...
- Line Chart Examples | Strong positive linear correlation | Seven ...
- 2^x Function graph | Seven Basic Tools of Quality | Line Chart ...
- | SmartAmerica Challenge - Timeline | Network Security Diagrams ...
- Online shop - Concept map | Business Process Mapping | Business ...
- Sales Growth. Bar Graphs Example | Bar Diagrams for Problem ...
- How to Create a House of Quality Diagram | How To use House ...
- Bar Diagrams for Problem Solving. Create economics and financial ...