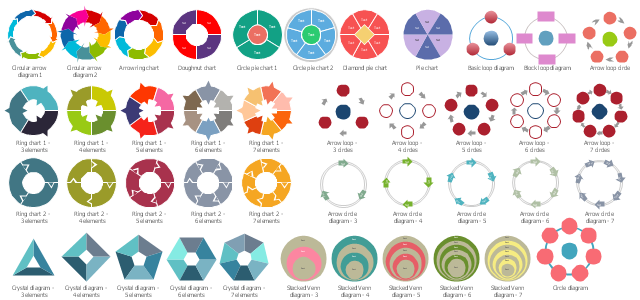
The vector stencils library "Circular diagrams" contains 42 templates of circular diagrams: circular arrow diagram, circular motion diagram, arrow ring chart, doughnut chart (donut chart), circle pie chart, diamond pie chart, circle diagram, pie chart, ring chart, loop diagram, block loop diagram, arrow loop circle, crystal diagram, triangular diagram, diamond diagram, pentagon diagram, hexagon diagram, heptagon diagram, cycle diagram (cycle chart), stacked Venn diagram (onion diagram), arrow circle diagram.
Use these shapes to illustrate your marketing and sales documents, presentations, webpages and infographics in the ConceptDraw PRO diagramming and vector drawing software extended with the Target and Circular Diagrams solution from the Marketing area of ConceptDraw Solution Park.
www.conceptdraw.com/ solution-park/ marketing-target-and-circular-diagrams
The vector stencils library "Circular diagrams" contains 42 templates of circular diagrams: circular arrow diagram, circular motion diagram, arrow ring chart, doughnut chart (donut chart), circle pie chart, diamond pie chart, circle diagram, pie chart, ring chart, loop diagram, block loop diagram, arrow loop circle, crystal diagram, triangular diagram, diamond diagram, pentagon diagram, hexagon diagram, heptagon diagram, cycle diagram (cycle chart), stacked Venn diagram (onion diagram), arrow circle diagram.
The example of marketing diagrams templates "Design elements - Circular diagrams" for the ConceptDraw PRO diagramming and vector drawing software is included the Target and Circular Diagrams solution from the Marketing area of ConceptDraw Solution Park.
www.conceptdraw.com/ solution-park/ marketing-target-and-circular-diagrams
Bubble diagrams in Landscape Design with ConceptDraw DIAGRAM
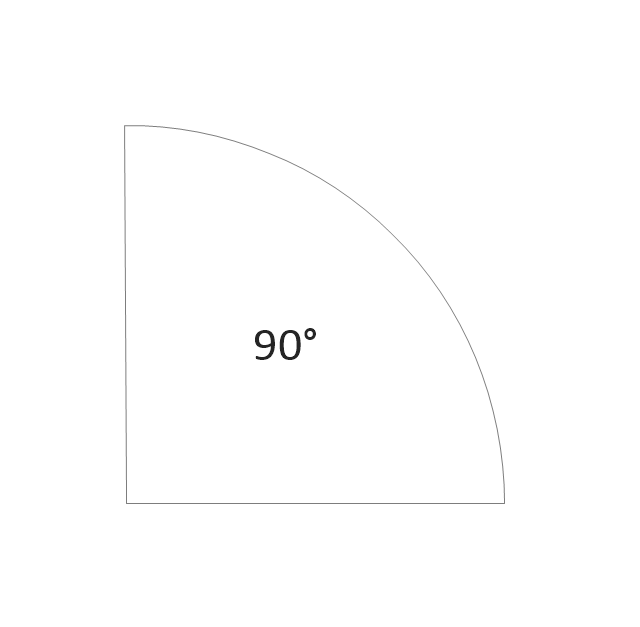
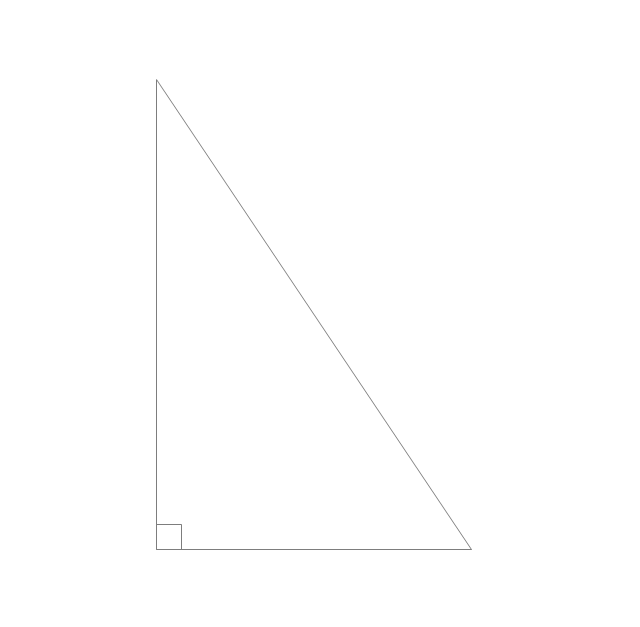
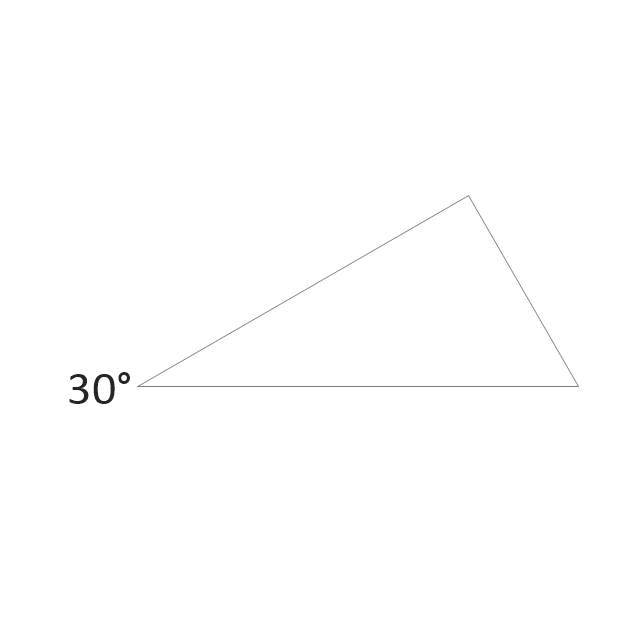
Bubble Diagrams are the charts with a bubble presentation of data with obligatory consideration of bubble's sizes. They are analogs of Mind Maps and find their application at many fields, and even in landscape design. At this case the bubbles are applied to illustrate the arrangement of different areas of future landscape design, such as lawns, flowerbeds, playgrounds, pools, recreation areas, etc. Bubble Diagram helps to see instantly the whole project, it is easy for design and quite informative, in most cases it reflects all needed information. Often Bubble Diagram is used as a draft for the future landscape project, on the first stage of its design, and in case of approval of chosen design concept is created advanced detailed landscape plan with specification of plants and used materials. Creation of Bubble Diagrams for landscape in ConceptDraw DIAGRAM software is an easy task thanks to the Bubble Diagrams solution from "Diagrams" area. You can use the ready scanned location plan as the base or create it easy using the special ConceptDraw libraries and templates.The vector stencils library "Plane geometry" contains 27 plane geometric figures.
Use these shapes to draw your geometrical diagrams and illustrations in the ConceptDraw PRO diagramming and vector drawing software extended with the Mathematics solution from the Science and Education area of ConceptDraw Solution Park.
Use these shapes to draw your geometrical diagrams and illustrations in the ConceptDraw PRO diagramming and vector drawing software extended with the Mathematics solution from the Science and Education area of ConceptDraw Solution Park.
"In geometry a polygon is traditionally a plane figure that is bounded by a finite chain of straight line segments closing in a loop to form a closed chain or circuit. These segments are called its edges or sides, and the points where two edges meet are the polygon's vertices (singular: vertex) or corners. The interior of the polygon is sometimes called its body. An n-gon is a polygon with n sides. A polygon is a 2-dimensional example of the more general polytope in any number of dimensions. ...
The basic geometrical notion has been adapted in various ways to suit particular purposes. Mathematicians are often concerned only with the bounding closed polygonal chain and with simple polygons which do not self-intersect, and they often define a polygon accordingly. A polygonal boundary may be allowed to intersect itself, creating star polygons. Geometrically two edges meeting at a corner are required to form an angle that is not straight (180°); otherwise, the line segments may be considered parts of a single edge; however mathematically, such corners may sometimes be allowed. These and other generalizations of polygons are described below." [Polygon. Wikipedia]
The geometry diagram example "Polygon types" was created using the ConceptDraw PRO diagramming and vector drawing software extended with the Mathematics solution from the Science and Education area of ConceptDraw Solution Park.
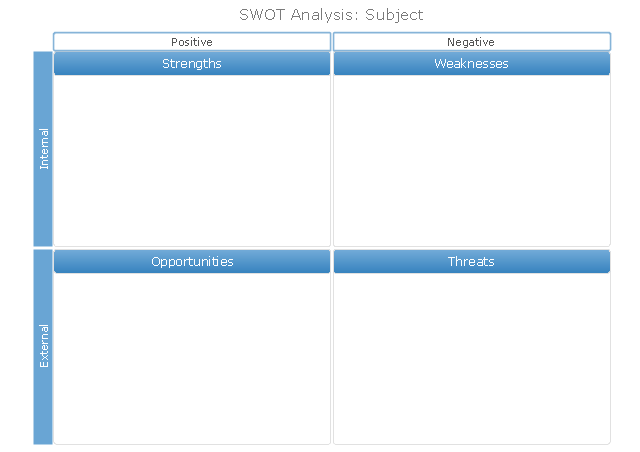
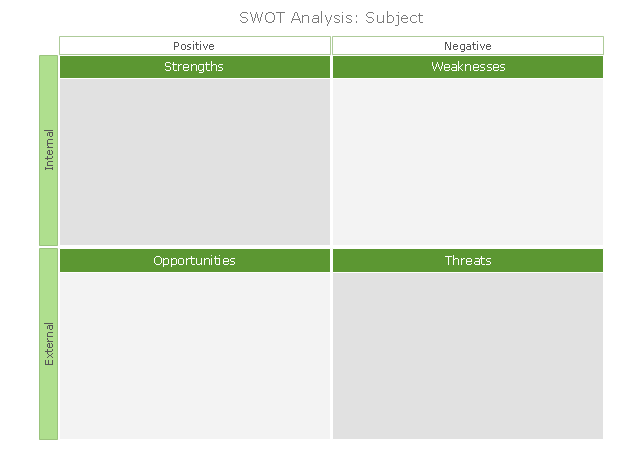
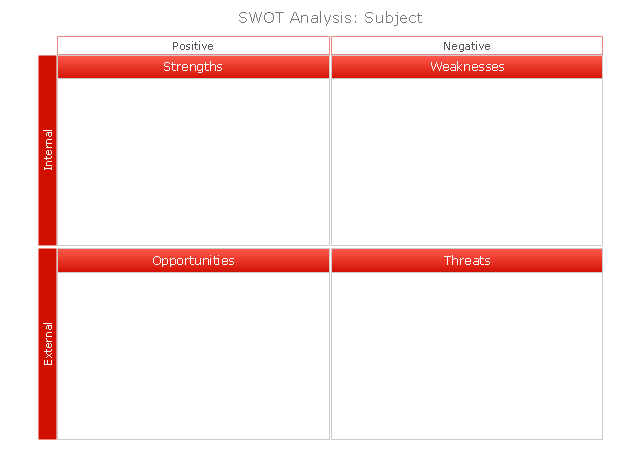
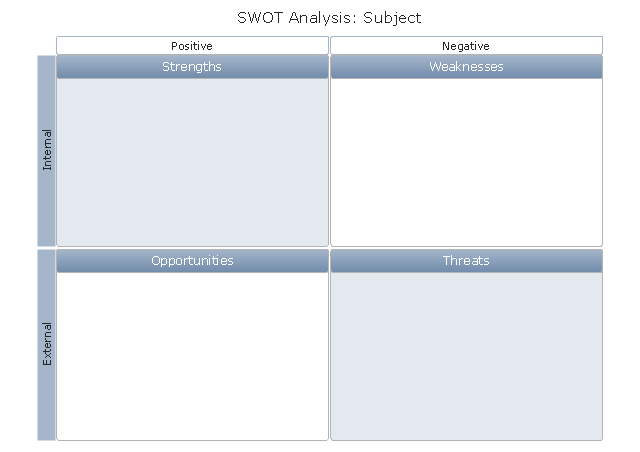
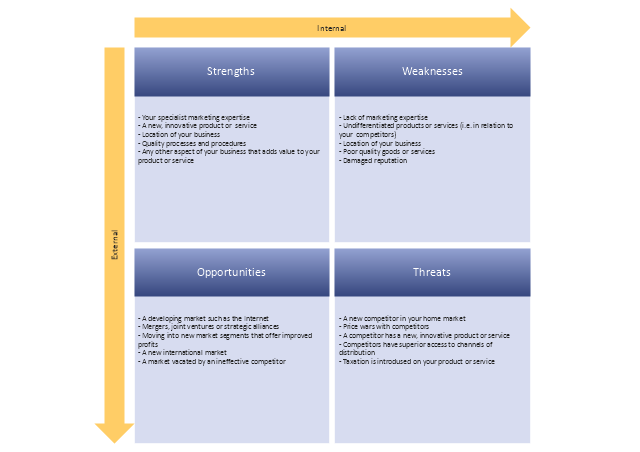
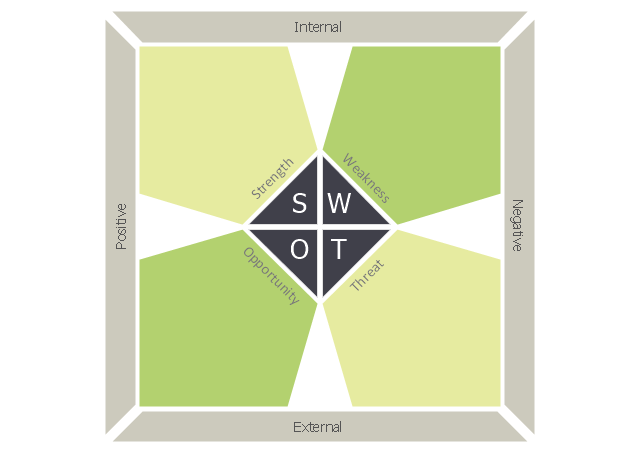
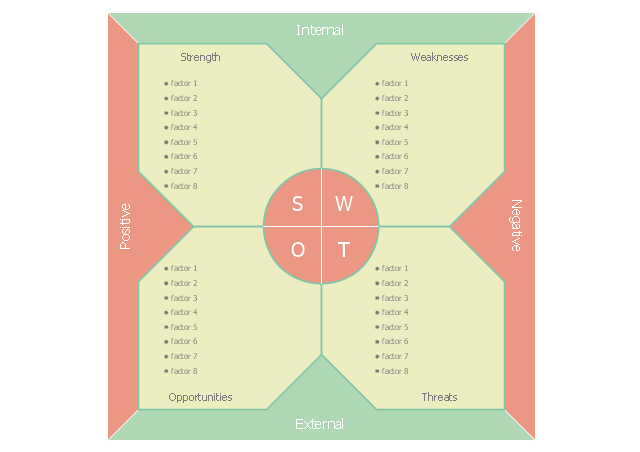
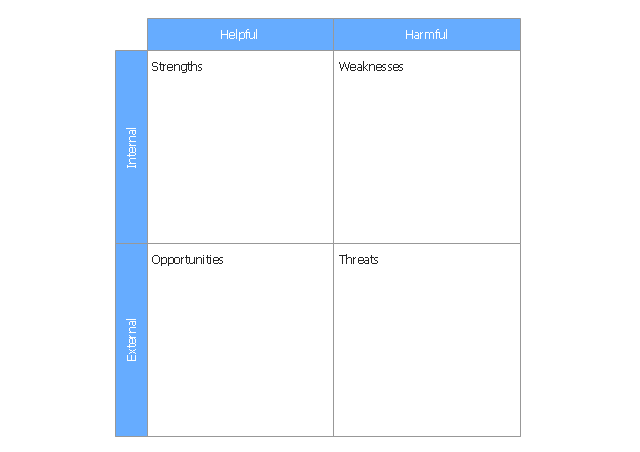
"SWOT analysis is a classic strategic planning tool. Using a framework of internal strengths and weaknesses and external opportunities and threats, it provides a simple way to assess how a strategy can best be implemented. The tool helps planners be realistic about what they can achieve, and where they should focus. ...
The SWOT framework - a two-by-two matrix - is best completed in a group with key members of the team or organisation present. First it is important to be clear what the policy change objective is, and what team or organisation the analysis is being carried out on. Once these are clarified and agreed, begin with a brainstorm of ideas, and then hone them down and clarify them afterwards in discussion.
An assessment of internal capacity helps identify where the project or organisation is now: the existing resources that can be used immediately and current problems that won't go away. It can help identify where new resources, skills or allies will be needed. When thinking of strengths it is useful to think of real examples of success to ground and clarify the conversation. ...
An assessment of the external environment tends to focus on what is going on outside the organisation, or areas which are not yet affecting the strategy but could do - either positively or negatively." [odi.org.uk/ publications/ 5876-swot-analysis-context-mapping]
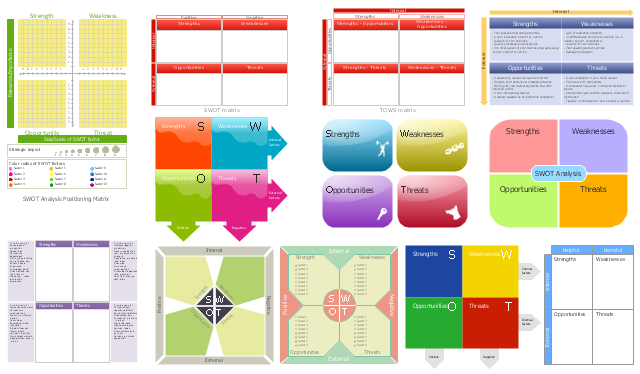
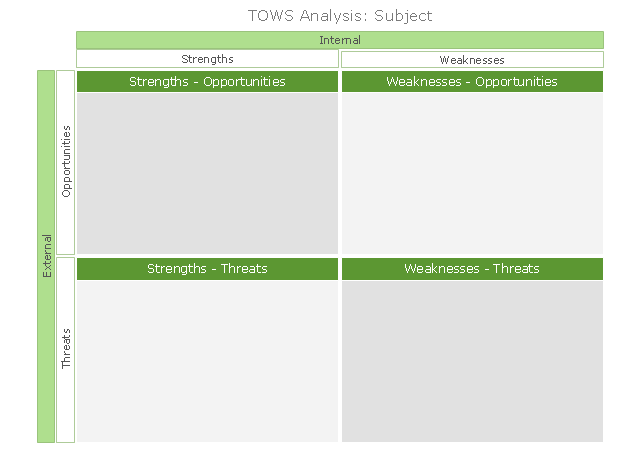
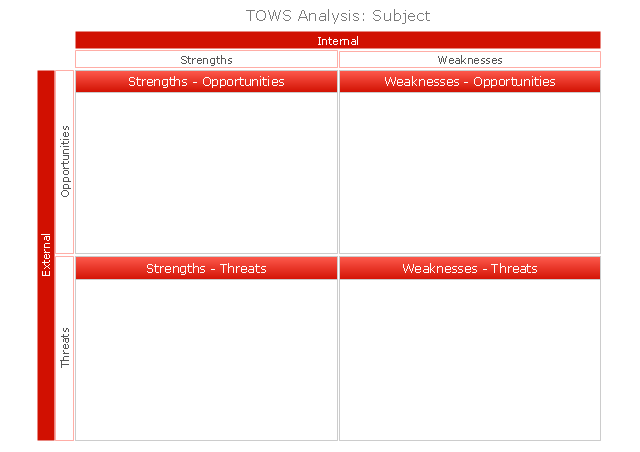
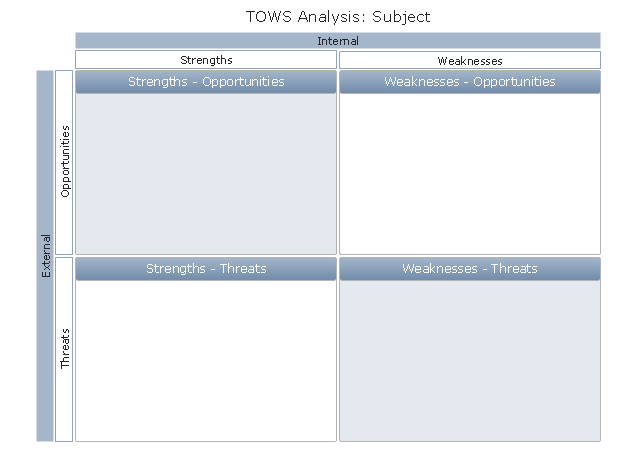
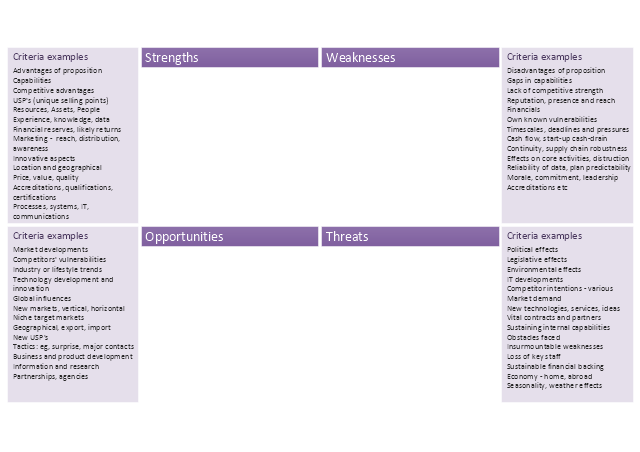
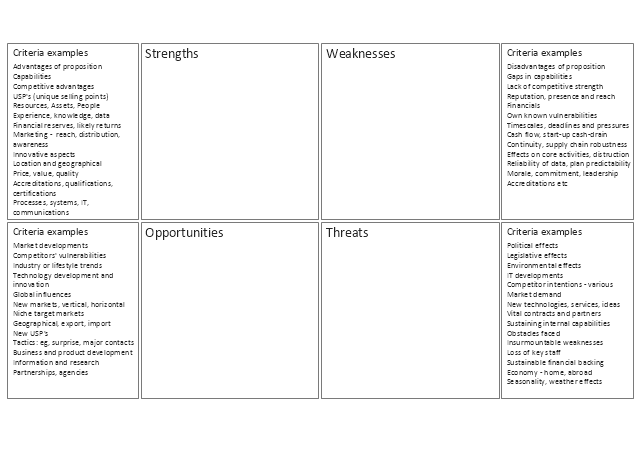
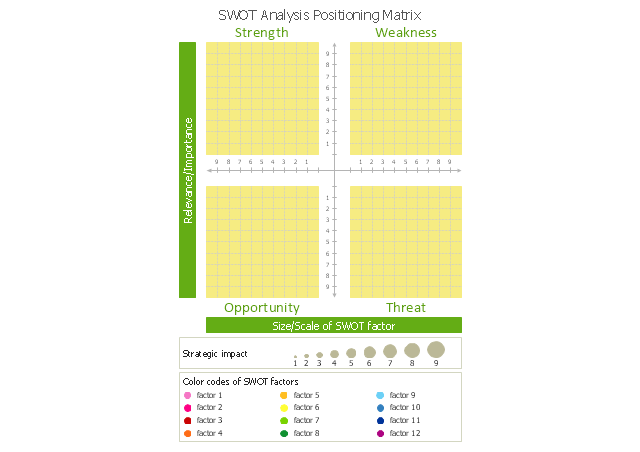
The vector stencils library "SWOT" contains 16 SWOT and TOWS matrix diagram templates for the ConceptDraw PRO diagramming and vector drawing software.
The example "Design elements - SWOT and TOWS analysis matrices" is included in the SWOT Analysis solution from the Management area of ConceptDraw Solution Park.
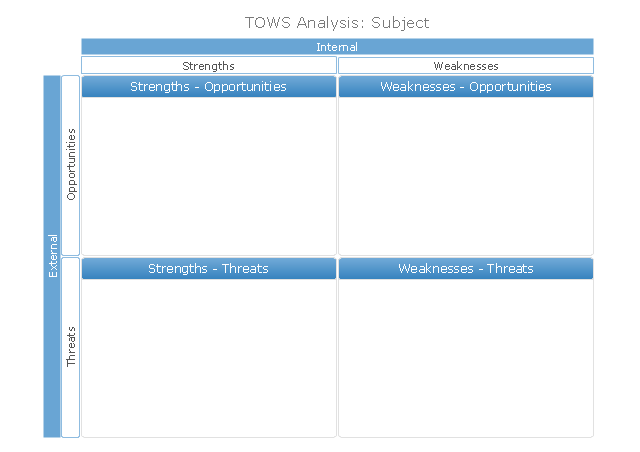
The vector stencils library "SWOT" contains 19 SWOT and TOWS analysis matrix diagram templates. Use it to create your SWOT and TOWS matrices in the ConceptDraw PRO diagramming and vector drawing software extended with the SWOT Analysis solution from the Management area of ConceptDraw Solution Park.
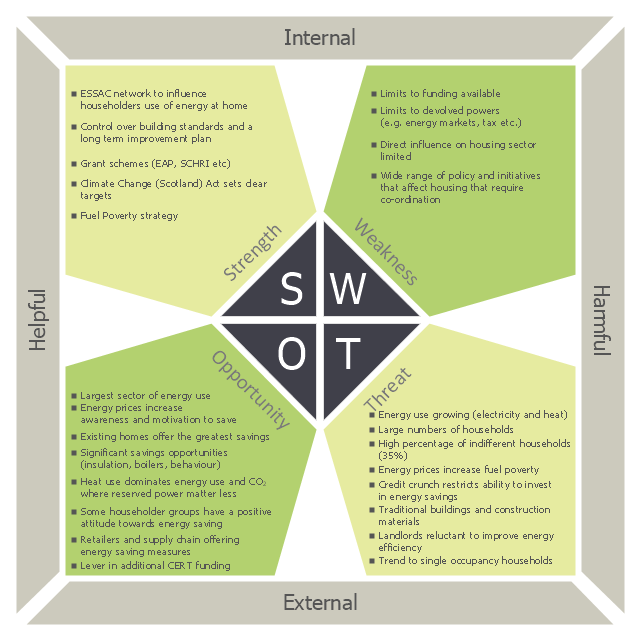
This sample was created on the base of the SWOT matrix illustrating the webpage "SWOT Analysis" of "Scottish Energy Study Volume 4: Issues, Opportunities and Barriers" from the website of the Scottish Government. [scotland.gov.uk/ Publications/ 2009/ 09/ 24094712/ 6]
The diagram example "Domestic sector SWOT" was created using the ConceptDraw PRO diagramming and vector drawing software extended with the SWOT Analysis solution from the Management area of ConceptDraw Solution Park.
The diagram example "Domestic sector SWOT" was created using the ConceptDraw PRO diagramming and vector drawing software extended with the SWOT Analysis solution from the Management area of ConceptDraw Solution Park.
The vector stencils library "SWOT" contains 19 SWOT and TOWS analysis matrix diagram templates. Use it to create your SWOT and TOWS matrices in the ConceptDraw PRO diagramming and vector drawing software extended with the SWOT Analysis solution from the Management area of ConceptDraw Solution Park.
- Plane geometry - Vector stencils library | Venn Diagram Template ...
- Pentagon Diagrams
- Arrow circle chart - Template | Circular diagrams - Vector stencils ...
- Basic Flowchart Symbols and Meaning | Venn Diagram Template ...
- 5 Segment Pentagon
- Basic Flowchart Symbols and Meaning | Circular diagrams - Vector ...
- Plane geometry - Vector stencils library | Template Pentagon Box
- White Pentagon
- Circular diagrams - Vector stencils library | Basic Flowchart Symbols ...
- Target and Circular Diagrams | How to Draw a Circular Arrows ...
- Circular diagrams - Vector stencils library | Circular Arrows ...
- Basic Flowchart Symbols and Meaning | Arrow circle chart ...
- Venn Diagram Three Circles
- Circle Spoke Diagram Template | Fishbone Diagram Template ...
- Circular Diagram | Target and Circular Diagrams | Circular Flow ...
- Brand essence model - Wheel diagram | Marketing mix - Wheel ...
- 3 Circle Venn Diagram Vector
- Circular diagrams - Vector stencils library | Circular Arrows ...
- Circular diagrams - Vector stencils library | Plane geometry - Vector ...
- Circular diagrams - Vector stencils library | Collaboration life-cycle ...


