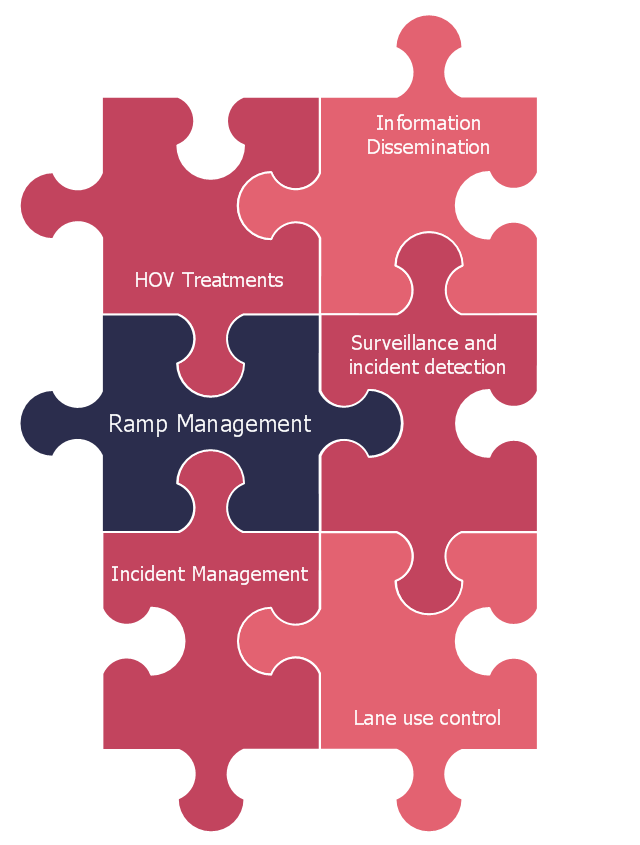
This sample was created on the base of the puzzles diagram from the webpage "Ramp Management and Control" of US Department of Transportation Federal Highway Administration website.
[ops.fhwa.dot.gov/ publications/ ramp_ mgmt_ handbook/ brochure/ brochure.htm]
"What is Ramp Management?
Ramp Management is the…“application of control devices, such as traffic signals, signing, and gates to regulate the number of vehicles entering or leaving the freeway, in order to achieve operational objectives”.
Ramp Management Strategies.
There are four accepted and proven strategies to manage ramp-based traffic:
(1) Ramp Metering - The use of traffic signal(s) deployed alongside a ramp to control the rate at which vehicles enter a freeway facility.
(2) Ramp Closure - Ramp closure involves the use of gates, barriers or cones to restrict vehicle access to a ramp. Closures can be permanent, temporary, or scheduled.
(3) Special Use Treatments - Special use treatments give “special” consideration to a vehicle class or classes to improve safety, improve traffic conditions, and/ or encourage specific types of driving behavior.
(4) Ramp Terminal Treatments - Ramp terminal treatments are solutions to problems that occur at or near ramp/ arterial intersections. ...
The Relationship between Ramp Management and Freeway Management.
Ramp management is a single function that typically falls under the freeway management umbrella. Ramp management elements work with other elements of freeway management (e.g., HOV Treatments and Incident Management) to deliver freeway management system goals and objectives. This relationship can be likened to puzzle pieces with ramp management representing one of the pieces that need to collectively come together to ensure successful operations. In addition to freeway management, ramp management should also be coordinated closely with arterial management, transit management, and other parts of the overall surface transportation system." [ops.fhwa.dot.gov/ publications/ ramp_ mgmt_ handbook/ brochure/ brochure.htm]
The puzzles diagram example "The relationship between ramp management and freeway management" was created using the ConceptDraw PRO diagramming and vector drawing software extended with the Marketing Diagrams solution from the Marketing area of ConceptDraw Solution Park.
 Artwork
Artwork solution extends ConceptDraw DIAGRAM software with illustration samples, templates and libraries of vector clipart of architecture, food, music, funny animals, aquatic fauna and transport.
 Marketing Diagrams
Marketing Diagrams solution extends ConceptDraw DIAGRAM diagramming software with abundance of samples, templates and vector design elements intended for easy graphical visualization and drawing different types of Marketing diagrams and graphs, including Branding Strategies Diagram, Five Forces Model Diagram, Decision Tree Diagram, Puzzle Diagram, Step Diagram, Process Chart, Strategy Map, Funnel Diagram, Value Chain Diagram, Ladder of Customer Loyalty Diagram, Leaky Bucket Diagram, Promotional Mix Diagram, Service-Goods Continuum Diagram, Six Markets Model Diagram, Sources of Customer Satisfaction Diagram, etc. Analyze effectively the marketing activity of your company and apply the optimal marketing methods with ConceptDraw DIAGRAM software.
The vector stencils library "Puzzles" contains 15 clipart images of puzzles.
"A puzzle is a game or problem which tests the ingenuity of a would-be solver. In a puzzle, one is required to put pieces together, in a logical way, in order to arrive at the correct solution of the puzzle. There are different types of puzzles for different ages. ...
Puzzles can be divided into categories. For example a maze is a type of tour puzzle. Some other categories are construction puzzles, stick puzzles, tiling puzzles, transport puzzles, disentanglement puzzles, lock puzzles, folding puzzles, combination puzzles, and mechanical puzzles." [Puzzle. Wikipedia]
The clip art example "Puzzles - Vector stencils library" was created using the ConceptDraw PRO diagramming and vector drawing software extended with the Artwork solution from the Illustration area of ConceptDraw Solution Park.
www.conceptdraw.com/ solution-park/ illustrations-artwork
This vector stencils library contains 195 cloud computing icons.
Use it to design cloud computing infographic and diagrams with ConceptDraw PRO software.
"Cloud computing, also on-demand computing, is a kind of Internet-based computing that provides shared processing resources and data to computers and other devices on demand. It is a model for enabling ubiquitous, on-demand access to a shared pool of configurable computing resources (e.g., networks, servers, storage, applications and services), which can be rapidly provisioned and released with minimal management effort. Cloud computing and storage solutions provide users and enterprises with various capabilities to store and process their data in third-party data centers.
Cloud computing has become a highly demanded service or utility due to the advantages of high computing power, cheap cost of services, high performance, scalability, accessibility as well as availability." [Cloud computing. Wikipedia]
The vector stencils library "Cloud clipart" is included in the Cloud Computing Diagrams solution from the Computer and Networks area of ConceptDraw Solution Park.
This vector stencils library contains 184 round icons.
Use it to design cloud computing infographics and diagrams with ConceptDraw PRO software.
"Though service-oriented architecture advocates "everything as a service" (with the acronyms EaaS or XaaS or simply aas), cloud-computing providers offer their "services" according to different models, which happen to form a stack: infrastructure-, platform- and software-as-a-service.
Infrastructure as a service (IaaS)
In the most basic cloud-service model ... providers of IaaS offer computers — physical or (more often) virtual machines — and other resources. IaaS refers to online services that abstract the user from the details of infrastructure like physical computing resources, location, data partitioning, scaling, security, backup etc.
Platform as a service (PaaS)
PaaS vendors offer a development environment to application developers. The provider typically develops toolkit and standards for development and channels for distribution and payment. In the PaaS models, cloud providers deliver a computing platform, typically including operating system, programming-language execution environment, database, and web server. Application developers can develop and run their software solutions on a cloud platform without the cost and complexity of buying and managing the underlying hardware and software layers.
Software as a service (SaaS)
In the software as a service (SaaS) model, users gain access to application software and databases. Cloud providers manage the infrastructure and platforms that run the applications. SaaS is sometimes referred to as "on-demand software" and is usually priced on a pay-per-use basis or using a subscription fee.
In the SaaS model, cloud providers install and operate application software in the cloud and cloud users access the software from cloud clients. Cloud users do not manage the cloud infrastructure and platform where the application runs. This eliminates the need to install and run the application on the cloud user's own computers, which simplifies maintenance and support. Cloud applications differ from other applications in their scalability — which can be achieved by cloning tasks onto multiple virtual machines at run-time to meet changing work demand." [Cloud computing. Wikipedia]
The vector stencils library "Cloud round icons" is included in the Cloud Computing Diagrams solution from the Computer and Networks area of ConceptDraw Solution Park.
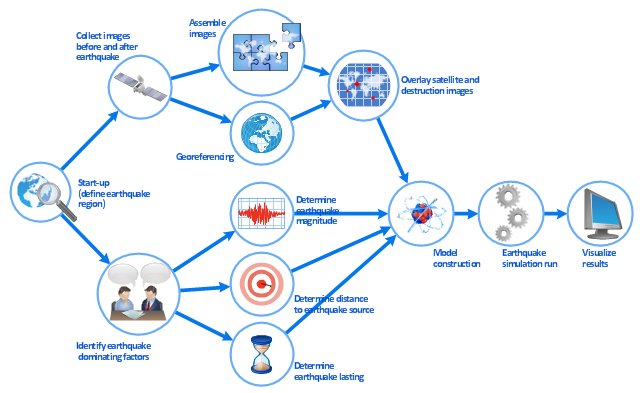
This work flow chart sample was redesigned from the picture "Simulation for earthquake disaster assessment" from the article "Simulation Workflows".
[iaas.uni-stuttgart.de/ forschung/ projects/ simtech/ sim-workflows.php]
" This simulation was developed to have an in depth understanding of the destructions and the decisions to be made in various phases of crisis management (Source: Mahdi Hashemi and Ali A. Alesheikh (2010). "Developing an agent based simulation model for earthquakes in the context of SDI." GSDI 12 World Conference. 19 – 22 October 2010. Singapour). The simulation process contains following major steps:
(1) All spatial information including satellite images (before and after the earthquake) and topographic/ cadastral maps of the area are mosaicked and georeferenced. The parts of the city that contain various levels of destructions are selected. Three types of features namely buildings, roads and recreational areas are classified and extracted from the satellite images.
(2) The governing factors of destructions are identified; a mathematical model that integrates the factors is constructed.
(3) The simulation is constructed for various parameter values (different earthquake strength, time elapses, etc.)" [iaas.uni-stuttgart.de/ forschung/ projects/ simtech/ sim-workflows.php]
The example "Workflow diagram - Earthquake disaster assessment" was drawn using the ConceptDraw PRO diagramming and vector drawing software extended with the Workflow Diagrams solution from the Business Processes area of ConceptDraw Solution Park.
Data Flow Diagrams
The information system manages the flow of data introduced into the system. To graphically represent and document the flow of data through some information system is used a Data Flow Diagram (DFD). DFD is a way to visualize the flow of data or data processing, to clearly demonstrate what type of data or information is transferred, where they come from and where are sent. It lets to create an overview of the system, to depict the major steps, and effectively model the processes. DFDs are helpful for analyzing and modifying the business systems. Traditionally are used two notations for DFDs creation - Yourdon-Coad and Gane-Sarson. ConceptDraw DIAGRAM software offers a special Data Flow Diagrams solution from Software Development area, which enables to quickly and simply create professional Data Flow Diagrams including the data storage, data flows, external entities, functional transforms, control transforms and signals. Use the offered templates, samples and extensive range of libraries to design your own Data Flow Diagrams in minutes.
 IDEF Business Process Diagrams
Use the IDEF Business Process Diagrams solution to create effective database designs and object-oriented designs, following the integration definition methodology.
- Puzzle piece diagram - Alternating sign matrix | Artwork | Marketing ...
- Puzzle piece diagram - Alternating sign matrix | Marketing Diagrams ...
- Artwork | Five Circle Venn Diagram Puzzle
- Puzzle piece diagram - Alternating sign matrix | The relationship ...
- Data Flow Diagram Of Software Puzzle
- Puzzles - Vector stencils library | Cloud clipart - Vector stencils ...
- Marketing Diagrams | How To Draw Building Plans | Australia Map ...
- Puzzle Pieces
- Example Of System Flow Diagram For The Puzzle Project
- Puzzle Charts

















-cloud-clipart---vector-stencils-library.png--diagram-flowchart-example.png)
-cloud-clipart---vector-stencils-library.png--diagram-flowchart-example.png)


-cloud-clipart---vector-stencils-library.png--diagram-flowchart-example.png)


-cloud-clipart---vector-stencils-library.png--diagram-flowchart-example.png)
-cloud-clipart---vector-stencils-library.png--diagram-flowchart-example.png)


