 ATM UML Diagrams
The ATM UML Diagrams solution lets you create ATM solutions and UML examples. Use ConceptDraw PRO as a UML diagram creator to visualize a banking system.
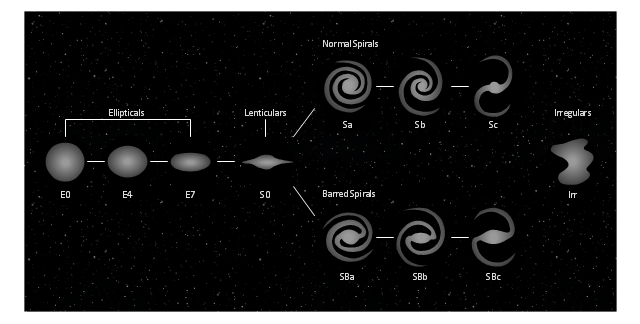
This tuning-fork style diagram of the Hubble sequence was created on the base of the Wikimedia Commons file: Hubble sequence photo.png. [commons.wikimedia.org/ wiki/ File:Hubble_ sequence_ photo.png]
"The Hubble sequence is a morphological classification scheme for galaxies invented by Edwin Hubble in 1936. It is often known colloquially as the Hubble tuning fork diagram because of the shape in which it is traditionally represented.
Hubble’s scheme divides regular galaxies into 3 broad classes - ellipticals, lenticulars and spirals - based on their visual appearance (originally on photographic plates). A fourth class contains galaxies with an irregular appearance. To this day, the Hubble sequence is the most commonly used system for classifying galaxies, both in professional astronomical research and in amateur astronomy." [Hubble sequence. Wikipedia]
The astronomical diagram example "Tuning-fork style diagram of the Hubble sequence" was created using the ConceptDraw PRO diagramming and vector drawing software extended with the Astronomy solution from the Science and Education area of ConceptDraw Solution Park.
 Stakeholder Onion Diagrams
The Stakeholder Onion Diagram is often used as a way to view the relationships of stakeholders to a project goal. A basic Onion Diagram contains a rich information. It shows significance of stakeholders that will have has influence to the success achieve
- Entity Relationship Diagram Symbols | Martin ERD Diagram | ER ...
- Entity Relationship Diagram Symbols | ER Diagram Styles | ERD ...
- Entity Relationship Diagram Symbols | ERD Symbols and Meanings ...
- Entity Relationship Diagram Symbols | ER Diagram Styles | Chen ...
- Entity Relationship Diagram Symbols | ER Diagram Styles | Entity ...
- ER Diagram Styles | Top 5 Android Flow Chart Apps | Components ...
- ER Diagram Styles | Universal Diagramming Area | ConceptDraw ...
- Entity Relationship Diagram Symbols
- ConceptDraw PRO ER Diagram Tool | ER Diagram Styles | Entity ...
- Martin ERD Diagram | Chen ERD Diagram | Entity Relationship ...
- Components of ER Diagram | ER Diagram Styles | Sample Merise ...
- ER Diagram Styles | Express-G Diagram | ER Diagram Programs for ...
- Express-G Diagram | ER Diagram Styles | Entity-Relationship ...
- ER Diagram Styles | Design Element: Chen for Entity Relationship ...
- Entity Relationship Diagram Symbols | ERD Symbols and Meanings ...
- ERD Symbols and Meanings | ER Diagram Styles | Entity ...
- Entity-Relationship Diagram (ERD) | How to Draw ER Diagrams | ER ...
- ER Diagram Styles | Entity Relationship Diagram Symbols | ERD ...
- Jacobson Use Cases Diagram | JSD - Jackson system development ...
