HelpDesk
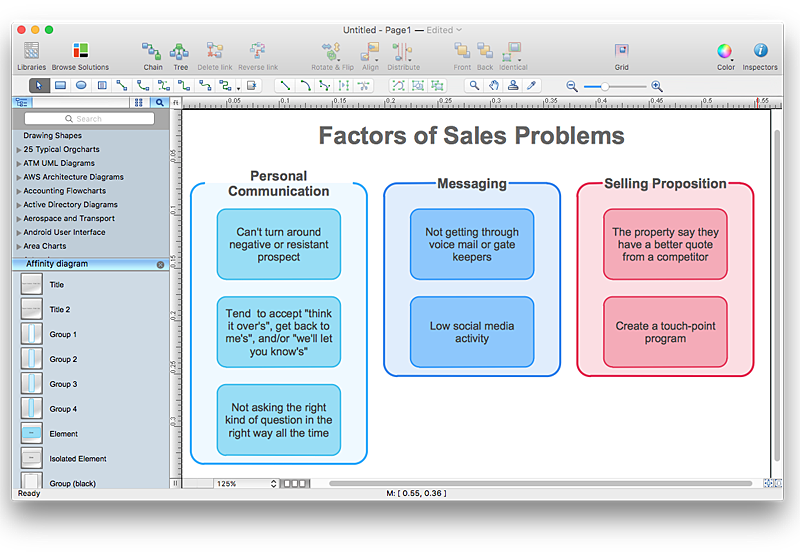
How To Create an Affinity Diagram Using ConceptDraw Office
Affinity diagram is designed to prepare the data for further analysis of the cause-effect relationships.The Affinity diagram shows the structure of large, complex factors that have an influence on a problem, and then divides them up into a smaller and simpler structure. We recommend using a mind map for Brainstorming and collecting the factors affecting the problem. The ability to create an Affinity diagram from a mind map is supported by the ConceptDraw Seven Management and Planning Tools solution.HelpDesk
How to Create a Fishbone (Ishikawa) Diagram Quickly
A Fishbone (Ishikawa) diagram is also called cause-and-effect diagram. Fishbone diagram is often used in business to determine the cause of some problem. The diagram illustrates the main causes and sub-causes leading to an event. The main goal of the Fishbone diagram is to illustrate in a graphical way the relationship between a given outcome and all the factors that influence this outcome. The complete diagram resembles a fish skeleton as its name implies. The ability to create a Fishbone Diagram is supported by the Fishbone Diagram solution. Use ConceptDraw MINDMAP for structuring data and then ConceptDraw PRO for generating a Fishbone Diagram from mind map structure.HelpDesk
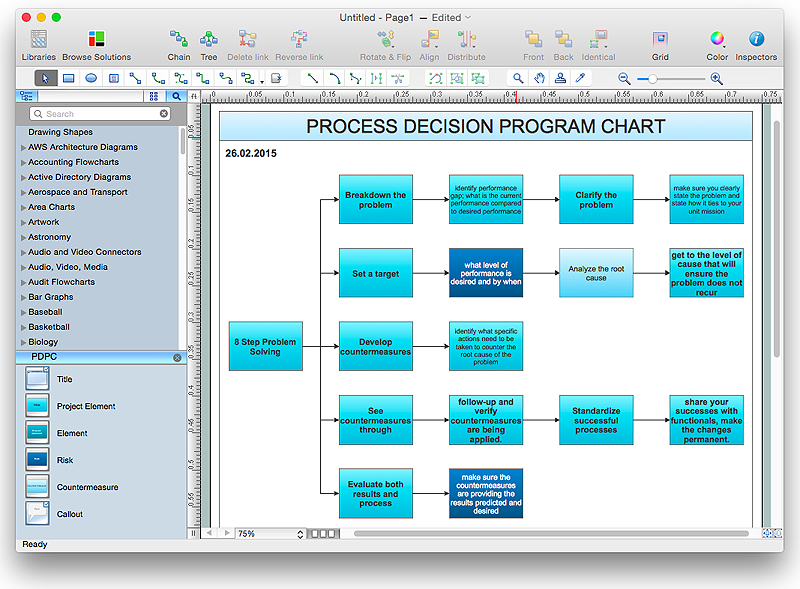
How To Create Risk Diagram (PDPC)
Article on how to identify possible risks when carrying out corrective actions, and define preventive actions
HelpDesk
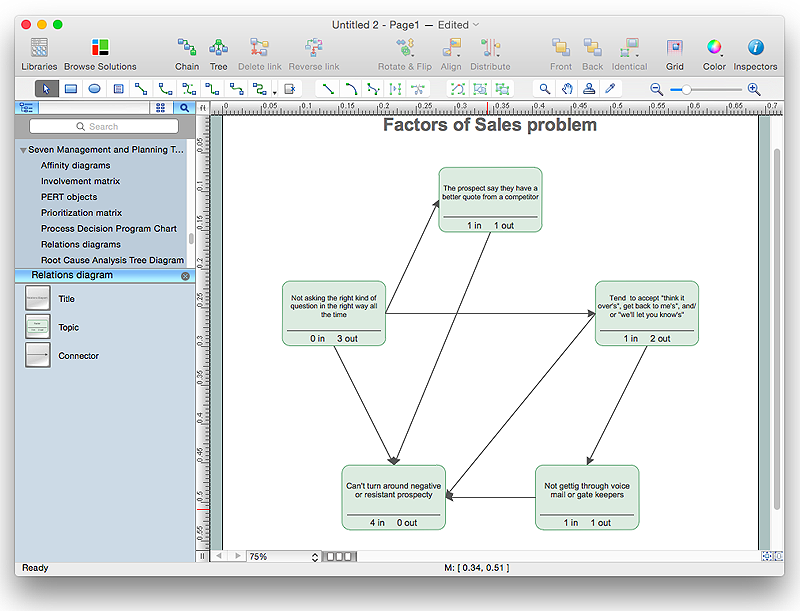
How To Create the Interaction (Relation) Diagram
Identify relationships between factors affecting a problem using interaction (relation) diagram. The ability to create a Relation diagram from a mind map is supported by the ConceptDraw Seven Management and Planning Tools solution.- Circular Flow Diagram Template | ConceptDraw Solution Park ...
- Circular Arrows Diagrams | Circular Flow Diagram Template ...
- Value Stream Mapping | Quality Mind Map | Lean Fishbone Diagram ...
- Mind Map Organizational Chart
- How To Do A Mind Map In PowerPoint | Organizational Chart ...
- SWOT matrix template | Flow chart Example. Warehouse Flowchart ...
- SWOT analysis matrix diagram templates | ConceptDraw MINDMAP ...
- How to Convert a Mind Map into MS Word Document | Bar Chart ...
- Mindmap Diagram Template Word Document
- Organizational Chart Templates . Free Download | Importing data ...
- Quality Mind Map | Mindmap Diagrams On Banking System
- Mind Map Diagram Sample Template
- Total Quality Management Value | Seven Basic Tools of Quality ...
- How to Insert a Mind Map into Microsoft Word Document ...
- Mind Map Template For History
- Draw Fishbone Diagram on MAC Software | Fishbone Diagrams ...
- Text To Mind Map Powerpoint Template
- Active Directory Domain Services | Active Directory Diagrams ...
- Concept Map Maker | How to Insert a Mind Map into Microsoft Word ...


