 Entity-Relationship Diagram (ERD)
Entity-Relationship Diagram (ERD) solution extends ConceptDraw PRO software with templates, samples and libraries of vector stencils from drawing the ER-diagrams by Chen's and crow’s foot notations.
HelpDesk
How to Work with Custom Properties
ConceptDraw PRO can store additional, user-defined data that can be assigned to a particular shape. This data is stored in the Custom Properties options.
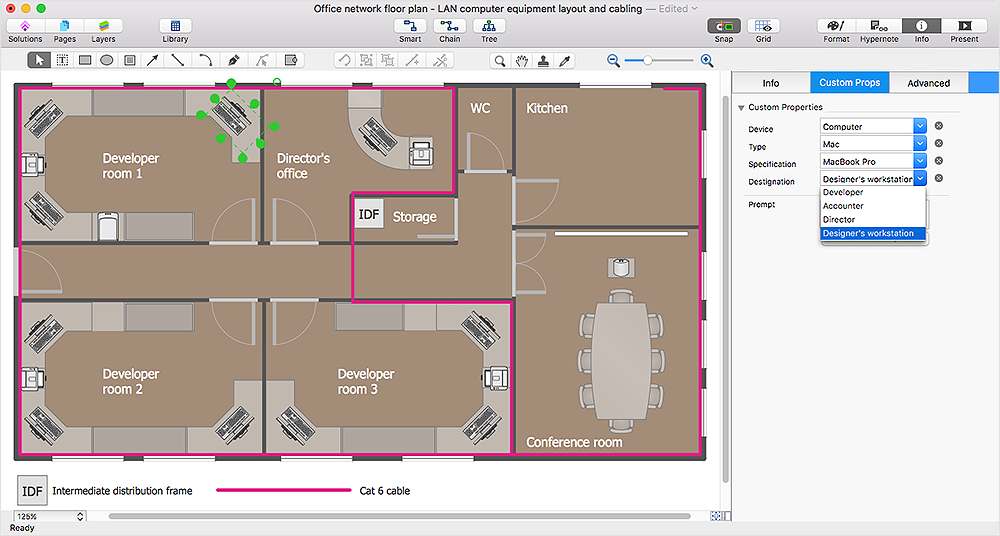
 Computer Network Diagrams
Computer Network Diagrams solution extends ConceptDraw PRO software with samples, templates and libraries of vector icons and objects of computer network devices and network components to help you create professional-looking Computer Network Diagrams, to plan simple home networks and complex computer network configurations for large buildings, to represent their schemes in a comprehensible graphical view, to document computer networks configurations, to depict the interactions between network's components, the used protocols and topologies, to represent physical and logical network structures, to compare visually different topologies and to depict their combinations, to represent in details the network structure with help of schemes, to study and analyze the network configurations, to communicate effectively to engineers, stakeholders and end-users, to track network working and troubleshoot, if necessary.
HelpDesk
How to Draw a Chemical Process Flow Diagram
Process Flow Diagram widely used in modeling of processes in the chemical industry. A Chemical Process Flow diagram (PFD) is a specialized type of flowchart. With the help of Chemical Process Flow Diagram engineers can easily specify the general scheme of the processes and chemical plant equipment. Chemical Process Flow Diagram displays the real scheme of the chemical process, the relationship between the equipment and the technical characteristics of the process. Chemical Process Flow Diagram illustrates the connections between the basic equipment as well as the overall structure of pipelines and other supporting equipment. The purpose of the PFD is to build the image of the basic idea of the chemical process. ConceptDraw PRO together with its Chemical and Process Engineering solution delivers the possibility to design Chemical Process Flow diagrams. It is designed for chemical industry engineers and designers.HelpDesk
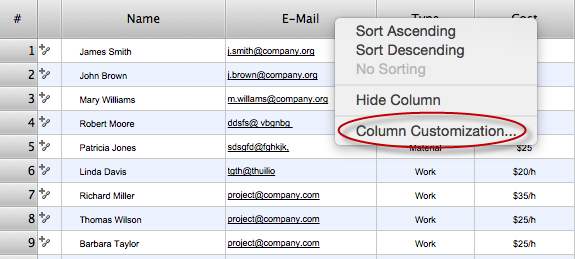
How to Determine what Information to be Displayed in the Project Resource List
After you create a project task list it is necessary move to resource planning. You need to determine and assign resources on each task. There are several types of resources defined in ConceptDraw PROJECT: work, material, cost and equipment. The columns of a project Resource List in ConceptDraw PROJECT displays the information you need to capture about each resource in your project.
HelpDesk
How to Draw a Fishbone Diagram with ConceptDraw PRO
Fishbone (Ishikawa) Diagram is often used in business to determine the cause of some problem. A Fishbone diagram is also called cause-and-effect diagram.The main goal of the Fishbone diagram is to illustrate in a graphical way the relationship between a given outcome and all the factors that influence this outcome. The complete diagram resembles a fish skeleton as its name implies. Cause and Effect analysis is used in management to identify the possible causes of a problem in order to eliminate them. The ability to create a Fishbone Diagram is supported by the Fishbone Diagram solution.- UML Diagram Types List
- UML Diagram Types List | Block diagram - Types of individual ...
- UML Diagram | UML Diagram Types List | UML Business Process ...
- UML Diagram Types List | UML Diagrams with ConceptDraw PRO ...
- UML Notation | UML Diagram Types List | Software and Database ...
- UML Diagram Types List | UML Component Diagram | UML Software
- UML Diagram Types List | UML Diagram | UML Notation | Uml ...
- UML Diagram | UML Diagram Types List | UML Tool & UML Diagram ...
- UML Diagram Types List | Program Evaluation and Review ...
- UML Diagram | UML Diagram Types List | UML for Software ...
- UML Diagram | Design elements - UML interaction overview ...
- UML Diagram Types List | UML Diagram | UML Tool & UML Diagram ...
- UML Diagram Types List | UML Business Process | Pyramid ...
- UML Diagram | UML Diagram Types List | UML Diagrams with ...
- UML Diagram | UML Diagram Types List | UML Block Diagram | Uml ...
- Data Syructure Types With Diagram
- UML Notation | UML Diagram Types List | UML Diagramming ...
- UML Diagram | UML Diagram Types List | Process Flowchart | How ...
- 4 Level pyramid model diagram - Information systems types | 5 Level ...


