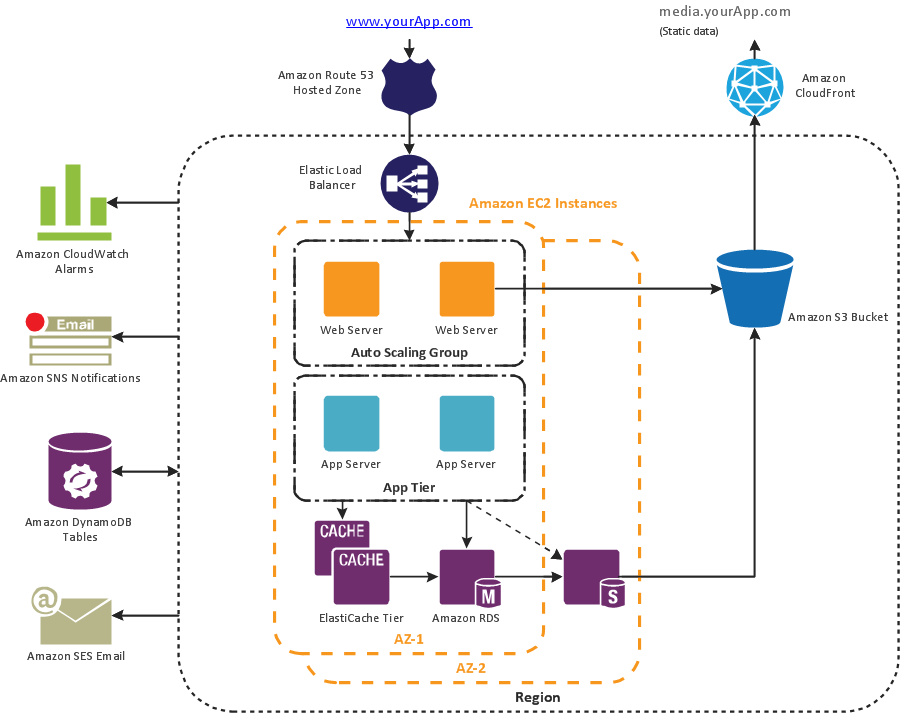
Diagrama de Topologia
PRO is a powerful drawing tool that changes the way diagrams are produced. ConceptDraw Arrows10 Technology - This is more than enough versatility to draw any type of diagram with any degree of complexity. Diagrama de Topologia or Topology Diagram helps you see the big picture as you develop a service.
 Entity-Relationship Diagram (ERD)
Entity-Relationship Diagram (ERD) solution extends ConceptDraw PRO software with templates, samples and libraries of vector stencils from drawing the ER-diagrams by Chen's and crow’s foot notations.
 Telecommunication Network Diagrams
Telecommunication Network Diagrams solution extends ConceptDraw PRO software with samples, templates, and great collection of vector stencils to help the specialists in a field of networks and telecommunications, as well as other users to create Computer systems networking and Telecommunication network diagrams for various fields, to organize the work of call centers, to design the GPRS networks and GPS navigational systems, mobile, satellite and hybrid communication networks, to construct the mobile TV networks and wireless broadband networks.
HelpDesk
How to Create a Timeline Diagram in ConceptDraw PRO
A Timeline is a chart which displays a project plan schedule in chronological order. A Timeline is used in project management to depict project milestones and visualize project phases, and show project progress. The graphic form of a timeline makes it easy to understand critical project milestones, such as the progress of a project schedule. Timelines are particularly useful for project scheduling or project management when accompanied with a Gantt chart. It captures the main of what the project will accomplish and how it will be done. making a project timeline is one of the most important skills a project manager needs have. Making comprehensive, accurate timelines allows you getting every project off in the best way. ConceptDraw PRO allows you to draw a timeline charts using special library."Process Decision Program Chart (PDPC).
A useful way of planning is to break down tasks into a hierarchy, using a tree diagram. The PDPC extends the tree diagram a couple of levels to identify risks and countermeasures for the bottom level tasks. Different shaped boxes are used to highlight risks and identify possible countermeasures (often shown as 'clouds' to indicate their uncertain nature). The PDPC is similar to the Failure Modes and Effects Analysis (FMEA) in that both identify risks, consequences of failure, and contingency actions; the FMEA also rates relative risk levels for each potential failure point." [Seven Management and Planning Tools. Wikipedia]
The Risk diagram (process decision program chart, PDPC) determines the risks when corrective action is not performed correctly. Also, it helps develop descriptions for preventive actions at the level of execution.
The Risk diagram (PDPC) template for the ConceptDraw PRO diagramming and vector drawing software is included in the solution "Seven Management and Planning Tools" from the Management area of ConceptDraw Solution Park.
- ConceptDraw PRO Network Diagram Tool | Diagrama de Topologia ...
- Making Diagrams Has Never Been Easier | Diagrama de Topologia ...
- AWS | Making Diagrams Has Never Been Easier | Diagrama de ...
- Draw A 3 Tier Application Network Diagram
- Www Architecture Diagram
- Entity Relationship Diagram Software for Mac | ER diagram tool for ...
- Diagramming tool - Amazon Web Services and Cloud Computing ...
- Ishikawa Diagram | Business Productivity Diagramming | How to ...
- 3-Tier Auto-scalable Web Application Architecture | 2-Tier Auto ...
- Entity Relationship Diagram - ERD - Software for Design Crows Foot ...
- ER Diagram for Cloud Computing | Diagramming tool - Amazon ...
- Six Markets Model Chart | Leaky bucket diagram | Pyramid Diagram ...
- Local área Network Diagrama
- UML Deployment Diagram Example - ATM System | UML Use Case ...
- Cisco Network Diagrams | Network Diagram Software LAN Network ...
- Venn Diagrams | Venn Diagram | 5-Set Venn diagram - Template ...
- Manufacturing 8 Ms fishbone diagram - Template | Data Flow ...
- Circle Spoke Diagrama Free Vector
- Uml Deployment Diagram
- Manufacturing Pictures Diagram


---template.png--diagram-flowchart-example.png)