Accounting Flowchart Symbols
Accounting is a well known and popular tool used for gaining full quantitative information about the finances. The accounting process includes extensive set of activities that begins with transactions and ends with closing of books. It contains all financial information for a given organization, the data about incomes, expenditures, purchases, sales, return, payroll, and many other numerical information. The excellent possibility to create great-looking Accounting Flowcharts is offered by professional ConceptDraw DIAGRAM diagramming and vector drawing software. It includes the Accounting Flowcharts solution containing wide variety of predesigned accounting flowchart symbols. All symbols are easy recognizable, commonly used, vector and professionally designed, so are capable effectively save your time and efforts when representing all stages of accounting work process, the flow of data in an organization, accounting procedures and processes, documents, tasks, responsible people, users, components and authorizations.Accounting Flowchart: Purchasing, Receiving, Payable and Payment
Accounting flowchart is a system of processes to represent accounting system of an organization. How to create flowcharts for an accounting information system.Purchase Process Flow Chart, Receiving Process Flow Chart, Accounting Flowchart Example.
The purchasing process follows very specific guidelines and includes a purchasing cycle flowchart and receiving process flow chart. Common key elements of purchasing process. It is important to know how purchasing processes work and how each operation is done.
 Accounting Flowcharts
Accounting Flowcharts solution extends ConceptDraw DIAGRAM software with templates, samples and library of vector stencils for drawing the accounting flow charts.
Steps of Accounting Cycle
The steps of accounting cycle include the processes of identifying, collecting, analyzing documents, recording transactions, classifying, summarizing, posting, and preparing trial balance, making journal entries, closing the books and final reporting financial information of an organization. Use the ConceptDraw DIAGRAM with Accounting Flowcharts Solution to create your own professional Accounting Flowcharts of any complexity quick and easy.The vector stencils library "HR professions" contains 81 professions pictograms.
Use this HR icon set to draw your HR flowcharts, workflow diagrams, process charts and infographics with the ConceptDraw PRO diagramming and vector drawing software.
The HR pictograms library "HR professions" is included in the HR Flowcharts solution from the Management area of ConceptDraw Solution Park.
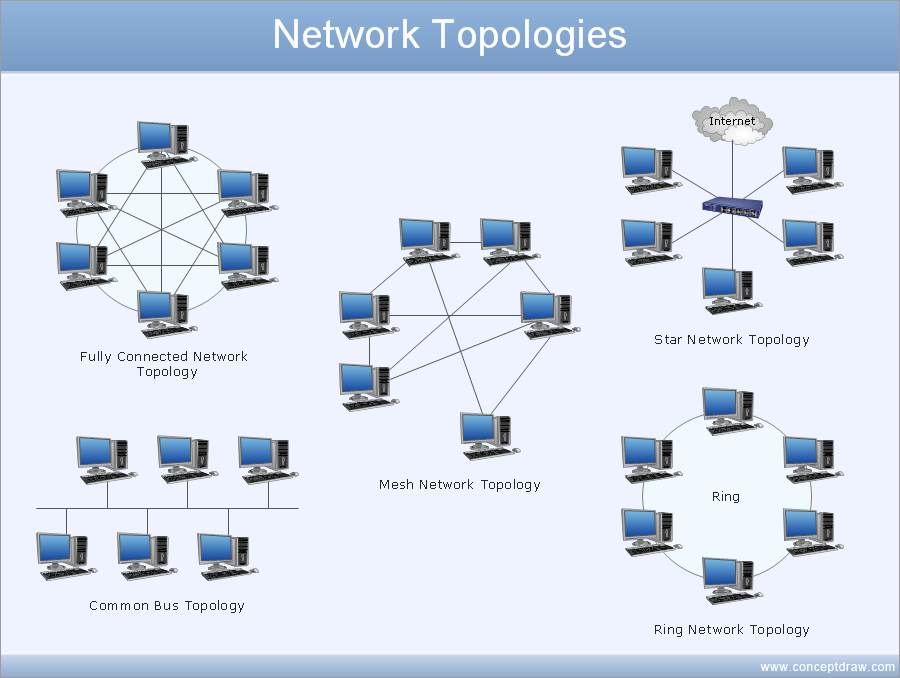
Draw Network Diagram based on Templates and Examples
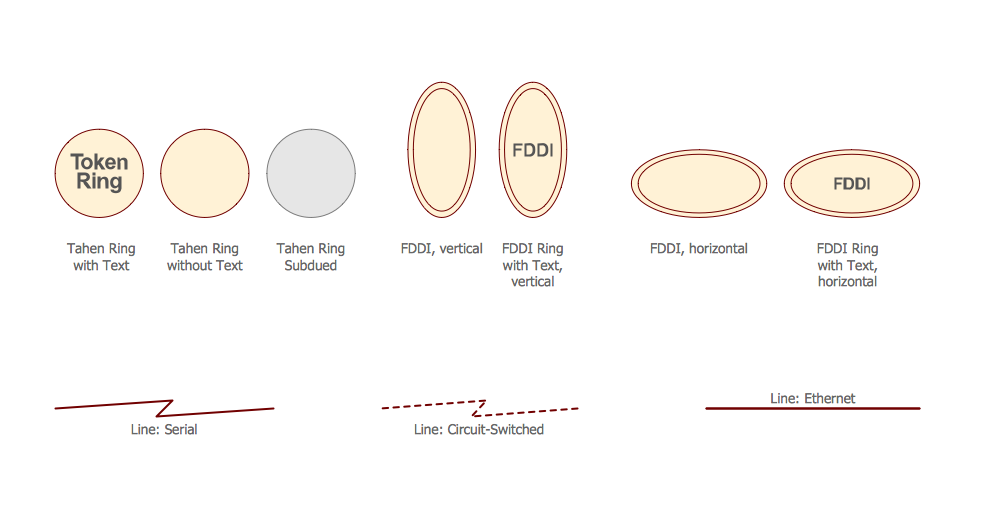
ConceptDraw is rapid and powerful network diagram drawing software with rich examples, templates, design objects and stencils.
Purchasing Flowchart - Purchase Order. Flowchart Examples
Create your own flow charts of purchasing business processes using the ConceptDraw DIAGRAM diagramming and vector drawing software extended with the Accounting Flowcharts solution from the Finance and Accounting area of ConceptDraw Solution Park. The flow chart example shows the steps of purchasing business process.Cisco Media. Cisco icons, shapes, stencils and symbols
The ConceptDraw vector stencils library Cisco Media contains symbols for drawing the computer network diagrams.Local network area. Computer and Network Examples
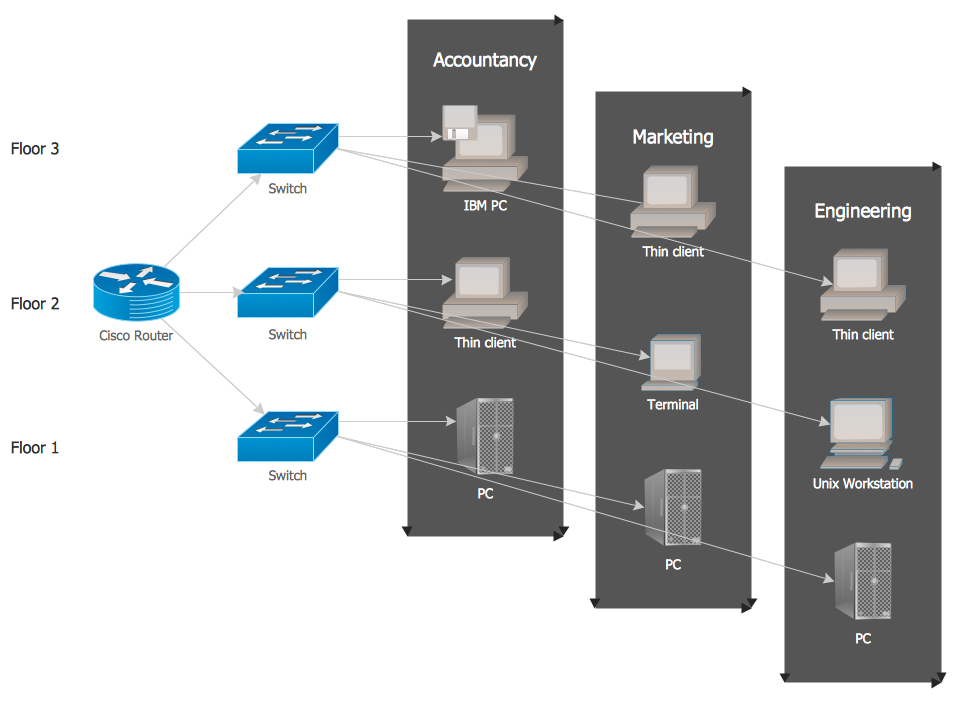
A Local Area Network (LAN) is a computer network that interconnects computers on the limited area such as a home, office building, school, bank, computer laboratory, etc. ConceptDraw DIAGRAM is a powerful network diagramming and vector drawing software. It provides the Computer and Networks Area with many Solutions that contain the wide set ready-to-use predesigned vector stencils and examples to help you design the LANs quick and easy.
The vector stencils library "Professions" contains 58 people clipart images of different professions you can use in your presentations, illustrations and infographics.
"Electronic clip art is available in several different file formats. It is important for clip art users to understand the differences between file formats so that they can use an appropriate image file and get the resolution and detail results they need.
Clip art file formats are divided into 2 different types: bitmap or vector graphics. ...
In contrast to the grid format of bitmap images, Vector graphics file formats use geometric modeling to describe an image as a series of points, lines, curves, and polygons. Because the image is described using geometric data instead of fixed pixels, the image can be scaled to any size while retaining "resolution independence", meaning that the image can be printed at the highest resolution a printer supports, resulting in a clear, crisp image. Vector file formats are usually superior in resolution and ease of editing as compared to bitmap file formats, but are not as widely supported by software and are not well-suited for storing pixel-specific data such as scanned photographs. In the early years of electronic clip art, vector illustrations were limited to simple line art representations." [Clip art. Wikipedia]
The clip art example "Professions - Vector stencils library" was created using the ConceptDraw PRO diagramming and vector drawing software extended with the People solution from the Illustration area of ConceptDraw Solution Park.
www.conceptdraw.com/ solution-park/ illustrations-people
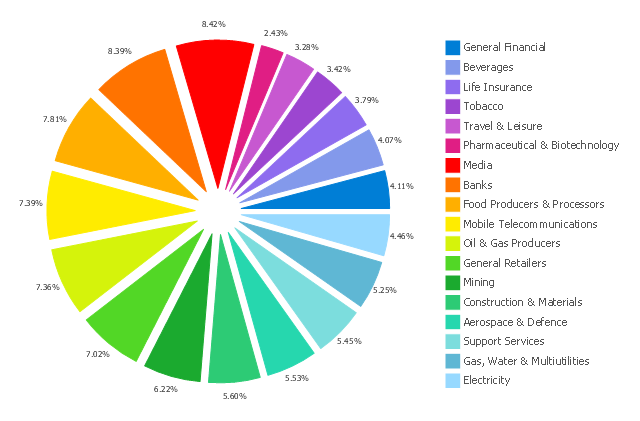
This exploded pie chart sample shows the economic sector weightings. It was designed on the base of the Wikimedia Commons file: Badpie.png [commons.wikimedia.org/ wiki/ File:Badpie.png].
This image is available under the Creative Commons Attribution-ShareAlike 3.0 Unported License [creativecommons.org/ licenses/ by-sa/ 3.0/ ].
"The classical breakdown of all economic sectors follows:
Primary: Involves the retrieval and production of raw materials, such as corn, coal, wood and iron. (A coal miner and a fisherman would be workers in the primary sector.)
Secondary: Involves the transformation of raw or intermediate materials into goods e.g. manufacturing steel into cars, or textiles into clothing. (A builder and a dressmaker would be workers in the secondary sector.)
Tertiary: Involves the supplying of services to consumers and businesses, such as baby-sitting, cinema and banking. (A shopkeeper and an accountant would be workers in the tertiary sector.)
In the 20th century, it began to be argued that traditional tertiary services could be further distinguished from "quaternary" and quinary service sectors." [Economic sector. Wikipedia]
The exploded pie chart example "Economic sector weightings" was created using the ConceptDraw PRO diagramming and vector drawing software extended with the Pie Charts solution of the Graphs and Charts area in ConceptDraw Solution Park.
The vector stencils library "Management pictograms" contains 72 management pictograms.
Use it to create your management infogram in the ConceptDraw PRO diagramming and vector drawing software.
The flat icons example "Management pictograms - Vector stencils library" is included in the solution "Marketing infographics" from the "Business infographics" area of ConceptDraw Solution Park.
Use it to create your management infogram in the ConceptDraw PRO diagramming and vector drawing software.
The flat icons example "Management pictograms - Vector stencils library" is included in the solution "Marketing infographics" from the "Business infographics" area of ConceptDraw Solution Park.
- How Make Bar Diagram In Accountancy
- Block Diagram Of Management Accounting And Financial Accounting
- Interior Design Office Layout Plan Design Element | How To Create ...
- Er Diagram On Firm As An Accountant
- Sample Of Accounting System Using Class Diagram
- Accounting Flowcharts | Accountancy Chart Works
- How to Activate ConceptDraw After Purchasing from the Web Store ...
- Steps of Accounting Cycle | Steps in the Accounting Process | Why ...
- ATM UML Diagrams | Types of Flowchart - Overview | Business ...
- The Sample Diagram Illustrating The Accounting Process
- How to Draw ER Diagrams | Entity Relationship Diagram Examples ...
- Template Of Stores Management Flow Chart
- Steps in the Accounting Process | How to Make an Accounting ...
- Product life cycle graph | Accounting Cycle Example | Water cycle ...
- Steps of Accounting Cycle | What is the Accounting Cycle ...
- Steps in the Accounting Process | How to Create Flowcharts for an ...
- Flow Diagram Of Purchases Transaction Through Accounting Cycle
- Steps in the Accounting Process | How To Do A Mind Map In ...
- Purchasing Flow Chart. Purchasing Flowchart Example | Workflow to ...
- Cycle Diagram Software


