"Dimensions of service quality.
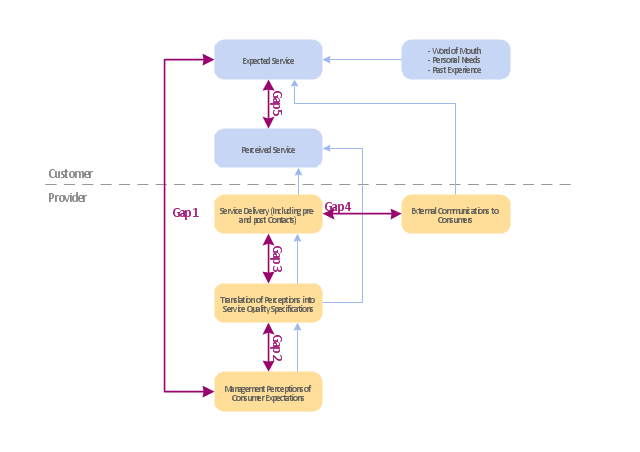
A customer's expectation of a particular service is determined by factors such as recommendations, personal needs and past experiences. The expected service and the perceived service sometimes may not be equal, thus leaving a gap. The service quality model or the ‘GAP model’ developed by a group of authors- Parasuraman, Zeithaml and Berry at Texas and North Carolina in 1985 , highlights the main requirements for delivering high service quality. It identifies five ‘gaps’ that cause unsuccessful delivery. Customers generally have a tendency to compare the service they 'experience' with the service they 'expect' . If the experience does not match the expectation , there arises a gap. Ten determinants that may influence the appearance of a gap were described by Parasuraman, Zeithaml and Berry. in the SERVQUAL model: reliability, responsiveness, competence, access, courtesy, communication, credibility, security, understanding the customer and tangibles.
Later, the determinants were reduced to five: tangibles; reliability; responsiveness; service assurance and empathy in the so called RATER model." [Service quality. Wikipedia]
The block diagram example "Gap model of service quality" was created using the ConceptDraw PRO diagramming and vector drawing software extended with the Block Diagrams solution from the area "What is a Diagram" of ConceptDraw Solution Park.
HelpDesk
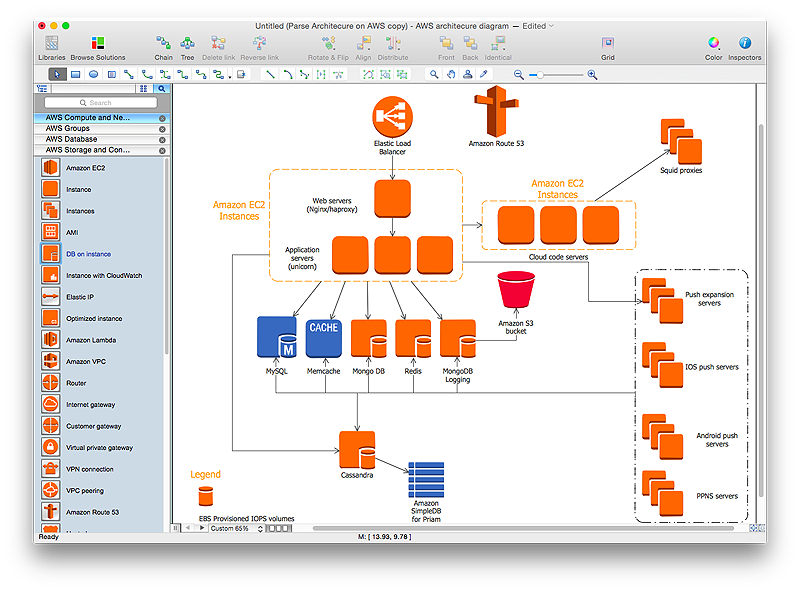
How to Create an AWS Architecture Diagram
Displaying an Amazon Web Service (AWS) cloud actually requires large amounts of attention to detail. Every element of technology has to be addressed: software, middle ware, transaction processing, scaling, data storage; the complete list is staggering. Using the ConceptDraw AWS Architecture Diagrams solution makes much easier the work on documenting the Amazon Web Service architecture. The ConceptDraw AWS Architecture Diagrams solution includes icons, sample and templates for some Amazon Web Services products and resources, to be used when buiding architecture diagrams. The icons are simple so that user can easily incorporate them in his drawings. AWS Architecture Diagrams can be used in presentations, datasheets, or any other technical visualizations.
 Workflow Diagrams
Workflow Diagrams solution extends ConceptDraw PRO software with samples, templates and vector stencils library for drawing the work process flowcharts.
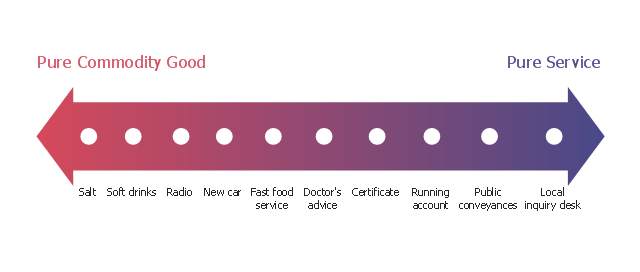
"The dichotomy between physical goods and intangible services is an oversimplification; these are not discrete categories. Most business theorists see a continuum with pure service at one endpoint and pure commodity goods at the other endpoint. Most products fall between these two extremes. Goods are normally structural and can be transferred in an instant while services are delivered over a period of time. Goods can be returned while a service once delivered cannot. Goods are not always tangible and may be virtual." [Goods and services. Wikipedia]
The example "Service-goods continuum diagram" was created using the ConceptDraw PRO diagramming and vector drawing software extended with the Marketing Diagrams solution from the Marketing area of ConceptDraw Solution Park.
The example "Service-goods continuum diagram" was created using the ConceptDraw PRO diagramming and vector drawing software extended with the Marketing Diagrams solution from the Marketing area of ConceptDraw Solution Park.
This interactive voice response (IVR) diagram sample illustrates how ENUM call forwarding can be achieved. It was designed on the base of the Wikimedia Commons file: Call Forwarding with ENUM.jpg. [commons.wikimedia.org/ wiki/ File:Call_ Forwarding_ with_ ENUM.jpg]
"Telephone number mapping is a system of unifying the international telephone number system of the public switched telephone network with the Internet addressing and identification name spaces. Internationally, telephone numbers are systematically organized by the E.164 standard, while the Internet uses the Domain Name System (DNS) for linking domain names to IP addresses and other resource information. Telephone number mapping systems provide facilities to determine applicable Internet communications servers responsible for servicing a given telephone number using DNS queries.
The most prominent facility for telephone number mapping is the E.164 Number Mapping (ENUM) standard. It uses special DNS record types to translate a telephone number into a Uniform Resource Identifier (URI) or IP address that can be used in Internet communications." [Telephone number mapping. Wikipedia]
The IVR diagram example "Call Forwarding with ENUM" was designed using ConceptDraw PRO diagramming and vector drawing software extended with the Interactive Voice Response Diagrams solution from the Computer and Networks area of ConceptDraw Solution Park.
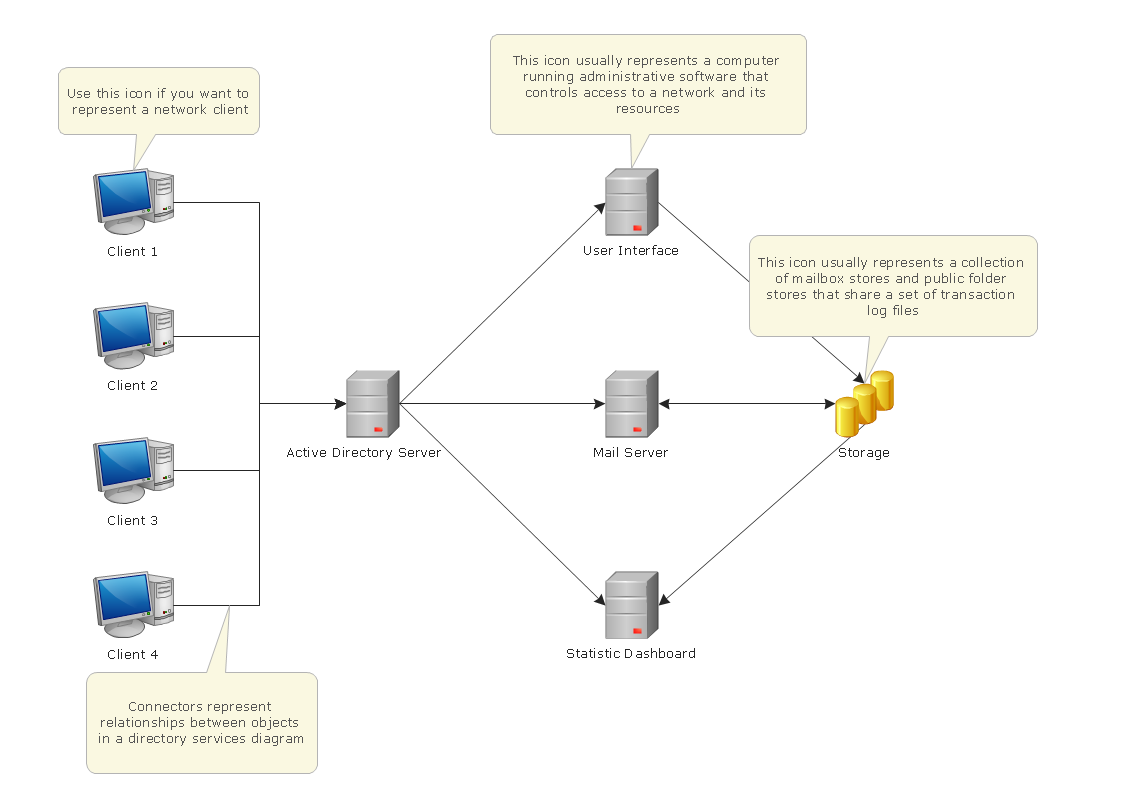
Active Directory Domain Services
Active Directory Diagrams visualize the detailed structures of the Microsoft Windows networks, Active Directory Domain topology, the Active Directory Site topology, the Organizational Units (OU), and the Exchange Server Organization.- Workflow Diagram For Service
- Service -goods continuum diagram | Marketing Diagrams | Pyramid ...
- Block diagram - Gap model of service quality | Block Diagram ...
- Service -goods continuum diagram | Pyramid Chart Examples ...
- Block diagram - Gap model of service quality | Service -goods ...
- Data Flow Diagram Model | Taxi Service Data Flow Diagram DFD ...
- Fishbone Diagram | Fishbone Diagrams | Service 8 Ps fishbone ...
- Diagram Of Service Process
- Service 8 Ps fishbone diagram - Template | Fishbone Diagram ...
- Manufacturing 8 Ms fishbone diagram - Template
- Service -goods continuum diagram | Marketing diagrams - Vector ...
- Using Fishbone Diagrams for Problem Solving | Cause and Effect ...
- Block Diagrams
- How To create Diagrams for Amazon Web Services architecture ...
- Web Service Diagram
- Taxi Service Data Flow Diagram DFD Example | UML Use Case ...
- UML Diagram | Computer Network Diagrams | AWS Architecture ...
- Service Process Diagram
- Workflow Process Example | Workflow Diagrams | Workflow ...
- UML Use Case Diagram Example - Taxi Service | Business Process ...


