Example of DFD for Online Store (Data Flow Diagram)
Data Flow Diagram (DFD) is a methodology of graphical structural analysis and information systems design, which describes the sources external in respect to the system, recipients of data, logical functions, data flows and data stores that are accessed. DFDs allow to identify relationships between various system's components and are effectively used in business analysis and information systems analysis. They are useful for system’s high-level details modeling, to show how the input data are transformed to output results via the sequence of functional transformations. For description of DFD diagrams are uses two notations — Yourdon and Gane-Sarson, which differ in syntax. Online Store DFD example illustrates the Data Flow Diagram for online store, the interactions between Customers, Visitors, Sellers, depicts User databases and the flows of Website Information. ConceptDraw DIAGRAM enhanced with Data Flow Diagrams solution lets you to draw clear and simple example of DFD for Online Store using special libraries of predesigned DFD symbols.
 Stakeholder Onion Diagrams
The Stakeholder Onion Diagram is often used as a way to view the relationships of stakeholders to a project goal. A basic Onion Diagram contains a rich information. It shows significance of stakeholders that will have has influence to the success achieve
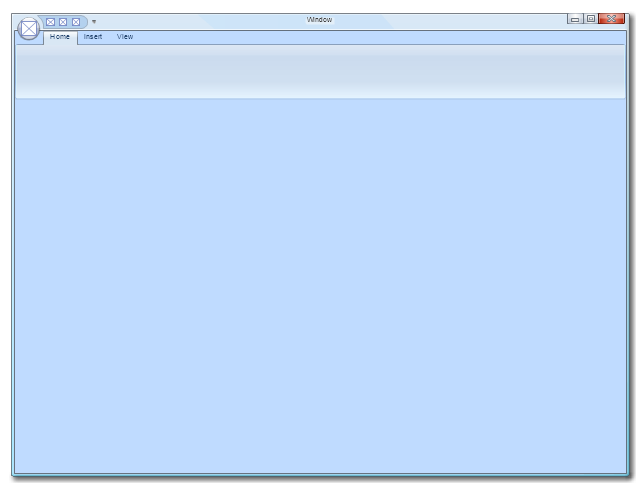
The vector stencils library "Ribbon interface" contains 41 ribbon shapes.
Use it for designing Microsoft ribbon graphic user interface (GUI) of software for Windows computers in the ConceptDraw PRO diagramming and vector drawing software extended with the Graphic User Interface solution from the Software Development area of ConceptDraw Solution Park.
Use it for designing Microsoft ribbon graphic user interface (GUI) of software for Windows computers in the ConceptDraw PRO diagramming and vector drawing software extended with the Graphic User Interface solution from the Software Development area of ConceptDraw Solution Park.
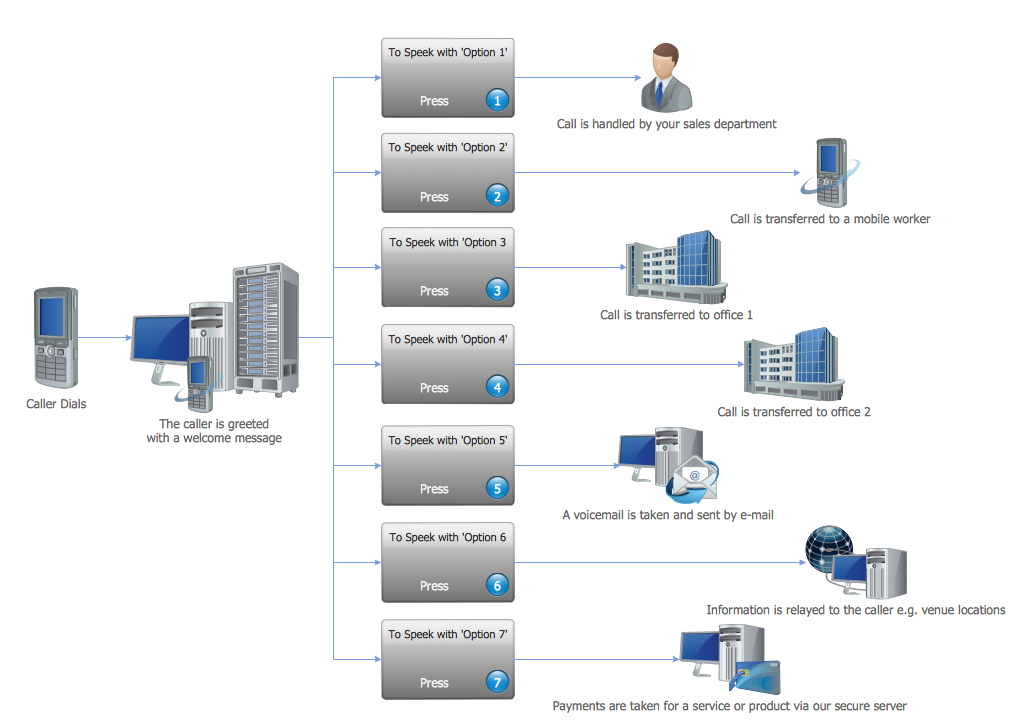
IVR
ConceptDraw DIAGRAM is a powerful diagramming and vector drawing software. Now, supplied with Interactive Voice Response Diagrams solution from the Computer and Networks area, ConceptDraw DIAGRAM became ideal for construction the IVR diagrams.Stakeholder Onion Diagrams
The Stakeholder Onion Diagram is a popular and widely used way to view the relationships of stakeholders to a project goal. The Onion Diagram focuses on the project goal, most of other diagram styles focus on the project, stakeholders, and timeline. This difference favorably distinguishes and separates the Onion Diagram from other types of diagrams. Design fast and easy Stakeholder Onion Diagrams of any complexity in ConceptDraw DIAGRAM diagramming and vector drawing software using the powerful tools of Stakeholder Onion Diagrams Solution from the Management Area of ConceptDraw Solution Park.Product Overview
ConceptDraw PROJECT is a vigorous tool for managing single or multiple projects. It lets you determine all essential elements involved into project, control schedules, resources and finances, and monitor projects' progress in most effective yet simple manner.- Error Dialogue Icon Stencil
- Minimize Button Rectangle Down Arrow Png Icon
- Close Icon Windows
- Ms Warning Icon
- Vertical Separator Icon Png
- Glyph icons - Vector stencils library | Ribbon interface - Vector ...
- Glyph icons - Vector stencils library | IDEF0 Flowchart Symbols ...
- Window Close And Minimize Icon Vector
- Ivr Menu Options Icon
- Controls - Vector stencils library
- Window elements - Vector stencils library | Mac OS X Lion buttons ...
- Telephone Ip Icon
- Ribbon interface - Vector stencils library | Wireframe - Vector stencils ...
- Recognition Icon
- Scroll Bar Icon Png Grey
- Drop Down Menu Icon Png After
- Menu Close Icons
- Interactive Voice Response Diagrams
- Item List With Icon
- Ribbon interface - Vector stencils library | Toolbar control elements ...





-ribbon-interface---vector-stencils-library.png--diagram-flowchart-example.png)





-ribbon-interface---vector-stencils-library.png--diagram-flowchart-example.png)
-ribbon-interface---vector-stencils-library.png--diagram-flowchart-example.png)
-ribbon-interface---vector-stencils-library.png--diagram-flowchart-example.png)


