Process Flowchart
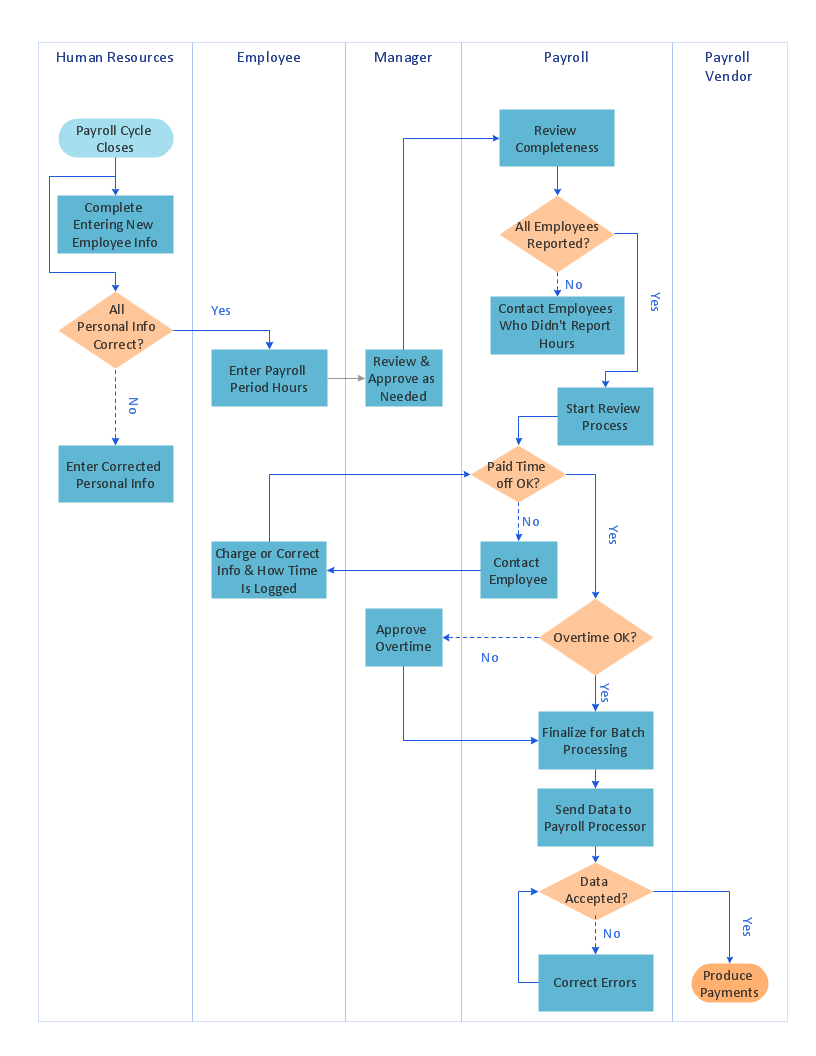
The main reason of using Process Flowchart or PFD is to show relations between major parts of the system. Process Flowcharts are used in process engineering and chemical industry where there is a requirement of depicting relationships between major components only and not include minor parts. Process Flowcharts for single unit or multiple units differ in their structure and implementation. ConceptDraw PRO is Professional business process mapping software for making Process flowcharts, Process flow diagram, Workflow diagram, flowcharts and technical illustrations for business documents and also comprehensive visio for mac application. Easier define and document basic work and data flows, financial, production and quality management processes to increase efficiency of your business with ConcepDraw PRO. Business process mapping software with Flowchart Maker ConceptDraw PRO includes extensive drawing tools, rich examples and templates, process flowchart symbols and shape libraries, smart connectors that allow you create the flowcharts of complex processes, process flow diagrams, procedures and information exchange. Process Flowchart Solution is project management workflow tools which is part ConceptDraw Project marketing project management software. Drawing charts, diagrams, and network layouts has long been the monopoly of Microsoft Visio, making Mac users to struggle when needing such visio alternative like visio for mac, it requires only to view features, make a minor edit to, or print a diagram or chart. Thankfully to MS Visio alternative like ConceptDraw PRO software, this is cross-platform charting and business process management tool, now visio alternative for making sort of visio diagram is not a problem anymore however many people still name it business process visio tools.
Basic Flowchart Symbols and Meaning
Flowcharts are the best for visually representation the business processes and the flow of a custom-order process through various departments within an organization. ConceptDraw PRO diagramming and vector drawing software extended with Flowcharts solution offers the full set of predesigned basic flowchart symbols which are gathered at two libraries: Flowchart and Flowcharts Rapid Draw. Among them are: process, terminator, decision, data, document, display, manual loop, and many other specific symbols. The meaning for each symbol offered by ConceptDraw gives the presentation about their proposed use in professional Flowcharts for business and technical processes, software algorithms, well-developed structures of web sites, Workflow diagrams, Process flow diagram and correlation in developing on-line instructional projects or business process system. Use of ready flow chart symbols in diagrams is incredibly useful - you need simply drag desired from the libraries to your document and arrange them in required order. There are a few serious alternatives to Visio for Mac, one of them is ConceptDraw PRO. It is one of the main contender with the most similar features and capabilities.
 Value Stream Mapping
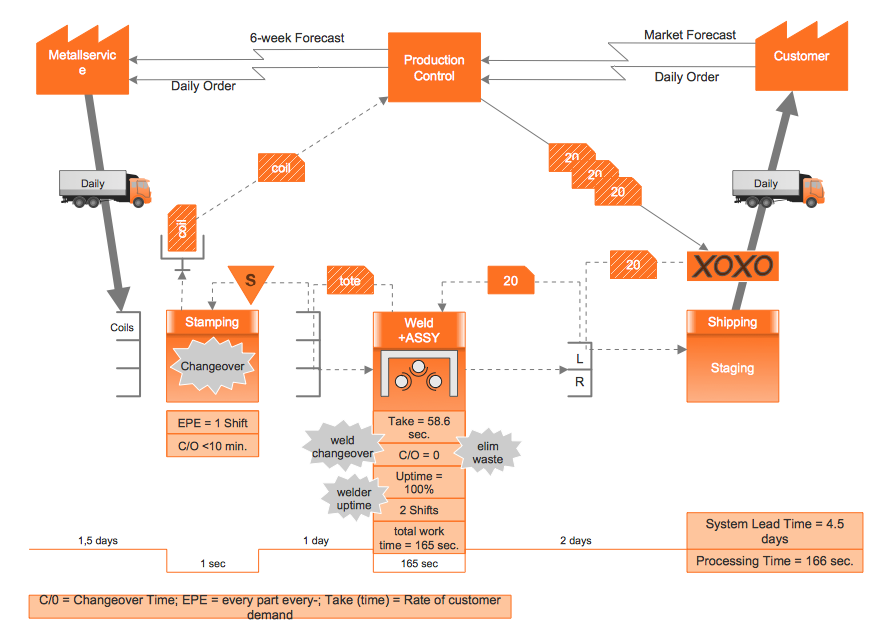
Value stream mapping solution extends ConceptDraw PRO software with templates, samples and vector stencils for drawing the Value Stream Maps (VSM) in lean manufacturing practice.
ConceptDraw Arrows10 Technology
Connecting objects manually in ConceptDraw PRO is a snap: - points; - Connecting groups of objects; - Auto-routing; - Connectors text; - Snap to Guides ; - Quick.How to Dramatically Reduce Drawing Time - New connection modes
The innovative ConceptDraw Arrows10 Technology included in ConceptDraw PRO is a powerful drawing tool that changes the way diagrams are produced. While making the drawing process easier and faster. This is more than enough versatility to draw any type of diagram with any degree of complexity.Cross-Functional Flowchart
Use of Cross-Functional Flowchart is a clear way of showing each team member’s responsibilities and how processes get shared or transferred between different responsible people, teams and departments. Use the best flowchart maker ConceptDraw PRO with a range of standardized cross-functional flowchart symbols to create the Cross-Functional Flowcharts simply and to visualize the relationship between a business process and the functional units responsible for that process. To draw the most quickly Cross-Functional Flowcharts, Cross Functional Process Maps, or Cross Functional Process Flow Diagrams, start with a Cross-functional flowchart samples and templates from ConceptDraw Solution Park. The ConceptDraw Arrows10 and RapidDraw technologies will be also useful for you in drawing. ConceptDraw PRO supports designing both types - horizontal and vertical Cross-functional flowcharts. A vertical layout makes the accents mainly on the functional units while a horizontal layout - on the process. If you need a Visio alternative in Mac OS X, try ConceptDraw PRO. Its interface is very intuitive and it’s actually much easier to use than Visio, yet somehow it’s just as powerful if not more so. ConceptDraw PRO performs professional quality work and seamless Visio interaction.
Cross-Functional Process Map Template
When you need a drawing software to create a professional looking cross-functional charts, ConceptDraw with its Arrows10 Technology - is more than enough versatility to draw any type of diagram with any degree of complexity. Use templates with process maps, diagrams, charts to get the drawing in minutes.HelpDesk
How to Create a VSM Diagram Using ConceptDraw Value Stream Mapping Solution
Value Stream Mapping is a Lean Manufacturing tool that uses a flow diagram to document in great detail every step of a manufacturing process. This graphical representation of a process is a powerful tool that helps in the diagnosis of process efficiency and allows companies to develop improved processes. Many lean practitioners use Value Stream Mapping as a fundamental tool to identify waste, cut process cycle times, and implement process improvement. Many organizations use value stream mapping as a key portion of their lean efforts. Value Stream Maps are used to analyze and design the flow of materials and information required to bring a product or service to a consumer. You can create a Value Stream Mapping flowchart using ConceptDraw PRO tools.ERD Symbols and Meanings
Entity Relationship Diagram (ERD) is a popular software engineering tool for database modeling and illustration the logical structure of databases, which uses one of two notations - Chen's or Crow’s Foot. Crow's foot notation is effective when used in software engineering, information engineering, structured systems analysis and design. Each of these notations applies its own set of ERD symbols. Crow's foot diagrams use boxes to represent entities and lines between these boxes to show relationships. Varied shapes at the ends of lines depict the cardinality of a given relationship. Chen's ERD notation is more detailed way to represent entities and relationships. ConceptDraw PRO application enhanced with all-inclusive Entity-Relationship Diagram (ERD) solution allows design professional ER diagrams with Chen's or Crow’s Foot notation on your choice. It contains the full set of ready-to-use standardized ERD symbols and meanings helpful for quickly drawing, collection of predesigned ERD samples, examples and templates. ConceptDraw Pro is a great alternative to Visio for Mac users as it offers more features and can easily handle the most demanding professional needs.
Diagrama de Topologia
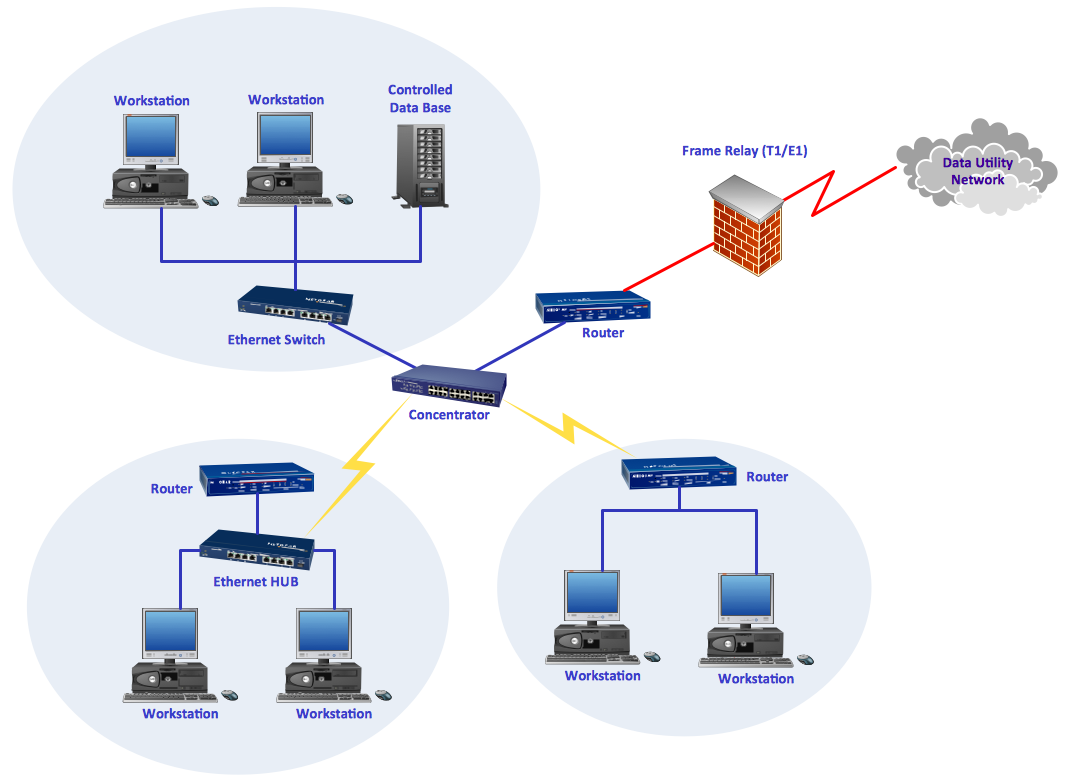
PRO is a powerful drawing tool that changes the way diagrams are produced. ConceptDraw Arrows10 Technology - This is more than enough versatility to draw any type of diagram with any degree of complexity. Diagrama de Topologia or Topology Diagram helps you see the big picture as you develop a service.ConceptDraw PRO Network Diagram Tool
Computer network diagrams visually depict the nodes of computer networks and connections between them. Diversity of Network Diagrams includes Wireless network diagrams, Network wiring diagrams, LAN network diagrams, Network WAN diagrams, Network topology diagrams, Network cable diagrams, Logical network diagrams, Network security diagrams, Diagram home network, Network physical diagrams, Activity network diagrams, and many others. To construct any of them it is useful to apply a special software with effective network diagramming tools. ConceptDraw PRO is ideal and powerful network diagram tool. It helps you diagram a network or create Computer network diagrams of various types using specialized and task-specific libraries of network components such as computers, hubs, switches, servers, routers, smart connectors, printers, mainframes, face plates, etc. that simulate network architectures, network design topologies and devices (all these shapes are parts of network diagram tool ConceptDraw PRO).
 Cross-Functional Flowcharts
Cross-functional flowcharts are powerful and useful tool for visualizing and analyzing complex business processes which requires involvement of multiple people, teams or even departments. They let clearly represent a sequence of the process steps, the order of operations, relationships between processes and responsible functional units (such as departments or positions).
HelpDesk
How to Resize Objects
When creating diagram using ConceptDraw PRO, you can select, move, resize and rotate objects. After selecting an object (or objects) in a document, you can change it position, resize it or move an object to the desired position. The sizes of objects in ConceptDraw PRO can be changed by simple dragging, or you can set a particular size of any object. Using ConceptDraw PRO, you can re-size an object on the page using the absolute measurements instead of a mouse. You can make quick work of designing complex drawing using a combination of different-sized items.Best Value Stream Mapping mac Software
Create value stream maps - for value stream analysis and value stream management, material and information flow mapping, using our quick start templates included with ConceptDraw.
 Continent Maps
Continent Maps solution extends ConceptDraw PRO software with templates, samples and libraries of vector stencils for drawing the thematic maps of continents, state maps of USA and Australia.
- Design elements - Value stream mapping diagram | Standard ...
- Swim Lane Diagrams | Cross-Functional Flowchart (Swim Lanes ...
- Value Stream Mapping Symbols | Design elements - Value stream ...
- Payroll process - Swim lane process mapping diagram | Cross ...
- Process Mapping Template Free Download Mac
- Value Stream Mapping | Lean Manufacturing Diagrams | Design ...
- Cross-Functional Flowchart (Swim Lanes) | Payroll process - Swim ...
- Payroll process - Swim lane process mapping diagram | Business ...
- Cross-Functional Flowchart (Swim Lanes) | Payroll process - Swim ...
- Sample Process Mapping Diagram
- Functional Application Mapping Diagram
- Cross-Functional Flowchart (Swim Lanes) | Payroll process - Swim ...
- Value Stream Mapping Symbols | Design elements - Value stream ...
- Value Process Mapping
- Process Flowchart | Payroll process - Swim lane process mapping ...
- Value stream mapping diagram | Business diagrams & Org Charts ...
- Value Stream Maps Visualize
- Payroll process - Swim lane process mapping diagram | Cross ...
- Work Order Process Flowchart. Business Process Mapping ...


