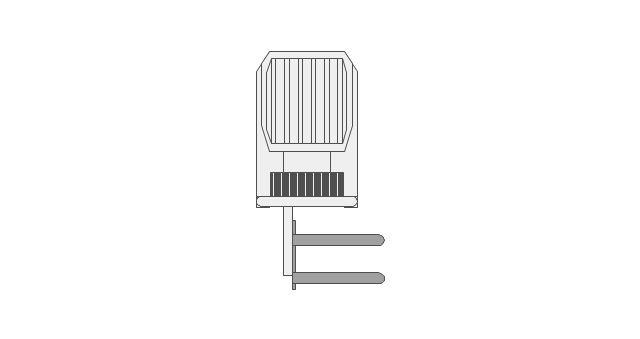
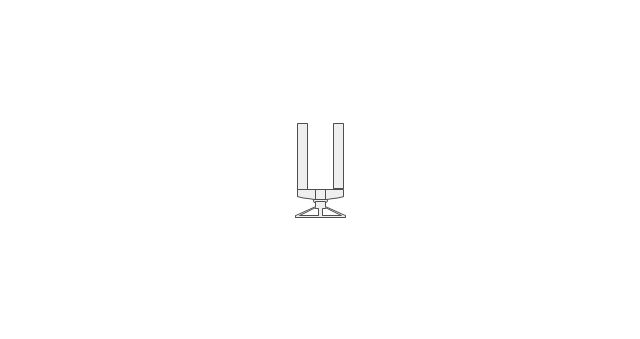
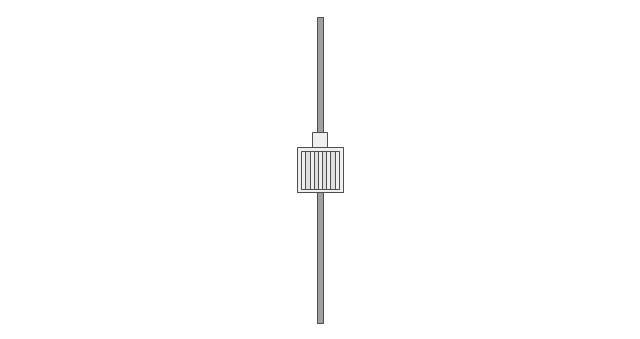
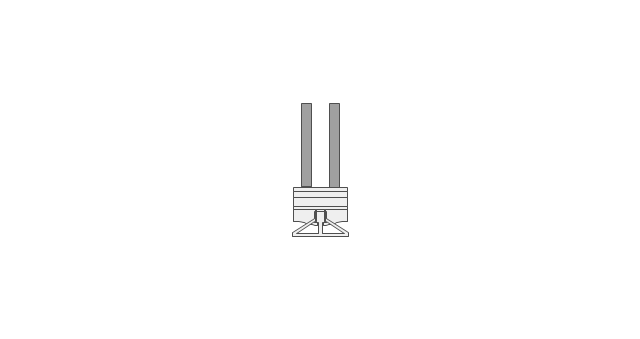
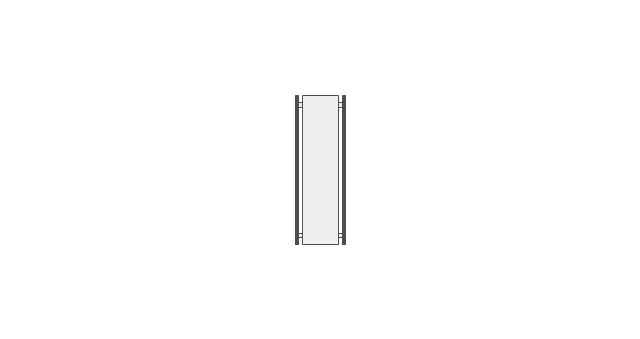
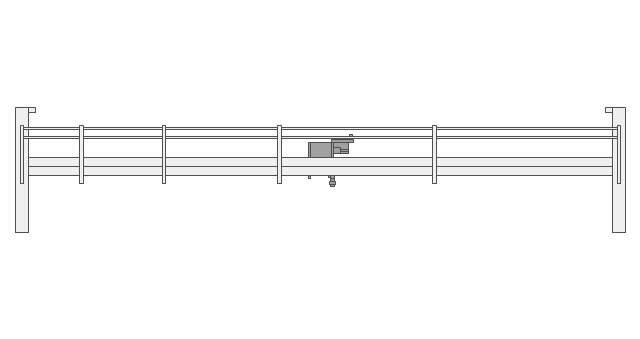
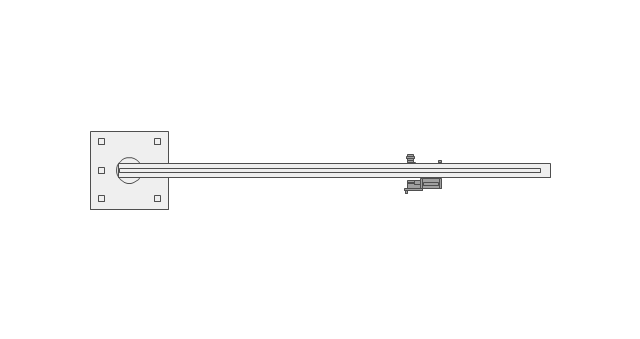
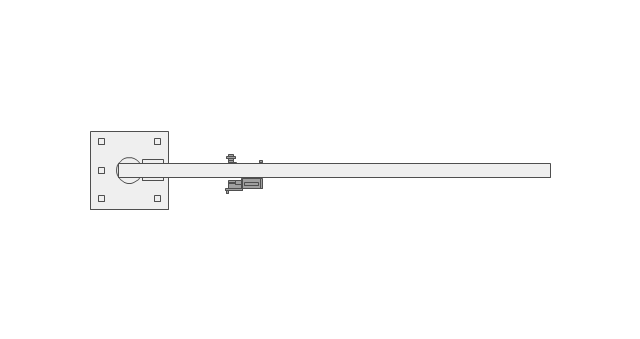
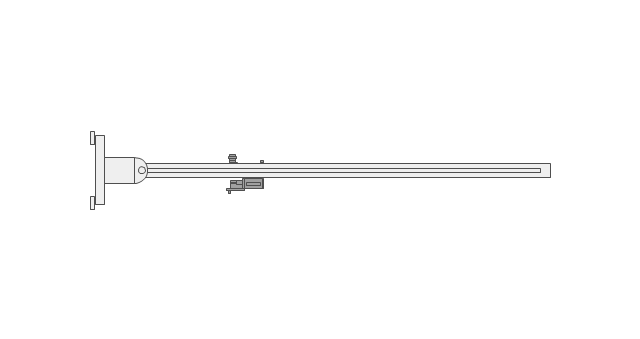
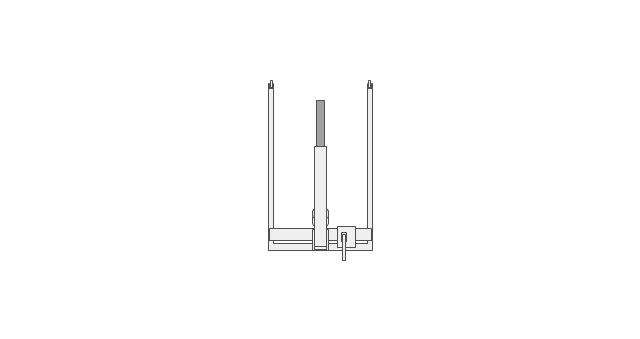
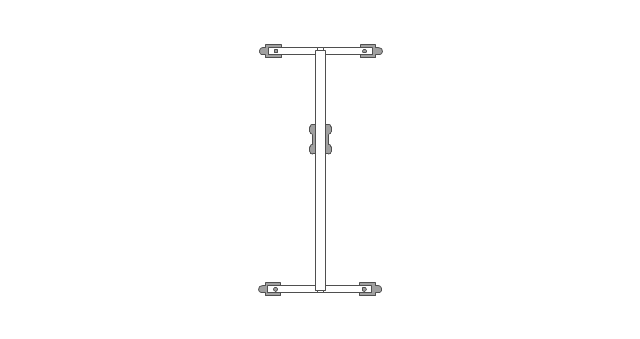
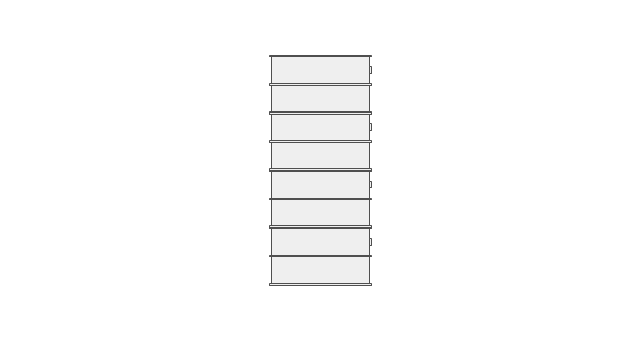
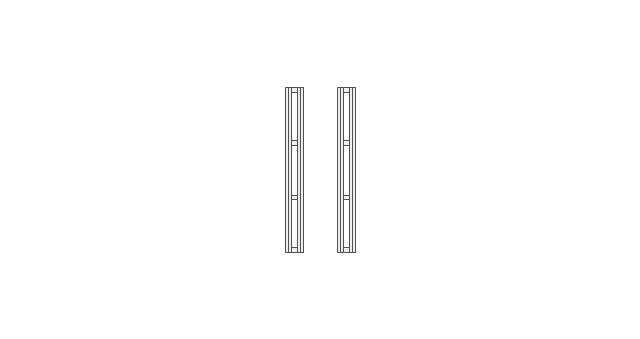
Interior Design. Storage and Distribution — Design Elements
Successful and comfy interior design has a great value for the premises of any kinds, for home, flats, offices, stores, and even for warehouses, industrial spaces, factories and plants. Development and professional representing of interior design projects is an interesting and exciting process, but quite difficult at the same time. Interior designer must clearly respect and take into account all wishes and requirements of the customer. But the use of special design software can greatly help in interior design. ConceptDraw DIAGRAM diagramming and vector drawing software extended with Plant Layout Plans solution includes the Storage and Distribution library with large quantity of vector design symbols and elements of storage and distribution industrial equipment, of forklifts, cranes, pallets, shelves, and racks of any kinds. They provide effective assistance in design various types of plant interior designs, plant interior design floor plans, industrial warehouse plans, storage and distribution industrial equipment layouts for the premises of any magnitude and destiny.
 Frequency Distribution Dashboard
Frequency distribution dashboard solution extends ConceptDraw DIAGRAM software with samples, templates and vector stencils libraries with histograms and area charts for drawing the visual dashboards showing frequency distribution of data.
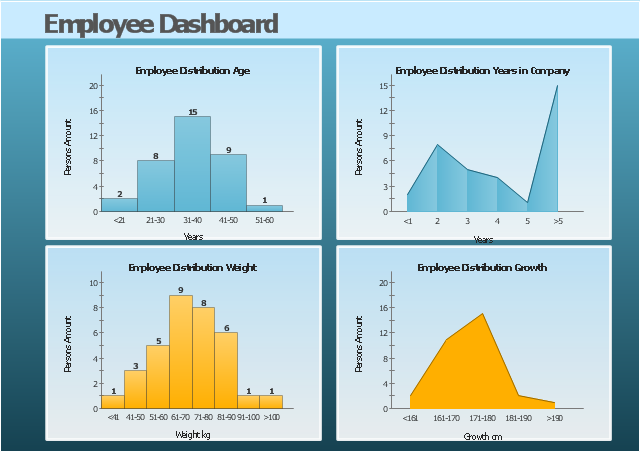
This HR dashboard example include histograms "Employee Distribution by Age" and "Employee Distribution by Weight", and area charts "Employee Distribution by Years in Company" and "Employee Distribution by Growth".
"Human resource management (HRM, or simply HR) is the management process of an organization's workforce, or human resources. It is responsible for the attraction, selection, training, assessment, and rewarding of employees, while also overseeing organizational leadership and culture and ensuring compliance with employment and labor laws. In circumstances where employees desire and are legally authorized to hold a collective bargaining agreement, HR will also serve as the company's primary liaison with the employees' representatives (usually a trades union)." [Human resource management. Wikipedia]
The example "Employee dashboard" was created using the ConceptDraw PRO diagramming and vector drawing software extended with the Frequency Distribution Dashboard solution from the area "What is a Dashboard" of ConceptDraw Solution Park.
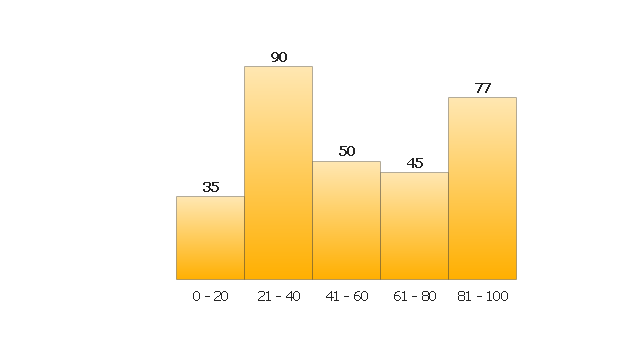
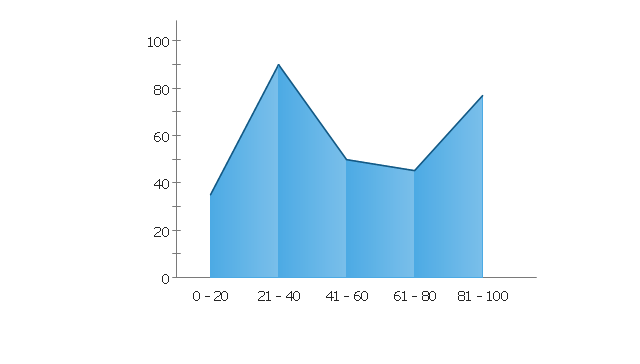
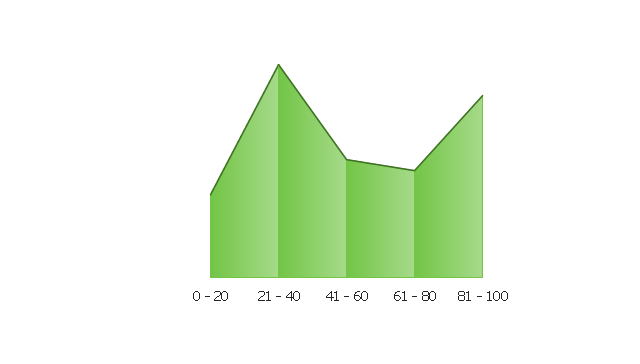
The vector stencils library "Frequency distribution charts" contains 2 area chart templates and 2 histogram templates.
Frequency distribution charts are Live Objects which show the distribution of items within numerical ranges.
Use this library for drawing visual dashboards in the ConceptDraw PRO diagramming and vector drawing software extended with the Frequency Distribution Dashboard solution from the area "What is a Dashboard" of ConceptDraw Solution Park.
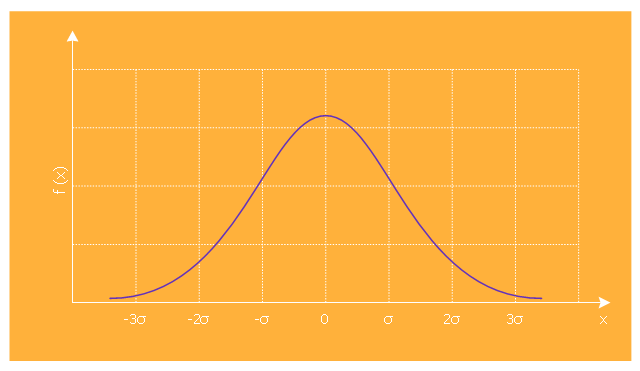
This is normal distribution graph template.
Use it to design your normal distribution graphs with ConceptDraw PRO software.
Normal (or Gaussian) distribution (bell curve) graph visualizes a continuous probability distribution that is often used as a first approximation to describe real-valued random variables that tend to cluster around a single mean value.
The marketing chart template "Normal distribution graph" is included in the Marketing Diagrams solution from the Marketing area of ConceptDraw Solution Park.
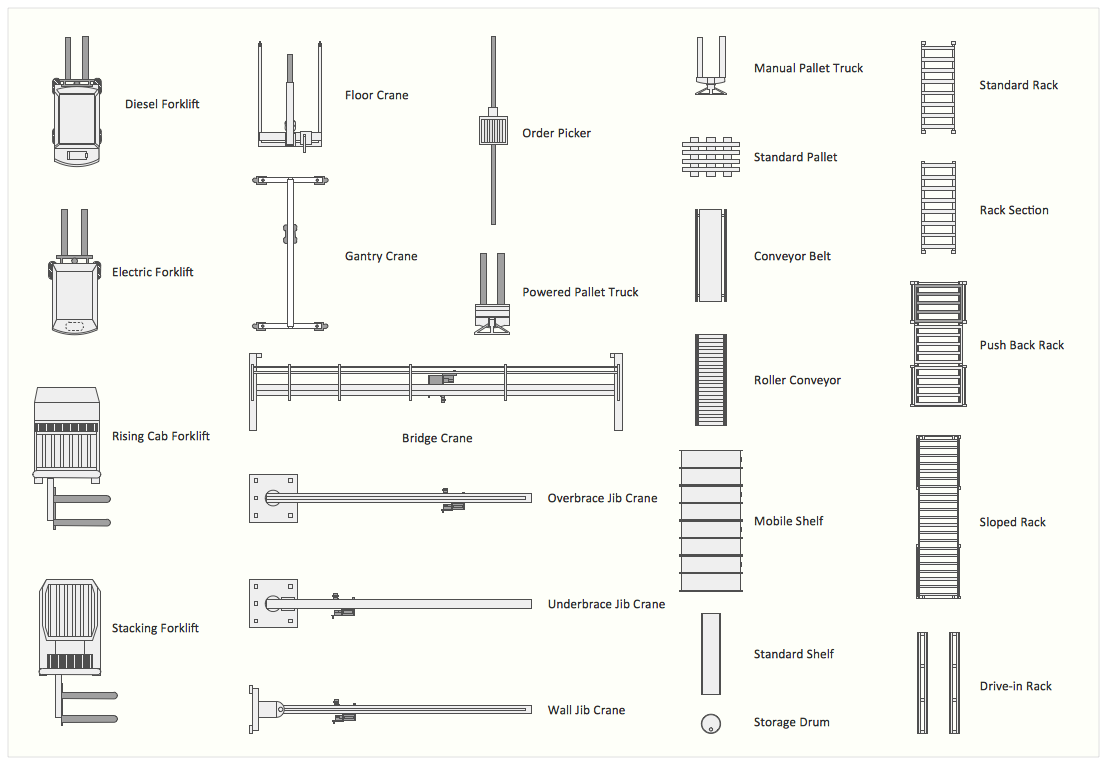
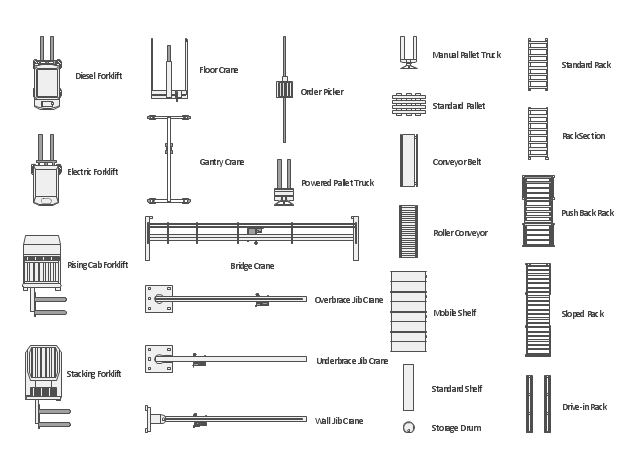
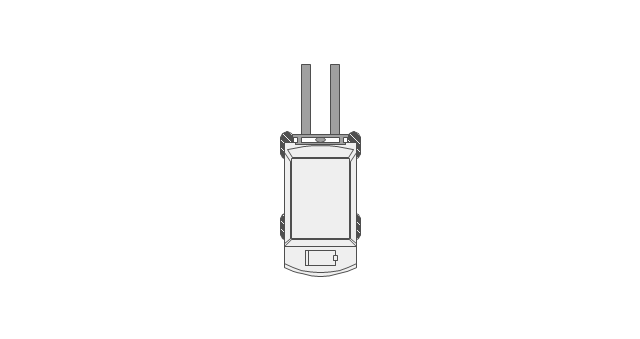
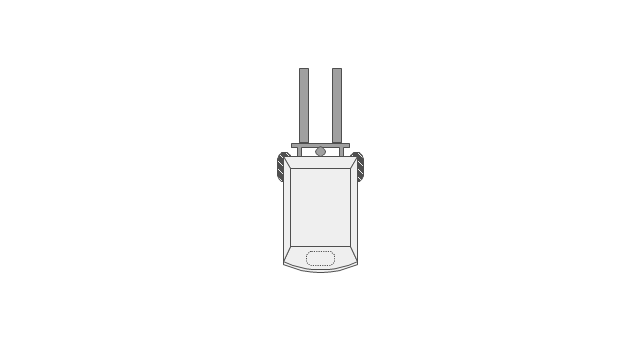
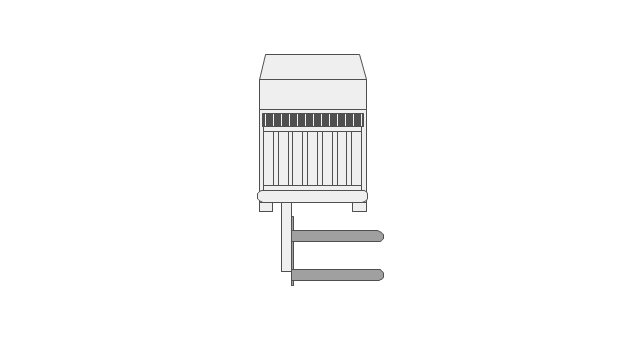
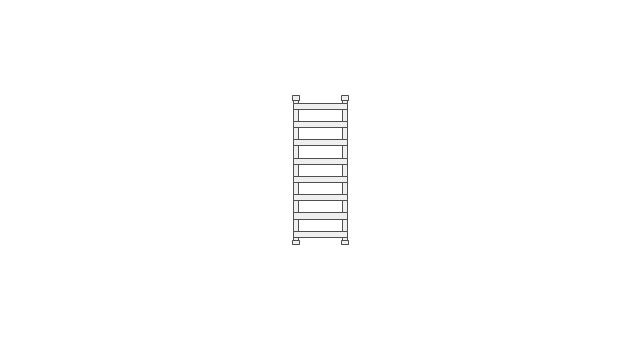
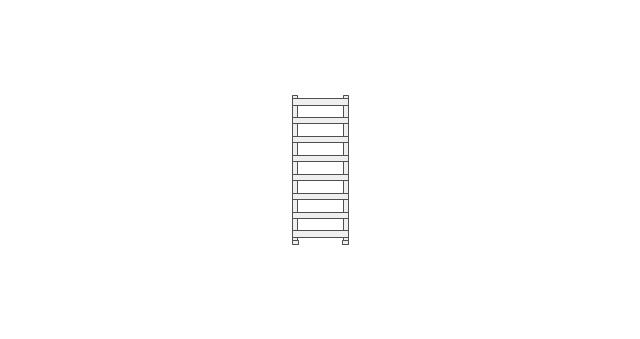
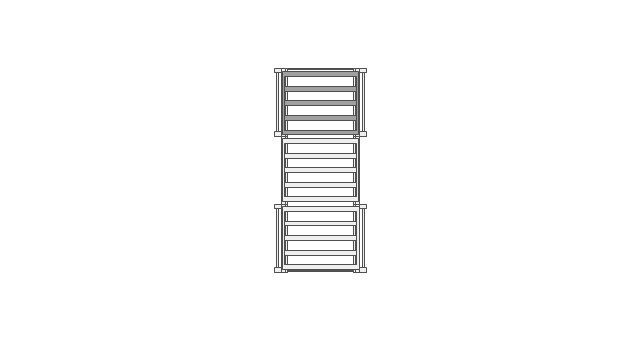
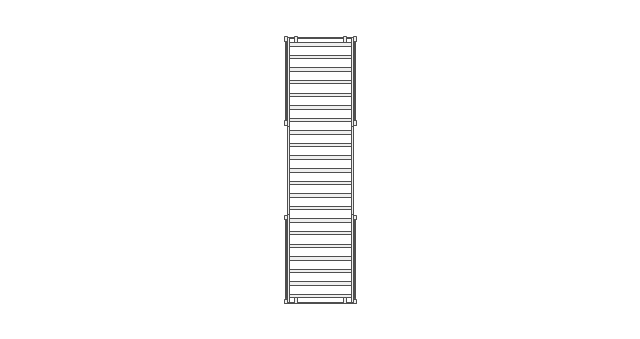
The vector stencils library "Storage and distribution" contains 24 symbols of storage and distribution industrial equipment.
Use the design elements library "Storage and distribution" to draw industrial warehouse plans and storage and distribution equipment layouts using the ConceptDraw PRO diagramming and vector drawing software.
"A warehouse is a commercial building for storage of goods. Warehouses are used by manufacturers, importers, exporters, wholesalers, transport businesses, customs, etc. They are usually large plain buildings in industrial areas of cities and towns and villages. They usually have loading docks to load and unload goods from trucks. Sometimes warehouses are designed for the loading and unloading of goods directly from railways, airports, or seaports. They often have cranes and forklifts for moving goods, which are usually placed on ISO standard pallets loaded into pallet racks.
Some of the most common warehouse storage systems are:
Pallet racking including selective, drive-in, drive-thru, double-deep, pushback, and gravity flow;
Mezzanine including structural, roll formed, racks;
Vertical Lift Modules;
Horizontal Carousels;
Vertical Carousels." [Warehouse. Wikipedia]
The shapes library "Storage and distribution" is included in the Plant Layout Plans solution from the Building Plans area of ConceptDraw Solution Park.
This visual dashboard template contains two histograms and two area charts.
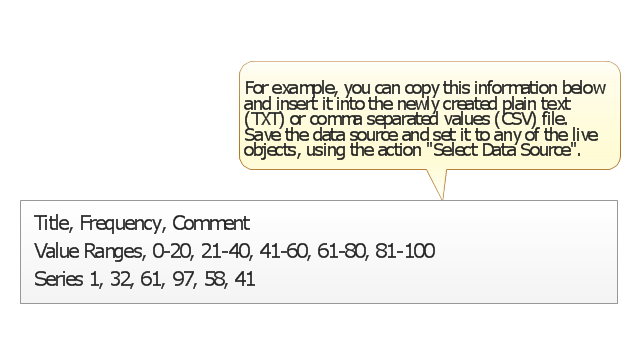
Use it to display your frequency distribution data. Each of them is Live Object and shows data from data source files. To select data source file for the chart use Action menu.
The template "Frequency distribution dashboard" for the ConceptDraw PRO diagramming and vector drawing software is included in the Frequency Distribution Dashboard solution from the area "What is a Dashboard" of ConceptDraw Solution Park.
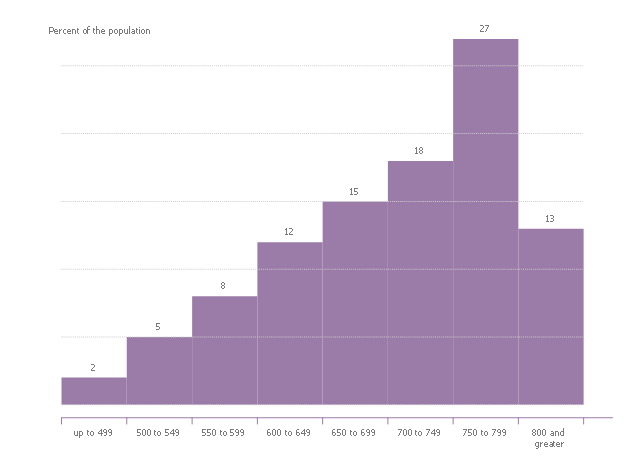
This histogram sample shows the national distribution of FICO scores in the United States. It was designed on the base of the Wikimedia Commons file: Fico histogram.svg. [commons.wikimedia.org/ wiki/ File:Fico_ histogram.svg]
This file is licensed under the Creative Commons Attribution-Share Alike 3.0 Unported license. [creativecommons.org/ licenses/ by-sa/ 3.0/ deed.en]
"The FICO score is the best-known and most widely used credit score model in the United States. It was first introduced in 1989 by FICO, then called Fair, Isaac, and Company. The FICO model is used by the vast majority of banks and credit grantors, and is based on consumer credit files of the three national credit bureaus: Experian, Equifax, and TransUnion. Because a consumer's credit file may contain different information at each of the bureaus, FICO scores can vary depending on which bureau provides the information to FICO to generate the score." [Credit score in the United States. Wikipedia]
The histogram example "National distribution of FICO scores" was created using the ConceptDraw PRO diagramming and vector drawing software extended with the Histograms solution from the Graphs and Charts area of ConceptDraw Solution Park.
The vector stencils library "Storage and distribution" contains 24 symbols of storage and distribution equipment.
Use it for drawing plant design plans and equipment layouts in the ConceptDraw PRO diagramming and vector drawing software extended with the Plant Layout Plans solution from the Building Plans area of ConceptDraw Solution Park.
www.conceptdraw.com/ solution-park/ building-plant-layout-plans
Use it for drawing plant design plans and equipment layouts in the ConceptDraw PRO diagramming and vector drawing software extended with the Plant Layout Plans solution from the Building Plans area of ConceptDraw Solution Park.
www.conceptdraw.com/ solution-park/ building-plant-layout-plans
How To Make a Histogram?
How to make a Histogram quick and easy? ConceptDraw DIAGRAM diagramming and vector drawing software extended with Histograms solution from the Graphs and Charts area will effectively help you in Histogram drawing.- Distribution Process Flow Chart
- Simple Products Marketing And Distribution Process Flow Chart
- Frequency Distribution Dashboard | Design elements - Frequency ...
- Prepare A Chart For Distribution Network For Different Products
- Employee distribution - HR dashboard | Projects HR dashboard ...
- Employee distribution - HR dashboard | HR dashboard | Frequency ...
- Normal distribution | Interior Design Storage and Distribution ...
- Normal distribution graph - Template | Normal (Gaussian ...
- Frequency Distribution Dashboard | ConceptDraw Solution Park ...
- 3phase Electrical Distribution Board Symbol
- Building Drawing Design Element: Storage and Distribution | Interior ...
- Design elements - Storage and distribution | Flow chart Example ...
- Building Drawing Design Element: Storage and Distribution | Interior ...
- Normal distribution graph - Template
- Frequency Distribution Dashboard | Flow chart Example ...
- Involvement matrix - Distribution of responsibilities | CORRECTIVE ...
- Soccer | Ice Hockey | Distribution Of Positions Of Players In Football ...
- Frequency Distribution Dashboard | Plant Layout Plans | Plumbing ...
- Building Drawing Software for Design Storage and Distribution ...
