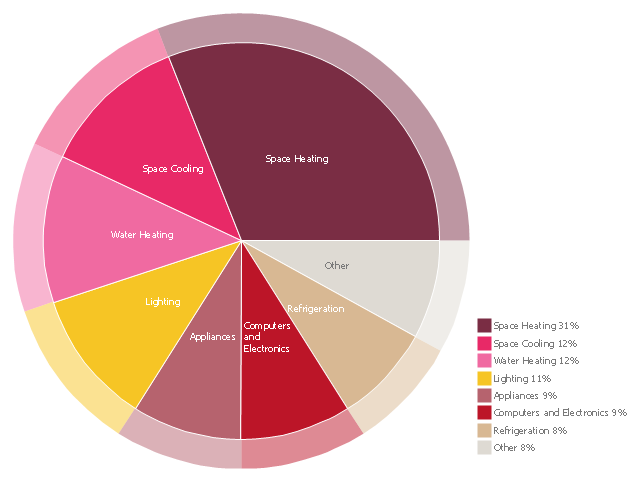
"Domestic energy consumption is the amount of energy that is spent on the various appliances used within housing. The amount of energy used per household varies widely depending on the standard of living of the country, climate, and the age and type of residence." [Domestic energy consumption. Wikipedia]
"A pie chart (or a circle graph) is a circular chart divided into sectors, illustrating numerical proportion. In a pie chart, the arc length of each sector (and consequently its central angle and area), is proportional to the quantity it represents. While it is named for its resemblance to a pie which has been sliced, there are variations on the way it can be presented. Pie charts are very widely used in the business world and the mass media." [Pie chart. Wikipedia]
This pie chart example "Domestic energy consumption" was created using the ConceptDraw PRO diagramming and vector drawing software extended with the Target and Circular Diagrams solution from the Marketing area of ConceptDraw Solution Park.
www.conceptdraw.com/ solution-park/ marketing-target-and-circular-diagrams
 Target and Circular Diagrams
This solution extends ConceptDraw PRO software with samples, templates and library of design elements for drawing the Target and Circular Diagrams.
 Health Food
The Health Food solution contains the set of professionally designed samples and large collection of vector graphic libraries of healthy foods symbols of fruits, vegetables, herbs, nuts, beans, seafood, meat, dairy foods, drinks, which give powerful possi
- Pie chart - Domestic energy consumption | Pie Charts | Target and ...
- Domestic sector SWOT | Pie chart - Domestic energy consumption ...
- Pie chart - Domestic energy consumption
- Picture Graphs | Pie Chart Of Energy Consumption As Per Area
- Energy Pyramid Diagram | Resources and energy - Vector stencils ...
- Energy Consumption Dashboard
- Chart Templates | Chart Examples | Pie Charts | Pie Chart Of Energy ...
- U.S. energy consumption by source | U.S. primary energy ...
- Pictures of Vegetables | Pie Graph Worksheets | Food Art ...
- Pai Diagram For Sector With Energy Consumption
- SWOT Matrix | Domestic sector SWOT | Scottish Government ...
- Residential Building Energy Use Pie Chart
- Drawing Pictures Of Energy Consumption
- Energy Pyramid Diagram | Scatter Chart Examples | Chart Examples ...
- Pie Chart Examples and Templates | Design elements ...
- Pie Charts | Energy Pie Chart Worksheet
- Pie Chart Of Solar System
- Energy Pyramid Diagram | Chart Examples | How to Create a Scatter ...
- U.S. primary energy consumption by source and sector | Flow chart ...
