Use Case Diagrams technology with ConceptDraw PRO
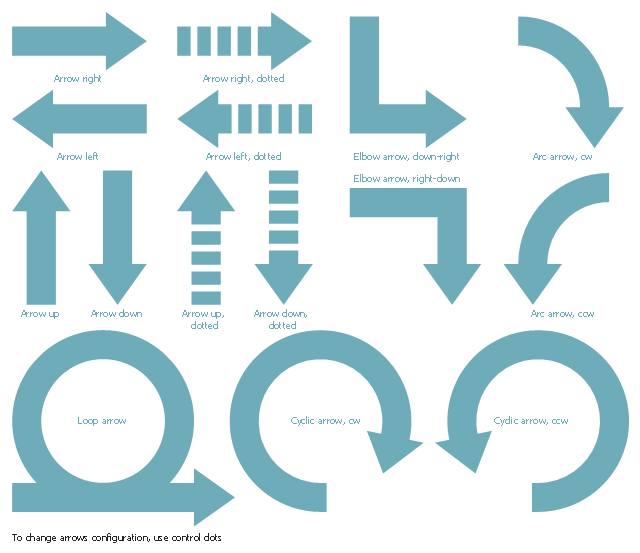
Use case diagrams are used at the development of software and systems for definition of functional system requirements or system of systems. Use case diagram presents the consecution of object’s actions (user’s or system’s) which are executed for reaching the definite result.The vector stencils library "Workflow arrows" contains 21 arrow shapes.
Use it to design your business process workflow diagrams with ConceptDraw PRO software.
The shapes example "Design elements - Workflow arrows" is included in the Business Process Workflow Diagrams solution from the Business Processes area of ConceptDraw Solution Park.
Use it to design your business process workflow diagrams with ConceptDraw PRO software.
The shapes example "Design elements - Workflow arrows" is included in the Business Process Workflow Diagrams solution from the Business Processes area of ConceptDraw Solution Park.
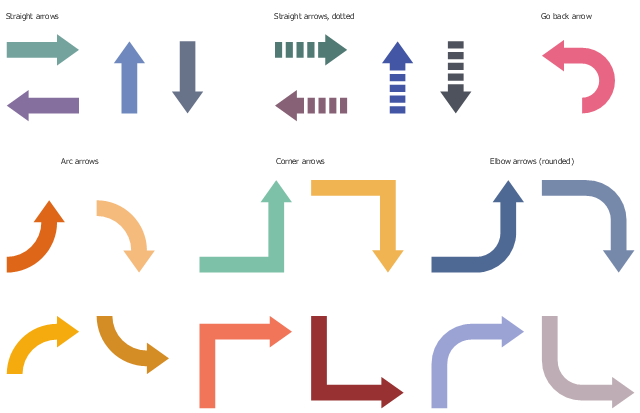
The vector stencils library "Scrum arrows" contains 15 shapes.
Use it to design your agile software development diagrams and scrum infographics with ConceptDraw PRO software.
"Agile software development is a set of principles for software development in which requirements and solutions evolve through collaboration between self-organizing, cross-functional teams. It promotes adaptive planning, evolutionary development, early delivery, and continuous improvement, and it encourages rapid and flexible response to change. Agile itself has never defined any specific methods to achieve this, but many have grown up as a result and have been recognized as being 'Agile'." [Agile software development. Wikipedia]
The diagram shapes sample "Design elements - Scrum arrows" is included in the Scrum solution from the Project Management area of ConceptDraw Solution Park.
IDEF3 Standard
Use Case Diagrams technology. IDEF3 Standard is intended for description and further analysis of technological processes of an enterprise. Using IDEF3 standard it is possible to examine and model scenarios of technological processes.Garrett IA Diagrams with ConceptDraw PRO
Garrett IA diagrams are used at development of Internet-resources, in particulars at projecting of interactions of web-resource elements. The diagram of information architecture of the web resource which is constructed correctly with necessary details presents to developers the resource in comprehensible and visual way.The vector stencils library "Transport map" contains 96 pictograms for drawing transport maps.
Use it in your spatial infographics for visual representation of transport schemes and plans as metro maps in the ConceptDraw PRO diagramming and vector drawing software extended with the Spatial Infographics solution from the area "What is Infographics" of ConceptDraw Solution Park.
Use it in your spatial infographics for visual representation of transport schemes and plans as metro maps in the ConceptDraw PRO diagramming and vector drawing software extended with the Spatial Infographics solution from the area "What is Infographics" of ConceptDraw Solution Park.
HelpDesk
How to Draw a Line Chart Quickly
A common line chart is a graphical representation of the functional relationship between two series of data. A line chart that is created by connecting a series of data points together with a straight line is the most basic type of a line chart. A line chart can be used for depicting data that changes continuously over time. It is extensively utilized in statistics, marketing and financial business. ConceptDraw Line Graph solution provides the possibility to make 2D line charts quickly and effortlessly.
 Event-driven Process Chain Diagrams
Event-driven Process Chain (EPC) Diagram is a type of flowchart widely used for modeling in business engineering and reengineering, business process improvement, and analysis. EPC method was developed within the Architecture of Integrated Information Systems (ARIS) framework.
This Active Directory network diagram example depicts types of groups and people assignment rules.
Architecture groups in a Windows Active Directory 2003:
(1) The arrow indicates "may be a member of."
(2) Dotted: Functionality limited to Windows 2003 (without the Windows 2000 compatibility).
(3) Red: Setting possible, but not recommended.
It was drawn on the base of Wikimedia Commons file: AD2003.JPG. [commons.wikimedia.org/ wiki/ File:AD2003.JPG]
This file is licensed under the Creative Commons Attribution-Share Alike 3.0 Unported license. [creativecommons.org/ licenses/ by-sa/ 3.0/ deed.en]
The Active Directory network diagram example "Tree and Forest (Full Trust)" was created using the ConceptDraw PRO diagramming and vector drawing software extended with the Active Directory Diagrams solution from the Computer and Networks area of ConceptDraw Solution Park.
- Basic Flowchart Symbols and Meaning | Dotted Double Sided Arrow ...
- Curved Dotted Arrow Png
- Dotted Curves Arrow Png
- Interchange Arrows Png
- Dotted Arrow In Conceptdraw Pro
- How to Draw a Circular Arrows Diagram Using ConceptDraw PRO ...
- North Arrow Icon Png
- Ferry Png
- Bus Top 2d Png
- Double Arrow Curved Png
- Line Arrows Png
- Rounded Arrow Png
- Dotted Circle Outline Png
- Curved Arrow 3d Png
- Arrow Shape Png
- Arrow Design Png
- Airplane Vector Dotted Line Png
- North Symbol Architecture Png
- Arrow Curved Cartoon
- North Sign Architecture Vector Png
















































---active-directory-network-diagram.png--diagram-flowchart-example.png)