HelpDesk
How to Connect Objects in ConceptDraw PRO on PC


HelpDesk
How to Add Text to a Connector in ConceptDraw PRO

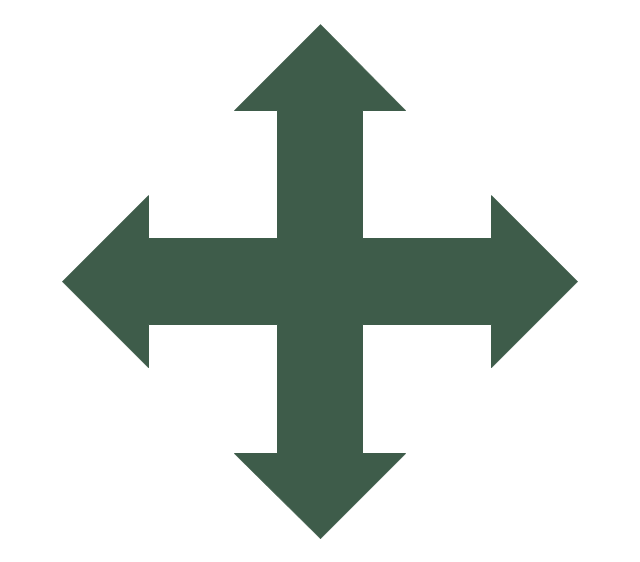
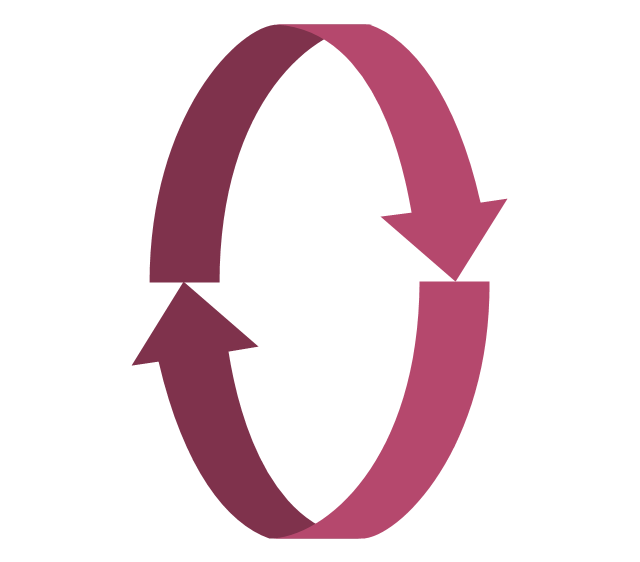
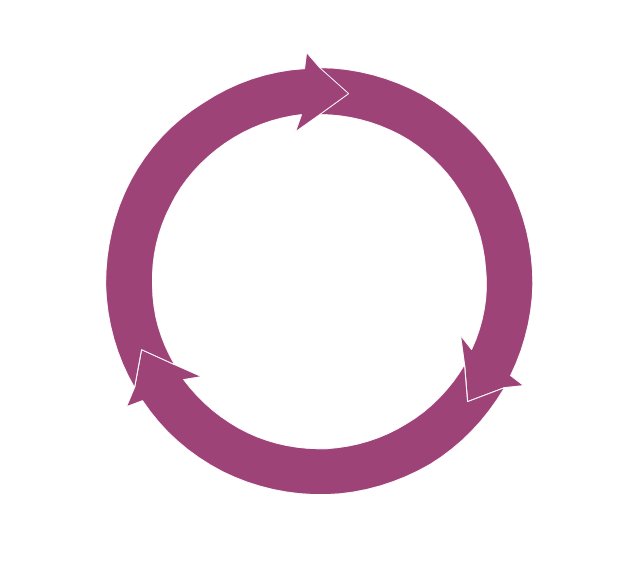
The vector stencils library "HR arrows" contains 57 arrow pictograms.
Use this arrow icon set to draw your HR flowcharts, workflow diagrams and process charts with the ConceptDraw PRO diagramming and vector drawing software.
The arrow icons library "HR arrows" is included in the HR Flowcharts solution from the Management area of ConceptDraw Solution Park.
Use this arrow icon set to draw your HR flowcharts, workflow diagrams and process charts with the ConceptDraw PRO diagramming and vector drawing software.
The arrow icons library "HR arrows" is included in the HR Flowcharts solution from the Management area of ConceptDraw Solution Park.
Arki arrow
Chevron arrow
Triangle arrow
Small arrow
Up arrow
Down arrow
Right arrow
Left arrow
Vertical moving arrow
Wavy arrow
Fat arrow
Straight arrow
Angle arrow
Double headed arrow
Single headed arrow
Elbow arrow
Crossed arrows
Turn left arrow
Turn right arrow
L-shaped arrow
Corner arrow
Diagonal arrow
Split arrow
Arc arrow
Bent arrow
Go back arrow
Double headed semicircle arrow
Counterclockwise arrow
Sector arrow
Clockwise arrow
Arrow fork
Merging arrows

U-shaped arrow
Semicircle arrow
Circular arrow
Looping arrows

Refresh arrows

Double arc arrow
Curving directional arrow
S-shaped arrow
Short arc arrow
Long arc arrow
Turn round arrow
Rotating arrows
Turned arrow
Curved left arrow
Curved right arrow
Cycle arrow
Arrow loop
Moving down arrow
Moving up arrow
Dual short arc arrow
Recycling arrows

Interaction arrows

Lightning arrow
Ribbon arrow
Circular motion arrows
HelpDesk
How to Create a Bar Chart in ConceptDraw PRO

HelpDesk
How To Create a MS Visio Workflow Diagram Using ConceptDraw PRO

HelpDesk
How to create an IDEF3 diagram using ConceptDraw PRO

 Comparison Dashboard
Comparison dashboard solution extends ConceptDraw PRO software with samples, templates and vector stencils library with charts and indicators for drawing the visual dashboard comparing data.
- Double Sided Arrow In Visio
- Fat Arrow Visio Clipart
- Visio Circular Arrows Clockwise
- Wavy Arrows Visio
- Short Arc Arrow Visio
- Double Head Arrow In Flowchart Meaning Pdf
- Visio Loop Arrow
- Double Sided Arrow
- Architecture Diagram Double Sided Arrow Image Meaning
- How to Draw a Circular Arrows Diagram Using ConceptDraw PRO ...
- Process Flowchart | Double -headed Cross Functional Flowchart ...
- Bended Arrow In Visio
- Cross-Functional Flowchart | Double -headed Cross Functional ...
- HR arrows - Vector stencils library | Android GUI | macOS User ...
- Double Side Arrow Meaning In Flow Charts
- Two Way Arrow Png
- Visio L Shaped Arrow Double Line
- Visio Merge Arrows
- Curved Arrows In Visio
- How To Create a MS Visio Block Diagram Using ConceptDraw PRO ...