Chart Examples
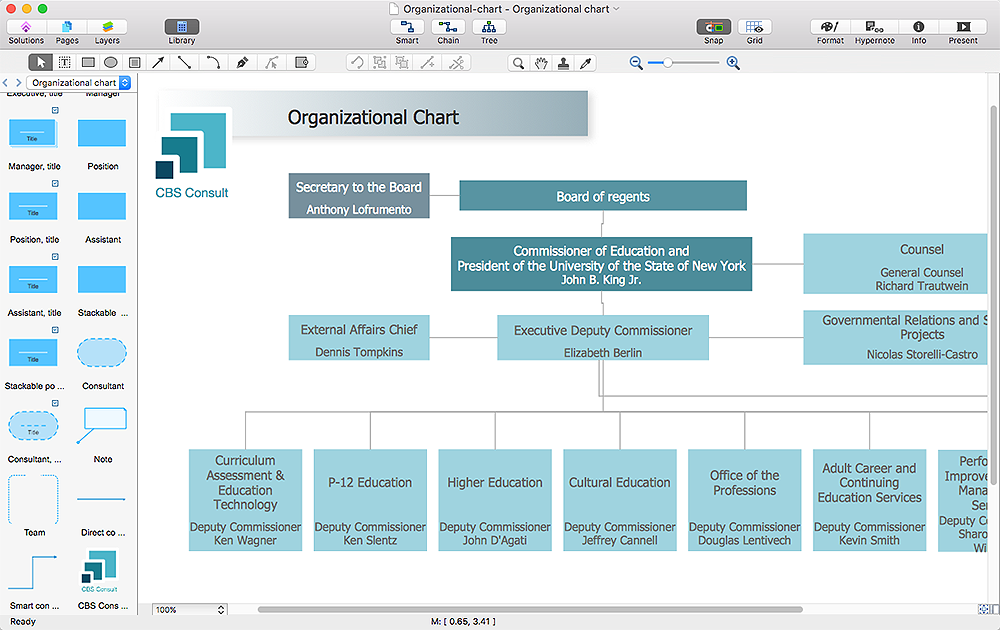
Easy charting software comes with beautiful chart templates and examples. This makes it easy to create professional charts without prior experience.Best Vector Drawing Application for Mac OS X
ConceptDraw PRO creates drawings, diagrams and charts with great visual appeal in Mac OS X.Basic Flowchart Symbols and Meaning
Flowcharts are the best for visually representation the business processes and the flow of a custom-order process through various departments within an organization. ConceptDraw PRO diagramming and vector drawing software extended with Flowcharts solution offers the full set of predesigned basic flowchart symbols which are gathered at two libraries: Flowchart and Flowcharts Rapid Draw. Among them are: process, terminator, decision, data, document, display, manual loop, and many other specific symbols. The meaning for each symbol offered by ConceptDraw gives the presentation about their proposed use in professional Flowcharts for business and technical processes, software algorithms, well-developed structures of web sites, Workflow diagrams, Process flow diagram and correlation in developing on-line instructional projects or business process system. Use of ready flow chart symbols in diagrams is incredibly useful - you need simply drag desired from the libraries to your document and arrange them in required order. There are a few serious alternatives to Visio for Mac, one of them is ConceptDraw PRO. It is one of the main contender with the most similar features and capabilities.
Cross-Functional Flowchart Basics
Don't let your first glance fool you. ConceptDraw is a lot easier to use than it looks. Use its cross-functional templates and library as basics to get started. All you need to know are a few basic steps and terms. ConceptDraw Arrows10 Technology is a new age in drawing software. Use it for process flows and its new rapid draw feature enables to draw an impressive charts in a seconds.Bubble diagrams with ConceptDraw PRO
Using ConceptDraw you will be able to create bubble diagrams from the ready ConceptDraw library objects or make your own objects. The created diagram can be saved and edited, objects can be moved and links between them will be automatically repainted after object moving because of using the ConceptDraw connectors.
 Bar Graphs
The Bar Graphs solution enhances ConceptDraw PRO v10 functionality with templates, numerous professional-looking samples, and a library of vector stencils for drawing different types of Bar Graphs, such as Simple Bar Graph, Double Bar Graph, Divided Bar Graph, Horizontal Bar Graph, Vertical Bar Graph, and Column Bar Chart.
Column Chart Software
ConceptDraw Column Chart software allows drawing column charts using predesigned objects or drawing tools. In ConceptDraw Column Chart software you can find a complete set of column chart tools and objects.HelpDesk
How to Make Soccer Position Diagram Using ConceptDraw PRO
The soccer field has the form of a large rectangle, covered with grass. Dimensions of soccer fields may vary slightly, depending on the level of the game, but all fields have some common characteristics. Soccer players may take different positions. Each soccer position has its own name, and implies certain player functions. Every soccer position has a very specific name and task: Goalkeeper, Defenders, Midfielders and Forwards. During preparation for the game coach met a challenge: how to explain each player's position and his role in the game. The difficulty is the fact that in the course of the game players will often move on the field and do not stay in one place. Football field diagram with dimensions and marking, and positions - it is an important tool for the coach. ConceptDraw PRO helps both coach and players to understand exactly their roles during the particular game. The ability to create Soccer diagrams is contained in the ConceptDraw Soccer solution. The solution providesChart Maker for Presentations
Easy charting software comes with beautiful chart templates and examples. This makes it easy to create professional charts without prior experience.HelpDesk
How to Add a Self-Drawn Object to a Library
One of the key elements of ConceptDraw PRO solutions are the libraries, containing a set of associated objects. Using these collections of business oriented vector objects, you can quickly get started making the diagram in the theme you need. The library collection can be supplemented by creating new or editing existing objects. You can create your own unique library just by dragging objects with the mouse. Library objects can be customized and saved for later use. You can change the scaling, color, line weight, label, and even the fill pattern of an object to use in custom drawings and diagrams. Your custom objects even can be searched for the next time you need to use them.
 Composition Dashboard
Composition dashboard solution extends ConceptDraw PRO software with templates, samples and vector stencils library with charts and indicators for drawing visual dashboards showing data composition.
HelpDesk
How to Create Management Infographics Using ConceptDraw PRO
Management might want to communicate a basic workflow for each division of the company, visualise business strategy and decision processes, or display a certain business training concept. In this case, an infographic can be more text heavy, and use illustrations to establish a timeline, process, or step-by-step sequence of events. ConceptDraw PRO can be used as a tool for creating management infographics. It allows you to draw infographics quickly and easily using the special templates and vector stencils libraries. Infographics can be used to quickly communicate a message, to simplify the presentation of large amounts of data, to see data patterns and relationships, and to monitor changes in variables over time. It can contain bar graphs, pie charts, histograms, line charts, e.t.c.HelpDesk
How to Design a Mockup of Apple macOS Sierra GUI
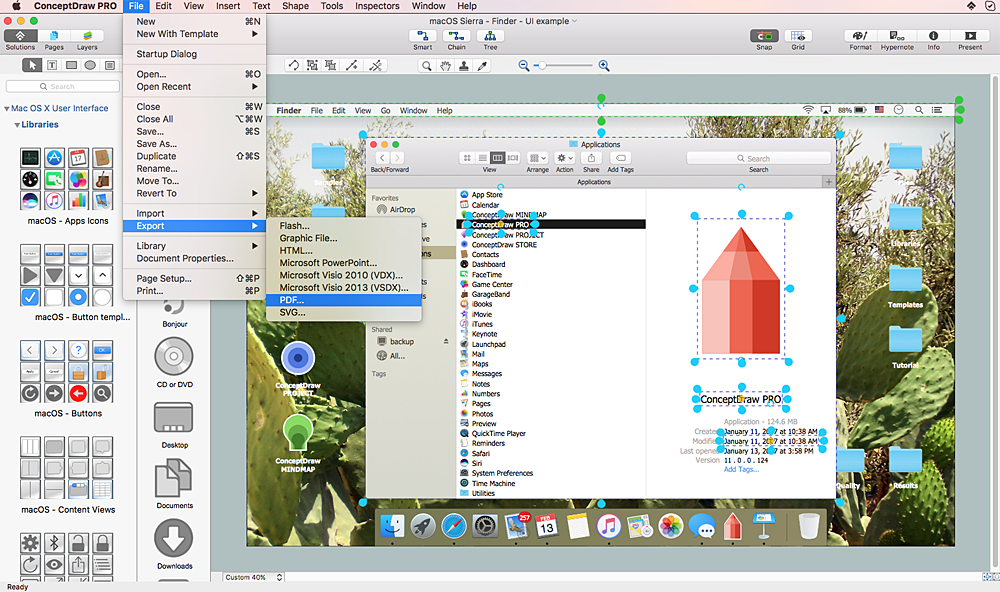
Since that first Macintosh, Apple have always developed and used their own hardware specific operating system. The fundamental style and layout of the Mac OS X user interface has remained largely in place since the earliest versions, but there have been obvious aesthetic enhancements, and elements of icon redesign to match branding across devices. To design an effective user interface, graphic designers will create visual GUI prototypes, that focus on maximizing the user experience. Uses Interface prototyping is much convenient when you can work through a diagram similar to the OS X design. ConceptDraw PRO allows you to develop Apple OS X User Interface (UI) prototypes using the special templates and vector libraries of the specific user interface elements. ConceptDraw Mac OS X UI solution offers libraries containing the distinct Mac app icons, menu bar graphics, glyph elements and other Mac OS X features — everything necessary to create high standard, professional UI graphic desigIDEF9 Standard
Use Case Diagrams technology. An effective management of changes is significantly facilitated by way of definition and documenting of business-requirements.- Bar Diagrams for Problem Solving. Create economics and financial ...
- Offensive Play – Double Wing Wedge – Vector Graphic Diagram ...
- Best Vector Drawing Application for Mac OS X | Offensive Play ...
- What Does Double Line In Er Diagram Indicates
- Entity Relationship Diagram Symbols and Meaning ERD Symbols ...
- Create Block Diagram | Double -headed Cross Functional Flowchart ...
- Venn diagram - Internet marketing professions | Internet Connectivity ...
- Venn diagram - Internet marketing professions | Local area network ...
- Bar Chart Software | Bar Graphs | Chart Maker for Presentations ...
- Venn Diagram Examples for Problem Solving. Environmental Social ...
- Double -headed Cross Functional Flowchart | Pipes 2 - Vector ...
- Venn Diagram Examples for Problem Solving. Environmental Social ...
- Venn Diagram Examples for Problem Solving. Environmental Social ...
- Bar Chart Template for Word | Sales Growth. Bar Graphs Example ...
- Circular diagrams - Vector stencils library | Circular Arrows ...
- Venn Diagrams | Graph For Sustainable Development Path
- Venn Diagrams | Multi Layer Venn Diagram . Venn Diagram ...
- Internet Marketing Infographic | Internet marketing - Concept map ...
- Construction Project Chart Examples | 3 Circle Venn. Venn Diagram ...
- Bar Chart Software | Chart Maker for Presentations | Data-driven ...


