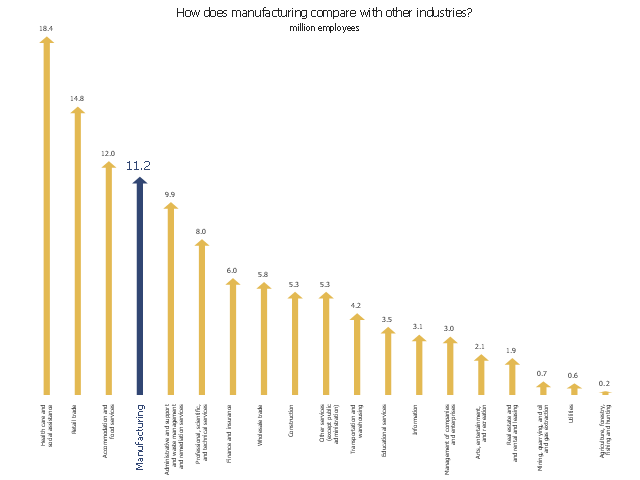
Bar Diagrams for Problem Solving. Create manufacturing and economics bar charts with Bar Graphs Solution
Create bar charts for visualizing problem solving in manufacturing and economics using the ConceptDraw PRO diagramming and vector drawing software extended with the Bar Graphs Solution from the Graphs and Charts area of ConceptDraw Solition Park.Bar Diagrams for Problem Solving. Create economics and financial bar charts with Bar Graphs Solution
Create bar graphs for visualizing economics problem solving and financial data comparison using the ConceptDraw PRO diagramming and vector drawing software extended with the Bar Graphs Solution from the Graphs and Charts area of ConceptDraw Solition Park.Bar Chart Template for Word
All these bar chart templates are included in the Bar Graphs solution.You can quickly rework these bar graph templates into your own charts by simply changing displayed data, title and legend texts.
This arrows bar chart example was drawn on the base of the infographics "Inside America's Economic Machine" from the website of the United States Census Bureau.
[census.gov/ how/ img/ Econ_ Infographic.jpg]
"The Advance Report on Durable Goods Manufacturer's Shipments, Inventories and Orders, or the Durable Goods Report, provides data on new orders received from more than 4,000 manufacturers of durable goods, which are generally defined as higher-priced capital goods orders with a useful life of three years or more, such as cars, semiconductor equipment and turbines.More than 85 industries are represented in the sample, which covers the entire United States." [Economic Indicators: Durable Goods Report. R. Barnes. investopedia.com/ university/ releases/ durablegoods.asp]
The arrow graph example "Total value of manufacturers' shipments" was created using the ConceptDraw PRO diagramming and vector drawing software extended with the Picture Graphs solution from the Graphs and Charts area of ConceptDraw Solution Park.
Sales Growth. Bar Graphs Example
This sample was created in ConceptDraw PRO diagramming and vector drawing software using the Bar Graphs Solution from Graphs and Charts area of ConceptDraw Solution Park. It is Bar Graphs example, Sales Growth example, Column Chart Example - Sales Report.Relative Value Chart Software
Relative value is a value measured in the terms of liquidity, risks, return of one investment or financial instrument relative to another.Relative values are widely used in:business, economics, investment, management, marketing, statistics, etc.
ConceptDraw PRO software is the best for drawing professional looking Relative Value Charts. ConceptDraw PRO provides Divided Bar Diagrams solution from the Graphs and Charts Area of ConceptDraw Solution Park.
- Bar Diagrams for Problem Solving. Create manufacturing and ...
- Bar Chart Software | Bar Diagrams for Problem Solving. Create ...
- What Is Bar Chart In Economics
- Economic Bar Chart
- Bar Chart Software | How to Draw a Divided Bar Chart in ...
- Bar Chart Examples | Bar Diagrams for Problem Solving. Create ...
- How to Draw a Divided Bar Chart in ConceptDraw PRO | Bar Chart ...
- Bar Diagrams for Problem Solving. Create economics and financial ...
- Sales Growth. Bar Graphs Example | Bar Diagrams for Problem ...
- Examples Of Bar Chart In Finance
- Bar Diagrams for Problem Solving. Create manufacturing and ...
- Bar Graph Of Manufacturing
- Bar Diagrams for Problem Solving. Create economics and financial ...
- Bar Diagrams for Problem Solving. Create economics and financial ...
- Bar Chart Examples And Solutions
- Bar Chart Examples
- Changes in price indices - Double bar chart | Double Bar Diagram In ...
- Accounting Flowcharts | How to Draw a Divided Bar Chart in ...
- Bar Graph Examples
- Bar Diagrams for Problem Solving. Create economics and financial ...


