This vector stencils library contains 184 round icons.
Use it to design cloud computing infographics and diagrams with ConceptDraw PRO software.
"Though service-oriented architecture advocates "everything as a service" (with the acronyms EaaS or XaaS or simply aas), cloud-computing providers offer their "services" according to different models, which happen to form a stack: infrastructure-, platform- and software-as-a-service.
Infrastructure as a service (IaaS)
In the most basic cloud-service model ... providers of IaaS offer computers — physical or (more often) virtual machines — and other resources. IaaS refers to online services that abstract the user from the details of infrastructure like physical computing resources, location, data partitioning, scaling, security, backup etc.
Platform as a service (PaaS)
PaaS vendors offer a development environment to application developers. The provider typically develops toolkit and standards for development and channels for distribution and payment. In the PaaS models, cloud providers deliver a computing platform, typically including operating system, programming-language execution environment, database, and web server. Application developers can develop and run their software solutions on a cloud platform without the cost and complexity of buying and managing the underlying hardware and software layers.
Software as a service (SaaS)
In the software as a service (SaaS) model, users gain access to application software and databases. Cloud providers manage the infrastructure and platforms that run the applications. SaaS is sometimes referred to as "on-demand software" and is usually priced on a pay-per-use basis or using a subscription fee.
In the SaaS model, cloud providers install and operate application software in the cloud and cloud users access the software from cloud clients. Cloud users do not manage the cloud infrastructure and platform where the application runs. This eliminates the need to install and run the application on the cloud user's own computers, which simplifies maintenance and support. Cloud applications differ from other applications in their scalability — which can be achieved by cloning tasks onto multiple virtual machines at run-time to meet changing work demand." [Cloud computing. Wikipedia]
The vector stencils library "Cloud round icons" is included in the Cloud Computing Diagrams solution from the Computer and Networks area of ConceptDraw Solution Park.
Components of ER Diagram
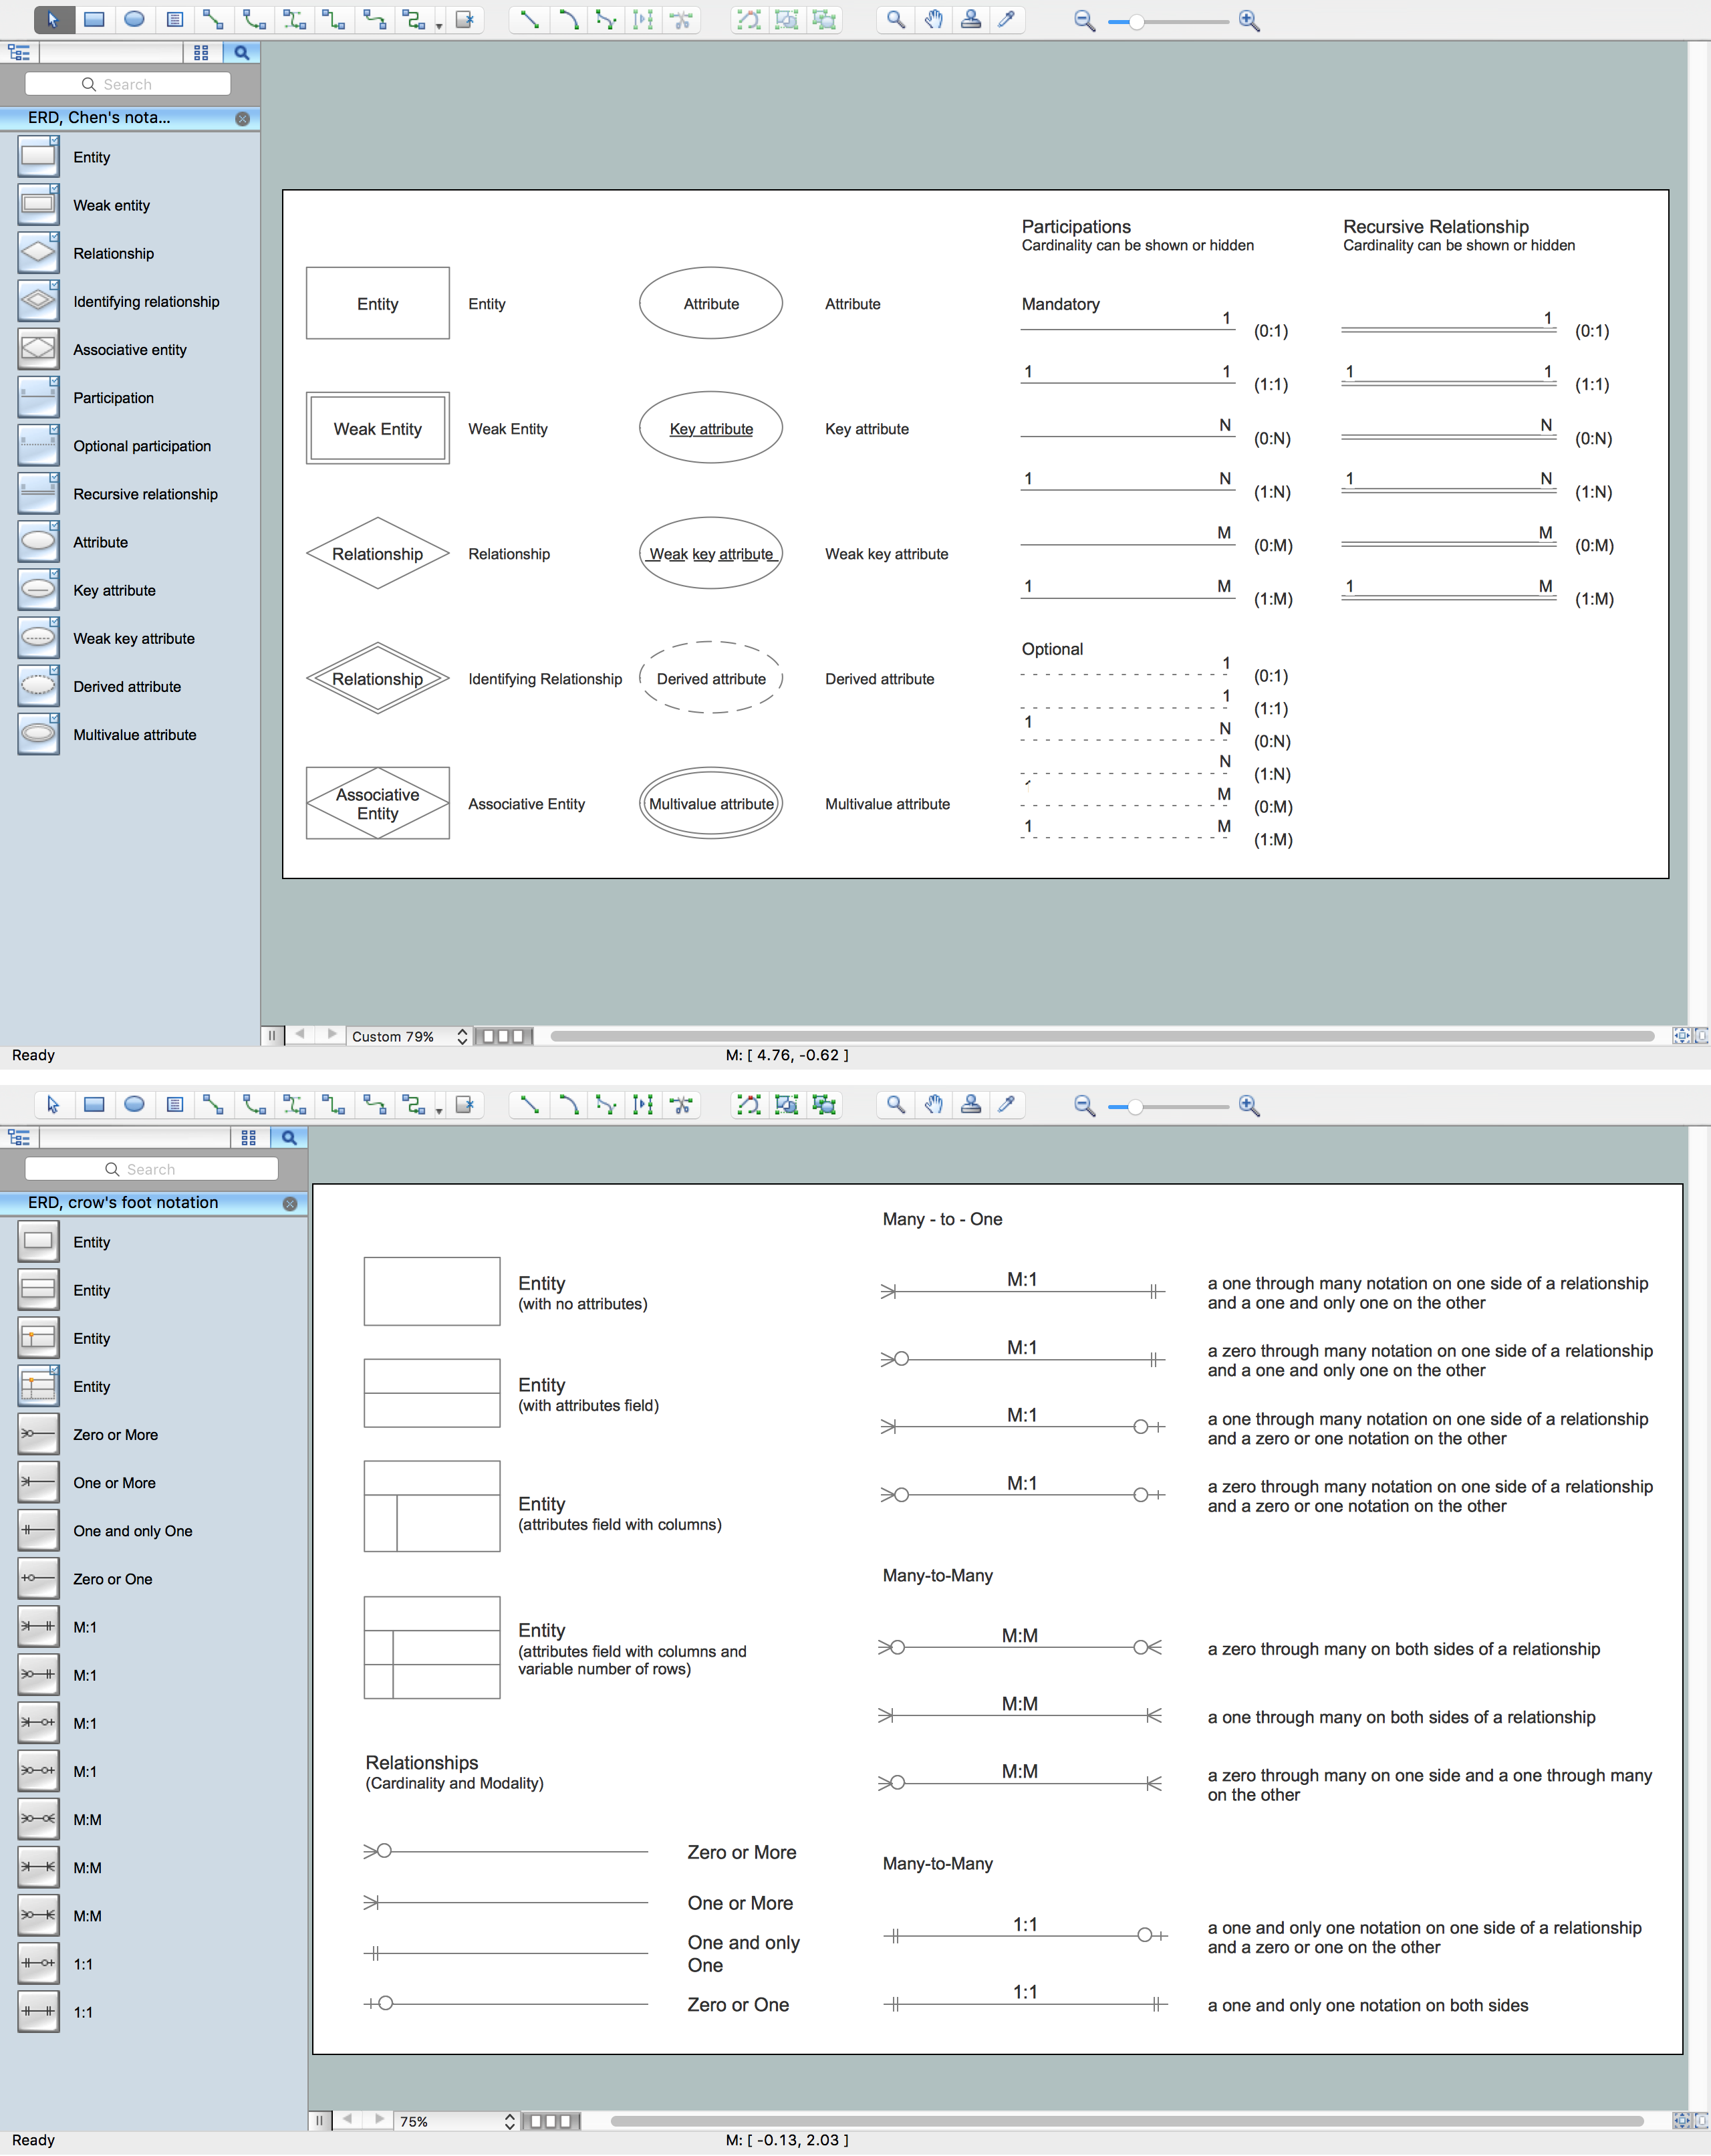
Entity-Relationship model gives the possibility to visually describe a database using the components of ER Diagram, entity relationship stencils, relationship symbols, work flow shapes. ER-diagram lets represent the data or entities, attributes of these entities and relationships between them, using standardized Crow’s Foot notation icons or Chen’s notation icons. An entity is an object of the real world, it can exist independently and has the instances which differ in attribute values (properties). The attributes give an unambiguous (uniquely) identification for the instance and are called the primary key, this key can be composite and combine several attributes. ConceptDraw DIAGRAM is a professional software available with Entity-Relationship Diagram (ERD) solution from Software Development area that lets create ERDs for various database systems, using Crow’s Foot and Chen’s notations. It is invaluable tool for software engineers and developers, it supports ODBC-compatible databases (Oracle, MySQL, MS Access, MS SQL, InterBase, Firebird and others).Product Overview
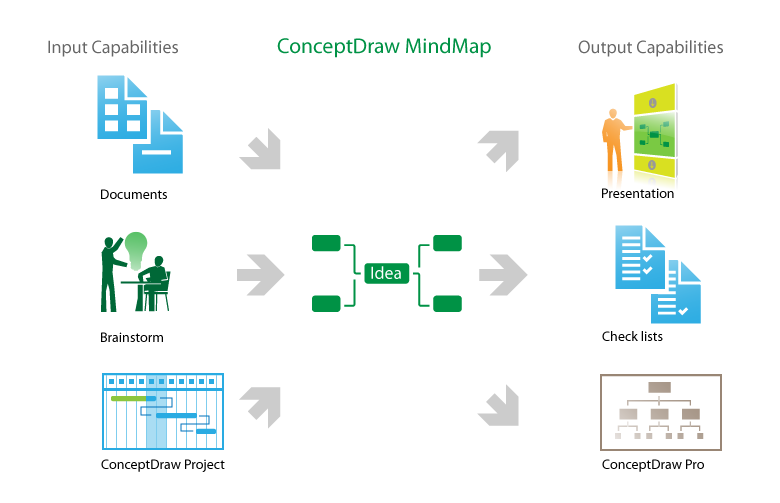
The role of ConceptDraw MINDMAP is to organize and plan idea development and communicate between process participants. Mind maps are convenient to prepare presentations for team and management and send task lists and related information.E-R Diagrams
Complexity of databases increases day by day, due to this the Entity relationship models and E-R diagrams become more and more popular, and now are an important part of database design. E-R diagrams created at ConceptDraw DIAGRAM allow visually and graphically represent structure and design of databases.Entity Relationship Diagram Software Engineering
Entity Relationship Diagram (aka ER Diagram, E-R Diagram, ERD) is a time-tested and widespread software development and software engineering method for data modeling, illustrating the logical structure of databases and system design. For ERDs construction are used three basic elements: entities, attributes, and relationships. Chen's notation for ERD supposes the use of rectangles (boxes) to represent entities and diamonds to depict relationships between first-class objects. This notation is popular when creating conceptual data models of information systems. Another standardized notation for ER diagrams is Crow's foot notation. ConceptDraw DIAGRAM as a powerful Entity Relationship Diagram software engineering provides the tools of Entity-Relationship Diagram (ERD) solution from Software Development area of ConceptDraw Solution Park for instantly describing databases using ERDs of Crow’s Foot and Chen’s notations. Use the predesigned vector elements for both these notations from 2 libraries included to Entity-Relationship Diagram (ERD) solution.Mechanical Drawing Symbols
Mechanical Drawings are the special type of technical diagrams that visualize the structure of complex systems and illustrate the information about ventilation, heating, air conditioning, i.e. HVAC systems. These drawings are created on the base of floor plans and reflected ceiling plans, and then become an obligatory part of construction project which is needed directly for construction a building and for receiving a permit on it. Mechanical drawings and diagrams help effectively represent construction, technical and engineering solutions, and also schematics of different mechanical equipment. ConceptDraw DIAGRAM ector drawing software enhanced with Mechanical Engineering solution from Engineering area of ConceptDraw Solution Park provides wide set of effective drawing tools, predesigned mechanical drawing symbols, templates, samples and examples. Use of standardized and recognized mechanical vector symbols helps you design understandable mechanical drawings, diagrams and mechanical engineering schematics.The vector stencils library "Bank UML deployment diagram" contains 10 shapes for drawing UML deployment diagrams.
Use it for object-oriented modeling of your bank information system.
"A deployment diagram in the Unified Modeling Language models the physical deployment of artifacts on nodes. To describe a web site, for example, a deployment diagram would show what hardware components ("nodes") exist (e.g., a web server, an application server, and a database server), what software components ("artifacts") run on each node (e.g., web application, database), and how the different pieces are connected (e.g. JDBC, REST, RMI).
The nodes appear as boxes, and the artifacts allocated to each node appear as rectangles within the boxes. Nodes may have subnodes, which appear as nested boxes. A single node in a deployment diagram may conceptually represent multiple physical nodes, such as a cluster of database servers.
There are two types of Nodes:
1. Device Node.
2. Execution Environment Node.
Device nodes are physical computing resources with processing memory and services to execute software, such as typical computers or mobile phones. An execution environment node (EEN) is a software computing resource that runs within an outer node and which itself provides a service to host and execute other executable software elements." [Deployment diagram. Wikipedia]
This example of UML deployment diagram symbols for the ConceptDraw PRO diagramming and vector drawing software is included in the ATM UML Diagrams solution from the Software Development area of ConceptDraw Solution Park.
Internet solutions with ConceptDraw DIAGRAM
ConceptDraw is a good means of visualization of information of any kind as it features powerful graphic capabilities. The conception of using ConceptDraw and open formats by the programs that work with Internet can be used for displaying any data and any structure in Internet.Notation & Symbols for ERD
The ER diagram is constructed from the specific ERD graphic elements. There are used 2 types of ERD notations: Chen and Crow's Foot. A complete set of work flow shapes, notation & symbols for ERD, entity relationship stencils, included in Entity-Relationship Diagram (ERD) solution for ConceptDraw DIAGRAM software, makes drawing diagrams based on ERD notation as smooth as possible.- Draw Components Of Environment
- Draw A Flowchart Of Component Of Environment
- Draw A Diagram Of The Major Components Of Environment
- Draw A Chart On Components Of Environment
- Flow Chart On Components Of Environment
- Environment Diagrams
- Execution Environment
- Full Label Diagram Of Internet Environment
- Draw An Overview On Odbc
- What Is Components Of Environment Drawing Chart


