Business diagrams & Org Charts with ConceptDraw DIAGRAM
The business diagrams are in great demand, they describe the business processes, business tasks and activities which are executed to achieve specific organizational and business goals, increase productivity, reduce costs and errors. They let research and better understand the business processes. ConceptDraw DIAGRAM is a powerful professional cross-platform business graphics and business flowcharting tool which contains hundreds of built-in collections of task-specific vector stencils and templates. They will help you to visualize and structure information, create various Business flowcharts, maps and diagrams with minimal efforts, and add them to your documents and presentations to make them successful. Among them are Data flow diagrams, Organization charts, Business process workflow diagrams, Audit flowcharts, Cause and Effect diagrams, IDEF business process diagrams, Cross-functional flowcharts, PERT charts, Timeline diagrams, Calendars, Marketing diagrams, Pyramids, Target diagrams, Venn diagrams, Comparison charts, Analysis charts, Dashboards, and many more. Being a cross-platform application, ConceptDraw DIAGRAM is very secure, handy, free of bloatware and one of the best alternatives to Visio for Mac users.
HelpDesk
How to Create Flowchart Using Standard Flowchart Symbols
Flowcharts are used to display an algorithm for consistent execution of certain steps. Flowchart is probably the easiest way to make a graphical representation of any process. Flowcharts use the set of standard geometric symbols and arrows to define relationships. ConceptDraw DIAGRAM allows you to create professional flowchart quickly and easily. The ability to create flowcharts is contained in the Flowcharts solution. The solution provides a set of special tools for creating flowcharts.HelpDesk
How to Create an Audit Flowchart
Audit flowcharts are often used in auditors activity. This is the most effective way of preparation and documentation of the audit process. Financial audit process has a clear structure, and therefore audit flowchart is often used to denote an audit process. This is the most effective way of preparation and documentation of the audit process. Flowcharts are often used in auditors activity. A flowchart may be created at any stage of an audit process as an aid in the determination and evaluation of a client's accounting system. ConceptDraw DIAGRAM allows you to create professional accounting flowchart quickly using the professional Audit Flowcharts solution.- Basic Flowchart Symbols and Meaning | Audit Flowchart Symbols ...
- Basic Flowchart Symbols and Meaning | How to Draw a Flowchart ...
- Euclidean algorithm - Flowchart | Basic Flowchart Symbols and ...
- How To Draw Data Flow Diagram
- Solving quadratic equation algorithm - Flowchart | Contoh Flowchart ...
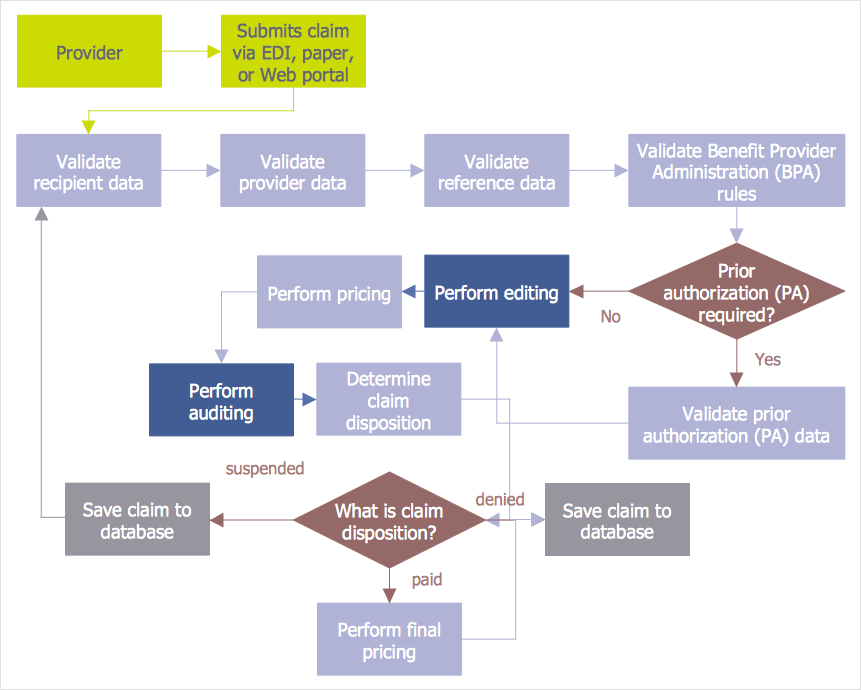
- Process Flowchart | Flowchart Component | Accounting Information ...
- Swim Lane Diagrams | Cross-Functional Flowchart (Swim Lanes ...
- Cross Functional Flowchart Symbols | Flow Chart Symbols | Basic ...
- Draw A Flowchart Of A Purchasing System Or Process For Any
- Sample Project Flowchart . Flowchart Examples | Flowchart ...
- Basic Audit Flowchart . Flowchart Examples | Basic Flowchart Images ...
- Basic Flowchart Symbols and Meaning | Process Flowchart ...
- Process Flowchart | Flow chart Example. Warehouse Flowchart ...
- How to Draw an Organization Chart | ConceptDraw PRO ...
- How to Draw a Computer Network Diagrams | Process Flowchart ...
- Solving quadratic equation algorithm - Flowchart | Draw A Flowchart ...
- Basic Audit Flowchart . Flowchart Examples | Audit Flowcharts | Audit ...
- Process Flowchart | Simple Flow Chart | Sales Process Flowchart ...
- How to Draw an Organization Chart | Cubetto Flowchart | Basic ...
- Process Flowchart | Process flow diagram (PFD) template | Business ...