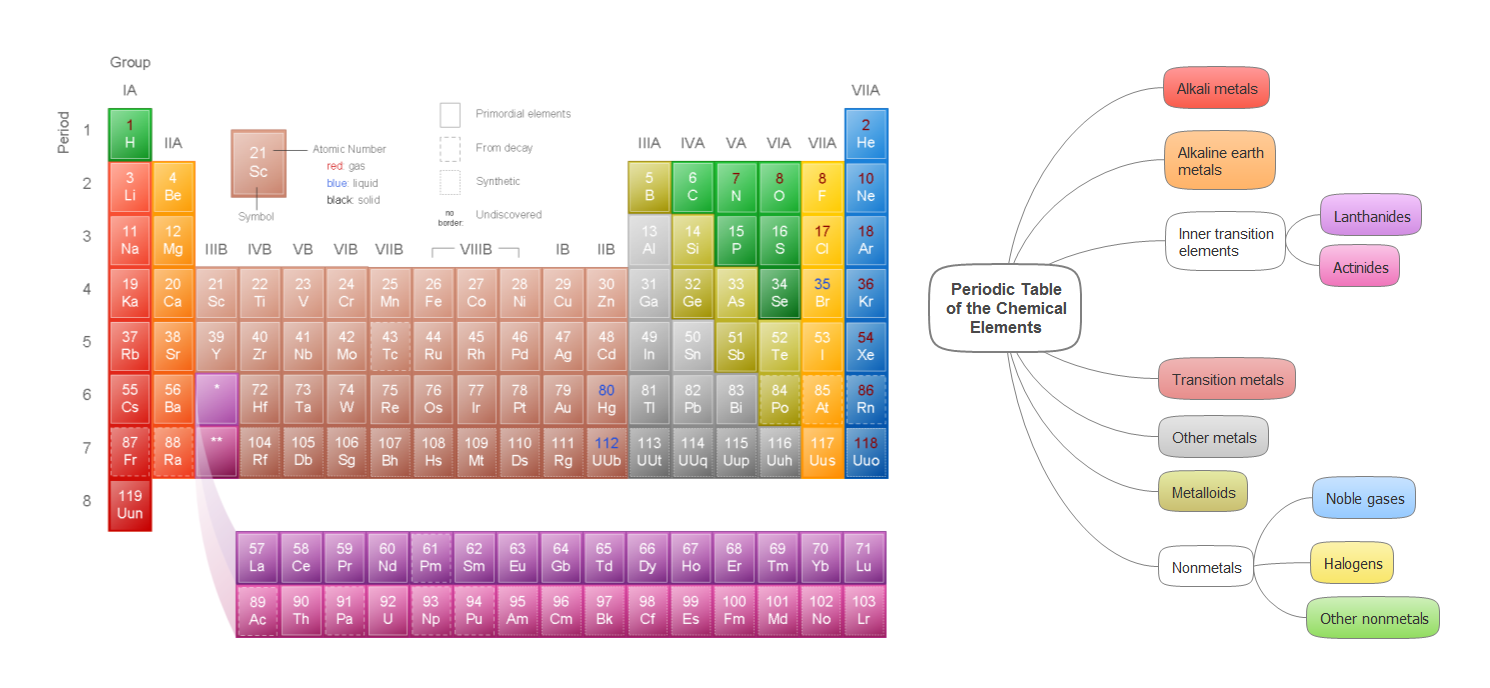
The vector stencils library "Periodic table of chemical elements" contains 119 icon symbols of chemical elements for drawing Mendeleev's periodic table, chemical diagrams, infographics and illustrations.
"A chemical element is a pure chemical substance consisting of a single type of atom distinguished by its atomic number, which is the number of protons in its atomic nucleus. Elements are divided into metals, metalloids, and non-metals. Familiar examples of elements are carbon, nitrogen, oxygen (non-metals), silicon, arsenic (metalloids), aluminium, iron, copper, gold, mercury, and lead (metals).
The lightest chemical elements, including hydrogen, helium and smaller amounts of lithium, beryllium and boron, are thought to have been produced by various cosmic processes during the Big Bang and cosmic-ray spallation. Production of heavier elements, from carbon to the very heaviest elements, proceeded by stellar nucleosynthesis, and these were made available for later solar system and planetary formation by planetary nebulae and supernovae, which blast these elements into space. The high abundance of oxygen, silicon, and iron on Earth reflects their common production in such stars. While most elements are generally stable, a small amount of natural transformation of one element to another also occurs in the decay of radioactive elements as well as other natural nuclear processes." [Chemical element. Wikipedia]
The chemical symbols example "Design elements - Periodic table of chemical elements" was created using the ConceptDraw PRO software extended with the Chemistry solution from the Science and Education area of ConceptDraw Solution Park.
HelpDesk
How to Draw Chemistry Structures
Making chemistry drawings for science and education purposes involves many different elements that can be managed using ConceptDraw PRO. ConceptDraw Chemistry solution can be used as a tool for creating chemical schemes and diagrams of chemical lab set-ups and labware, formulas, reaction schemes, and molecular structures. With ConceptDraw PRO you can easily create and communicate chemistry drawings of any complexity.Chemistry Drawing Software
ConceptDraw PRO extended with Chemistry solution from the Science and Education area is a powerful chemistry drawing software that provides the useful tools to help you design all kinds of chemistry drawings and illustrations, chemical schemes and diagrams of formulas, reaction schemes and lab set-ups of any complexity.
 Chemistry
This solution extends ConceptDraw PRO software with samples, template and libraries of vector stencils for drawing the Chemistry Illustrations for science and education.
Chemistry Drawings
ConceptDraw PRO diagramming and vector drawing software extended with Chemistry solution from the Science and Education area is a powerful chemistry drawing software that is ideal for quick and easy designing of various: chemistry drawings, scientific and educational chemistry illustrations, schemes and diagrams of chemical and biological lab set-ups, images with chemical formulas, molecular structures, chemical reaction schemes, schemes of labware, that can be then successfully used in the field of science and education, on various conferences, and so on.Chemistry Symbols and Meanings
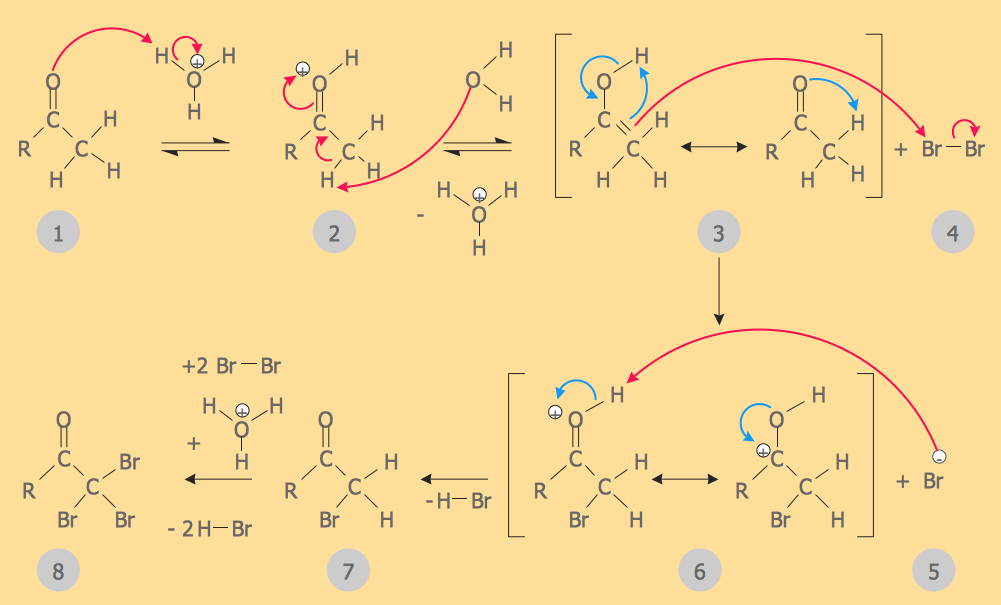
Chemistry solution offers 5 libraries with large collection of vector chemistry symbols and meanings, chemistry equation symbols, organic chemistry symbols, and chemical clipart: Chemical Elements Library, Chemical Drawings Library, Conformations Library, Laboratory Equipment Library, Periodic Table of Chemical Elements Library.Organic Chemistry Symbols
ConceptDraw PRO diagramming and vector drawing software extended with Chemistry solution from the Science and Education area of ConceptDraw Solution Park is effective for drawing various organic chemistry schemes, diagrams, illustrations thanks to the included collection of predesigned organic chemistry symbols.ERD Symbols and Meanings
Entity Relationship Diagram (ERD) is a popular software engineering tool for database modeling and illustration the logical structure of databases, which uses one of two notations - Chen's or Crow’s Foot. Crow's foot notation is effective when used in software engineering, information engineering, structured systems analysis and design. Each of these notations applies its own set of ERD symbols. Crow's foot diagrams use boxes to represent entities and lines between these boxes to show relationships. Varied shapes at the ends of lines depict the cardinality of a given relationship. Chen's ERD notation is more detailed way to represent entities and relationships. ConceptDraw PRO application enhanced with all-inclusive Entity-Relationship Diagram (ERD) solution allows design professional ER diagrams with Chen's or Crow’s Foot notation on your choice. It contains the full set of ready-to-use standardized ERD symbols and meanings helpful for quickly drawing, collection of predesigned ERD samples, examples and templates. ConceptDraw Pro is a great alternative to Visio for Mac users as it offers more features and can easily handle the most demanding professional needs.
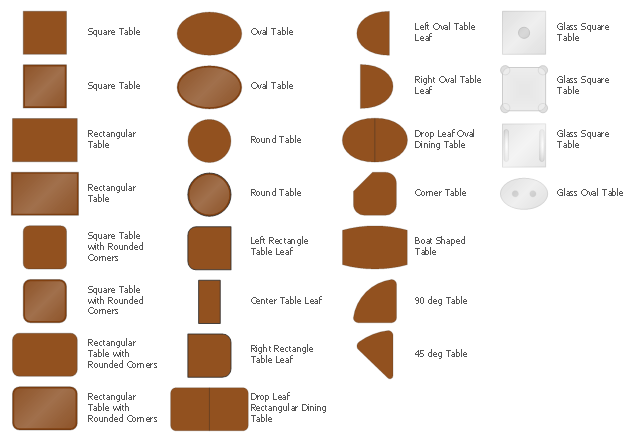
The design elements library Tables contains 27 symbols of tables.
Use the vector stencils library Tables to develop house floor plans, home designs, kitchen and dining room design and furniture layout of cafe or restaurant.
"A table is a form of furniture with a flat horizontal upper surface used to support objects of interest, for storage, show, and/ or manipulation. The surface must be held stable; for reasons of simplicity, this is usually done by support from below by either a column, a "base", or at least three columnar "stands". In special situations, table surfaces may be supported from a nearby wall, or suspended from above.
Common design elements include:
top surfaces of various shapes, including rectangular, rounded, or semi-circular;
legs arranged in two or more similar pairs;
several geometries of folding table that can be collapsed into a smaller volume;
heights ranging up and down from the most common 18–30 inches (46–76 cm) range, often reflecting the height of chairs or bar stools used as seating for people making use of a table, as for eating or performing various manipulations of objects resting on a table;
presence or absence of drawers;
expansion of the surface by insertion of leaves or locking hinged drop leaf sections into horizontal position.
Desks are tables specifically intended for information-manipulation tasks, including writing and use of interactive electronics.
Tables of various shapes, heights, and sizes are designed for specific uses:
Dining room tables are designed to be used for formal dining.
Bedside tables, nightstands, or night tables are small tables used in a bedroom. They are often used for convenient placement of a small lamp, alarm clock, glasses, or other personal items.
Gateleg tables have one or two hinged leaves supported by hinged legs.
Coffee tables are low tables designed for use in a living room, in front of a sofa, for convenient placement of drinks, books, or other personal items.
Refectory tables are long tables designed to seat many people for meals.
Drafting tables usually have a top that can be tilted for making a large or technical drawing. They may also have a ruler or similar element integrated.
Workbenches are sturdy tables, often elevated for use with a high stool or while standing, which are used for assembly, repairs, or other precision handwork.
Nested tables are a set of small tables of graduated size that can be stacked together, each fitting within the one immediately larger. They are for occasional use (such as a tea party), hence the stackable design." [Table (furniture). Wikipedia]
The shapes library Tables is provided by the Floor Plans solution from the Building Plans area of ConceptDraw Solution Park.
Visual Presentations Made Easy with Diagramming Software
Automatically create a presentation-quality diagram in one click with ConceptDraw PRO.
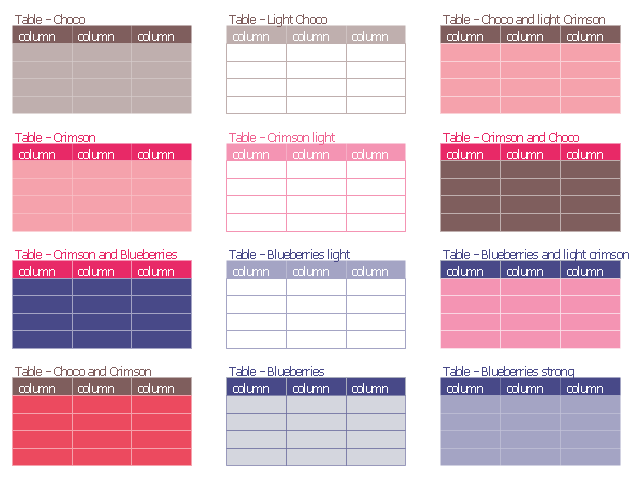
The vector stencils library "Tables" contains 12 table blocks. Use it to add typography elements into your infographics.
"A table is a means of arranging data in rows and columns. The use of tables is pervasive throughout all communication, research and data analysis. Tables appear in print media, handwritten notes, computer software, architectural ornamentation, traffic signs and many other places. The precise conventions and terminology for describing tables varies depending on the context. Further, tables differ significantly in variety, structure, flexibility, notation, representation and use. In books and technical articles, tables are typically presented apart from the main text in numbered and captioned floating blocks." [Table (information). Wikipedia]
The example "Design elements - Tables" was created using the ConceptDraw PRO diagramming and vector drawing software extended with the Typography Infographics solition from the area "What is infographics" in ConceptDraw Solution Park.
Entity Relationship Diagram - ERD - Software for Design Crows Foot ER Diagrams
ER-model is a data model which lets describe the conceptual schemes in a specific subject area. It can help to highlight the key entities and specify relationships that can be established between these entities. During the database design, it is realized the transformation of ER model into certain database scheme based on the chosen data model (relational, object, network, etc.). There are used two notations for ERDs: Crow's Foot and Chen's. Crow's Foot notation proposed by Gordon Everest represents the entity by rectangle containing its name (name must be unique within this model), and relation - by the line which links two entities involved in relationship. The relationship's plurality is graphically indicated by a "plug" on the end of the link, the optionality - by a circle. Entity-Relationship Diagrams based on Crow's Foot notation can be easily drawn using the ConceptDraw PRO. Extended with Entity-Relationship Diagram (ERD) solution, it is the best ERD diagrams software with powerful tools and ready design elements for Crow's Foot and Chen notations.
Interior Design Office Layout Plan Design Element
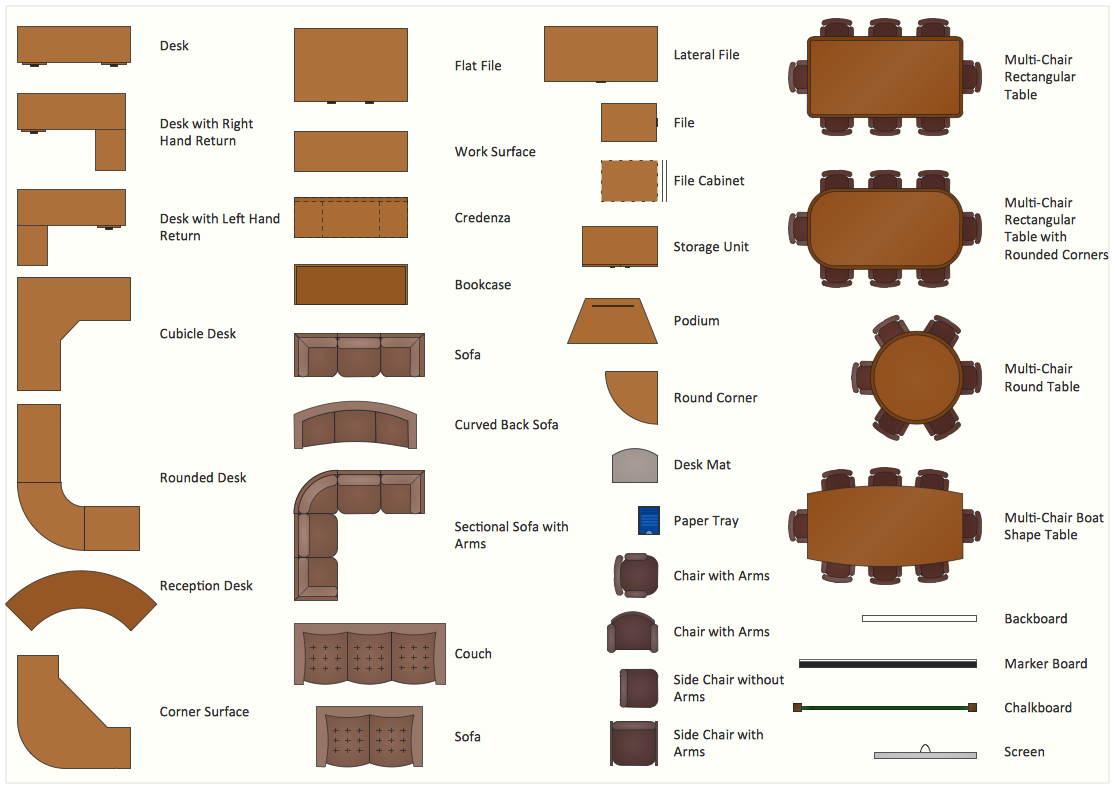
Lucky interior design is an integral part of succesful work at office. The important challenge in office design planning is to find a balance between two main office activities: concentration and communication. Primarily you need to determine with a type of office space, this can be an open space or separate rooms. The first type is more suitable for communication and rapid interaction. That's why open offices and combined spaces are modern types of work space and often used, especially for private offices. Traditional office basically represents separate rooms arranged along the corridor. It is applied for the companies with small number of people or for enterprises divided on separate departments, and is practically inapplicable for teamwork. ConceptDraw PRO diagramming and vector drawing software extended with Office Layout Plans solution offers a lot of vector stencils libraries with design elements of office furniture and equipment for effective office interior design and office space planning, for easy creation Office Floor Plans and Office Layout Plans. Use ConceptDraw PRO to visualize process flowcharts, network architecture and program workflows like Visio for Mac and even more. The software can be used with different fields like business, engineering and construction, etc.
Process Flowchart
The main reason of using Process Flowchart or PFD is to show relations between major parts of the system. Process Flowcharts are used in process engineering and chemical industry where there is a requirement of depicting relationships between major components only and not include minor parts. Process Flowcharts for single unit or multiple units differ in their structure and implementation. ConceptDraw PRO is Professional business process mapping software for making Process flowcharts, Process flow diagram, Workflow diagram, flowcharts and technical illustrations for business documents and also comprehensive visio for mac application. Easier define and document basic work and data flows, financial, production and quality management processes to increase efficiency of your business with ConcepDraw PRO. Business process mapping software with Flowchart Maker ConceptDraw PRO includes extensive drawing tools, rich examples and templates, process flowchart symbols and shape libraries, smart connectors that allow you create the flowcharts of complex processes, process flow diagrams, procedures and information exchange. Process Flowchart Solution is project management workflow tools which is part ConceptDraw Project marketing project management software. Drawing charts, diagrams, and network layouts has long been the monopoly of Microsoft Visio, making Mac users to struggle when needing such visio alternative like visio for mac, it requires only to view features, make a minor edit to, or print a diagram or chart. Thankfully to MS Visio alternative like ConceptDraw PRO software, this is cross-platform charting and business process management tool, now visio alternative for making sort of visio diagram is not a problem anymore however many people still name it business process visio tools.
- Draw Periodic Table And Label
- Draw A Well Label Diagram Of Periodic Table
- Draw The Periodic Table And Label The Element
- Periodic Table Drawing On Chart
- Draw A Large Labeled Diagram Of A Periodic Table Of Elements
- Chemistry Symbols and Meanings | Diagram Of The Periodic Table ...
- Chemistry | How to Draw Chemistry Structures | Chemistry Drawing ...
- How To Draw Modern Periodic Table
- Draw A Model Of Modern Periodic Table
- Periodic Table Draw
- Draw A Chart Of Periodic Table
- Diagram Of Modern Periodic Table
- Draw A Chart Of The Periodic Table
- Draw A Clearly And Complete Periodic Table
- Diagram Of Modern Periodic Table Download
- Chemistry | How To Draw Dfd Of Periodic Table
- Drawing Of Table Of Elements
- How To Share Presentation via Skype | How to Draw Chemistry ...
- Draw A Standard Periodic Table
- Chemistry | Chemistry Drawing Software | Chemistry Drawings ...





_Win_Mac.png)
