Program Structure Diagram
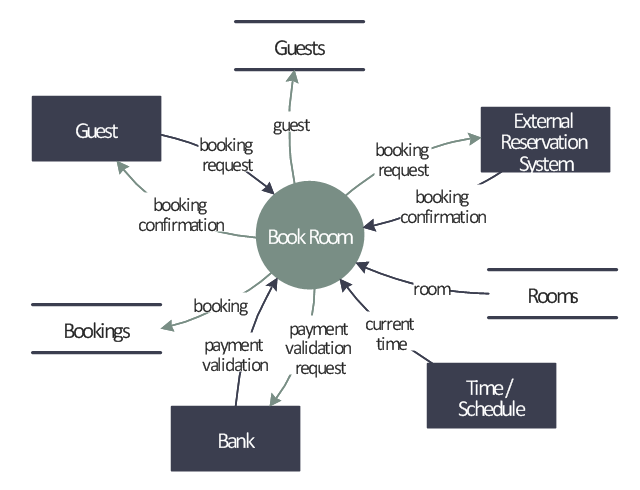
Program Structure Diagram - The Software Development solution from ConceptDraw Solution Park provides the stensils libraries of language level shapes and memory objects for drawing the structural diagrams of programs and memory objects using the ConceptDraw DIAGRAM diagramming and vector drawing software.This example was redesigned from the Wikipedia file: LastResortHotel BookRoom Process.png. [en.wikipedia.org/ wiki/ File:LastResortHotel_ BookRoom_ Process.png]
This file is licensed under the Creative Commons Attribution-ShareAlike 3.0 License. [creativecommons.org/ licenses/ by-sa/ 3.0/ ]
"Event partitioning is an easy-to-apply systems analysis technique that helps the analyst organize requirements for large systems into a collection of smaller, simpler, minimally-connected, easier-to-understand ‘mini systems’ / use cases. ...
Defining requirements.
Single process in a fictitious hotel using data flow diagram notation.
Single use case in a fictitious hotel using use case diagram notation.
This approach helps the analyst to decompose the system into ‘mentally bite-sized’ mini-systems using events that require a planned response. The level of detail of each response is at the level of ‘primary use cases’. Each planned response may be modelled using DFD notation or as a single use case using use case diagram notation.
The basic flow within a process or use case can usually be described in a relatively small number of steps, often fewer than twenty or thirty, possibly using something like ‘structured English’. Ideally, all of the steps would be visible all at once (often a page or less). The intention is to reduce one of the risks associated with short-term memory, namely, forgetting what is not immediately visible (‘out of sight, out of mind’). ...
Single process in a fictitious hotel using data flow diagram notation." [Event partitioning. Wikipedia]
The DFD example "Last resort hotel book room process" was created using the ConceptDraw PRO diagramming and vector drawing software extended with the Data Flow Diagrams solution from the Software Development area of ConceptDraw Solution Park.
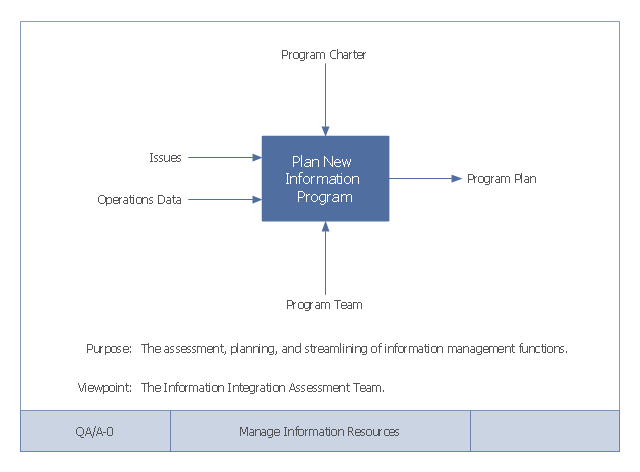
This example of a Top Level Context Diagram for an information system management process was redesigned from the Wikipedia file: IDEF Top-Level Context Diagram.jpg. [en.wikipedia.org/ wiki/ File:IDEF_ Top-Level_ Context_ Diagram.jpg]
"Graphical notation.
IDEF0 is a model that consists of a hierarchical series of diagrams, text, and glossary cross referenced to each other. The two primary modeling components are:
(1) functions (represented on a diagram by boxes), and
(2) data and objects that interrelate those functions (represented by arrows).
... the position at which the arrow attaches to a box conveys the specific role of the interface. The controls enter the top of the box. The inputs, the data or objects acted upon by the operation, enter the box from the left. The outputs of the operation leave the right-hand side of the box. Mechanism arrows that provide supporting means for performing the function join (point up to) the bottom of the box.
The IDEF0 process.
The IDEF0 process starts with the identification of the prime function to be decomposed. This function is identified on a “Top Level Context Diagram,” that defines the scope of the particular IDEF0 analysis. ... From this diagram lower-level diagrams are generated." [IDEF0. Wikipedia]
The IDEF0 diagram example "Top-level context diagram" was created using the ConceptDraw PRO diagramming and vector drawing software extended with the IDEF0 Diagrams solution from the Software Development area of ConceptDraw Solution Park.
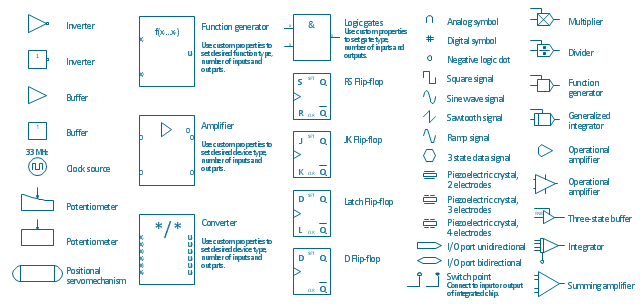
The vector stencils library "Analog and digital logic" contains 40 element symbols of logic (threshold) gates, bistable current switches, current controllers, regulators, electrical generators, and amplifiers.
Use it for drawing the digital and analog functions in electronic circuit diagrams and electrical schematics.
"Analogue electronics (or analog in American English) are electronic systems with a continuously variable signal, in contrast to digital electronics where signals usually take only two different levels. The term "analogue" describes the proportional relationship between a signal and a voltage or current that represents the signal." [Analogue electronics. Wikipedia]
"Digital electronics, or digital (electronic) circuits, represent signals by discrete bands of analog levels, rather than by a continuous range. All levels within a band represent the same signal state. Relatively small changes to the analog signal levels due to manufacturing tolerance, signal attenuation or parasitic noise do not leave the discrete envelope, and as a result are ignored by signal state sensing circuitry.
In most cases the number of these states is two, and they are represented by two voltage bands: one near a reference value (typically termed as "ground" or zero volts) and a value near the supply voltage, corresponding to the "false" ("0") and "true" ("1") values of the Boolean domain respectively.
Digital techniques are useful because it is easier to get an electronic device to switch into one of a number of known states than to accurately reproduce a continuous range of values.
Digital electronic circuits are usually made from large assemblies of logic gates, simple electronic representations of Boolean logic functions." [Digital electronics. Wikipedia]
The example "Design elements - Analog and digital logic" was drawn using the ConceptDraw PRO diagramming and vector drawing software extended with the Electrical Engineering solution from the Engineering area of ConceptDraw Solution Park.
UML Diagram Tool
The UML diagrams are widely used and creating them is useful to apply the automated UML diagram tool. ConceptDraw DIAGRAM diagramming and vector drawing software extended with Rapid UML Solution from the Software Development Area is a powerful UML diagram tool.Venn Diagram Examples for Problem Solving. Venn Diagram as a Truth Table
Venn diagrams are illustrations used in the branch of mathematics known as set theory. They show the mathematical or logical relationship between different groups of things (sets). A Venn diagram shows all the possible logical relations between the sets.Gane Sarson Diagram
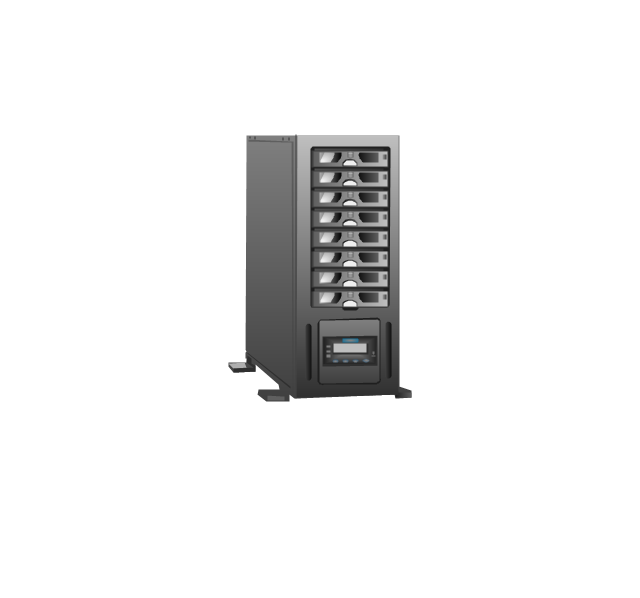
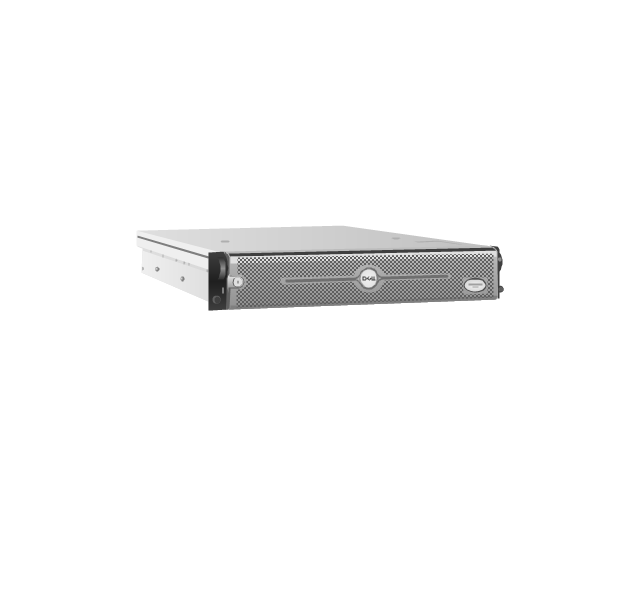
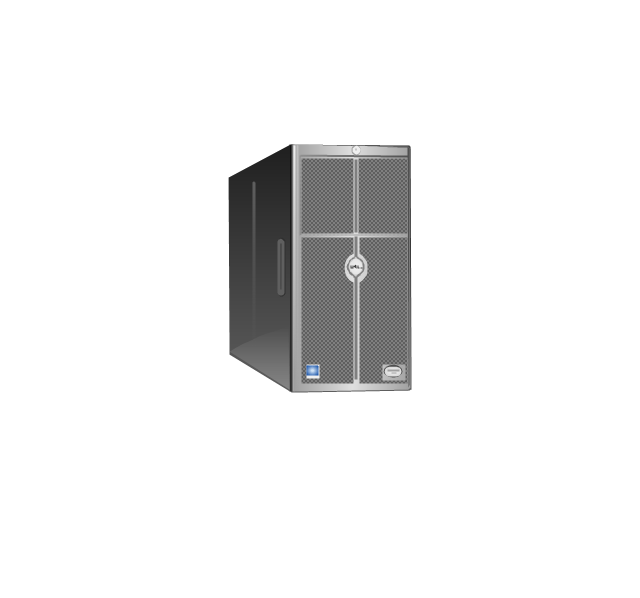
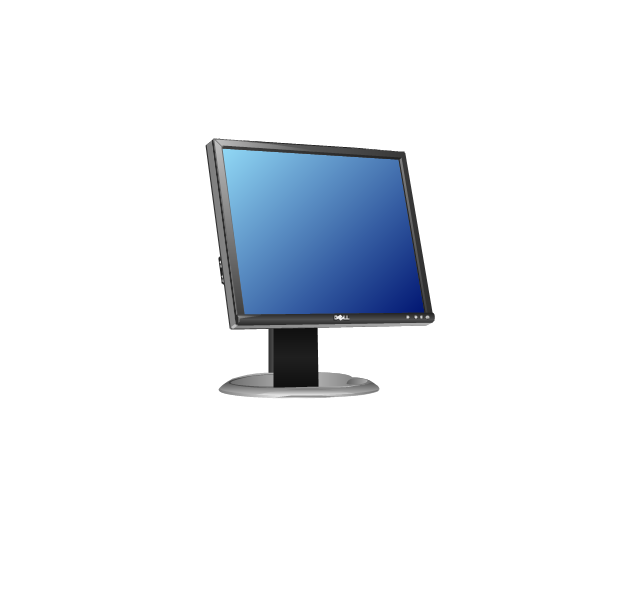
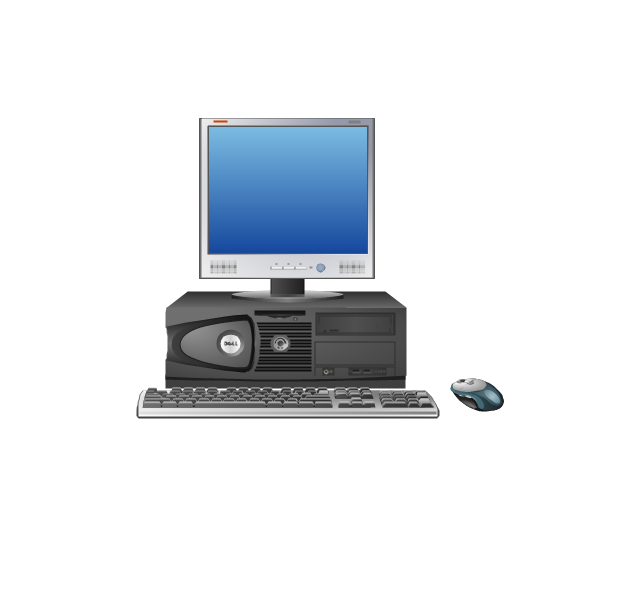
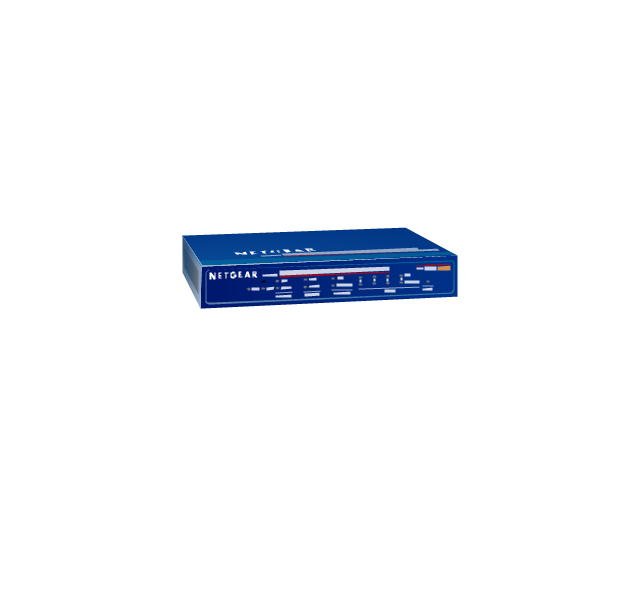
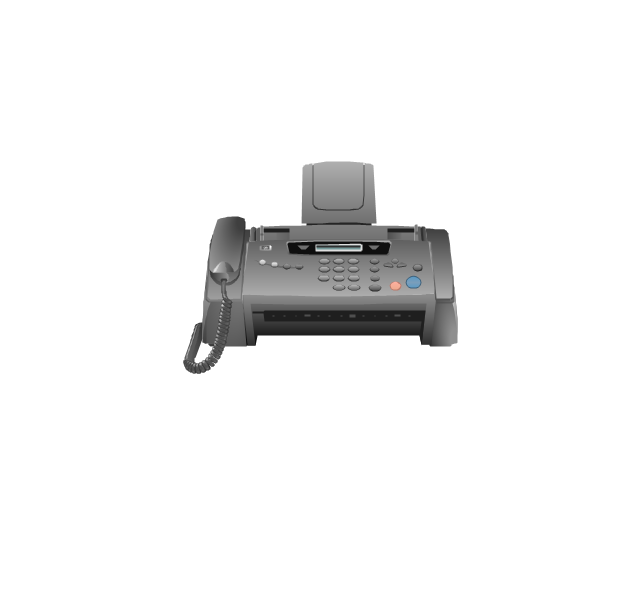
The Gane-Sarson methodology uses the graphical techniques for building the logical models for the systems. It is helpful for analysts and designers to make common and clear picture of the system, to depict all its processes and how they transform the data. The Gane-Sarson methodology lets represent all this information in a way understandable for the users and other interested people, and gives the possibility to see instantly how the system's parts serve together to meet their needs. This methodology supposes the building of a system top-down. First you need create an overall system data flow, then determine the details of the data structures, the process logic and design the modular structures. ConceptDraw DIAGRAM diagramming and vector drawing software offers the Data Flow Diagrams solution with Gane-Sarson Notation library rich for the specific symbols of the Gane-Sarson notation. All they are vector and fully ready-to-use for drawing the Data Flow Diagrams, which will be then successfully used in presentations, websites, and various business documents.The vector stencils library "Computer network" contains 51 symbols of computer network devices and equipment for drawing computer network diagrams.
"Network Mapping Software.
A number of software tools exist to design computer network diagrams / or generate visual maps of networks, servers, storage, services, data centers, and other peripherals. Broadly, there are two types of software tools - those that help create diagrams manually and those that generate them using automated / semi-automated approaches.
Type of Software.
(1) Manual - allows users to design and draw logical and physical topology diagrams by manually placing icons and connections.
(2) Automated - generate topology diagrams / maps by traversing the network and automatically discovering resident devices or by importing network data." [Comparison of network diagram software. Wikipedia]
ConceptDraw PRO is the software for manual design of computer network diagrams. The solutions of the Computer and Networks area in ConceptDraw Solution Park extend ConceptDraw PRO with vector stencils libraries, templates and examples for creating the computer network diagrams.
The symbols example "Computer network - Vector stencils library" was created using the ConceptDraw PRO diagramming and vector drawing software extended with the Computer and Networks solution from the Computer and Networks area of ConceptDraw Solution Park.
www.conceptdraw.com/ solution-park/ computer-and-networks
Draw Flowcharts with ConceptDraw
Start design your own flowchart with ConceptDraw DIAGRAM and accomplish great results at the moment.Visualize Stakeholder Analysis
Stakeholder analysis in conflict resolution, project management, and business administration, is the process of identifying the individuals or groups that are likely to affect or be affected by a proposed action, and sorting them according to their impact on the action and the impact the action will have on them. Use the ConceptDraw DIAGRAM diagramming and vector drawing software enhanced with powerful tools of Stakeholder Onion Diagrams Solution from the Management Area of ConceptDraw Solution Park to easy and effectively visualize stakeholder analysis.Venn Diagram Examples for Problem Solving. Computer Science. Chomsky Hierarchy
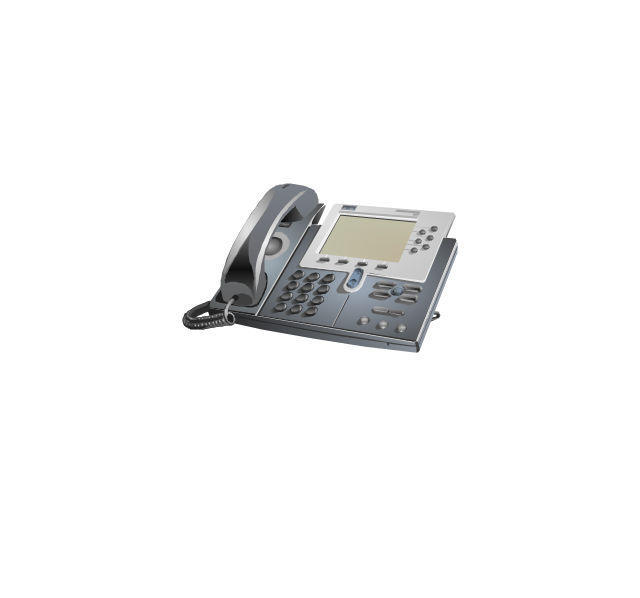
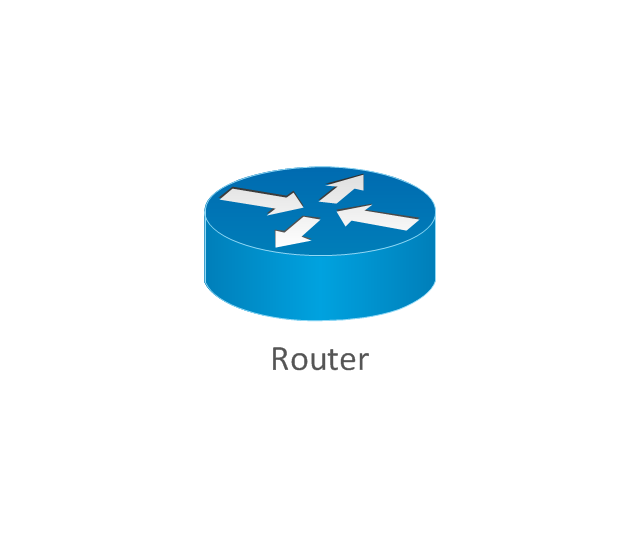
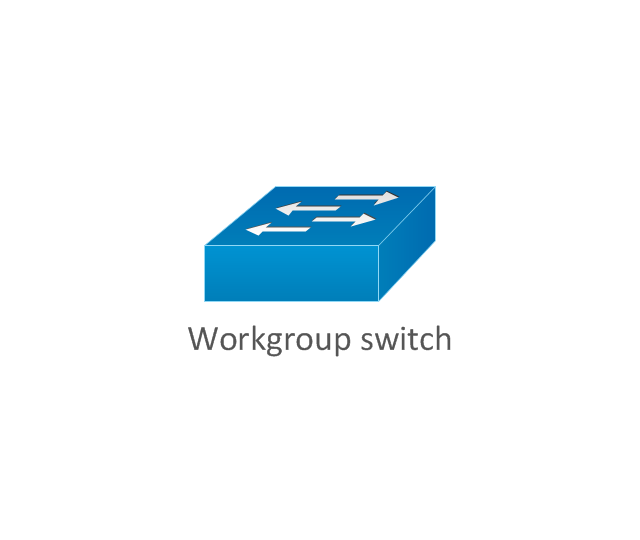
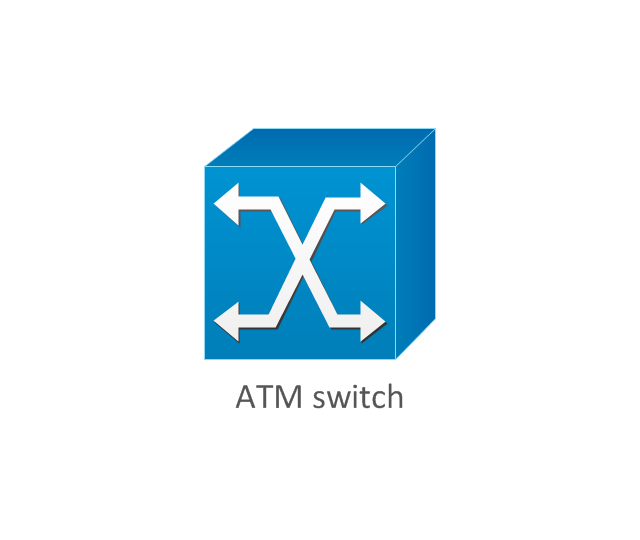
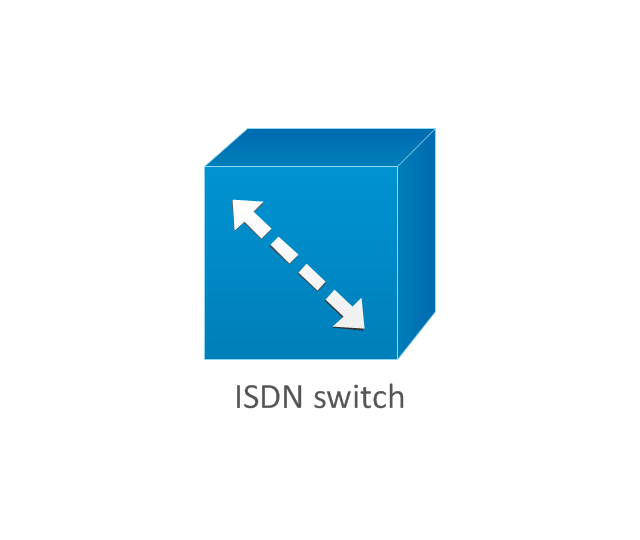
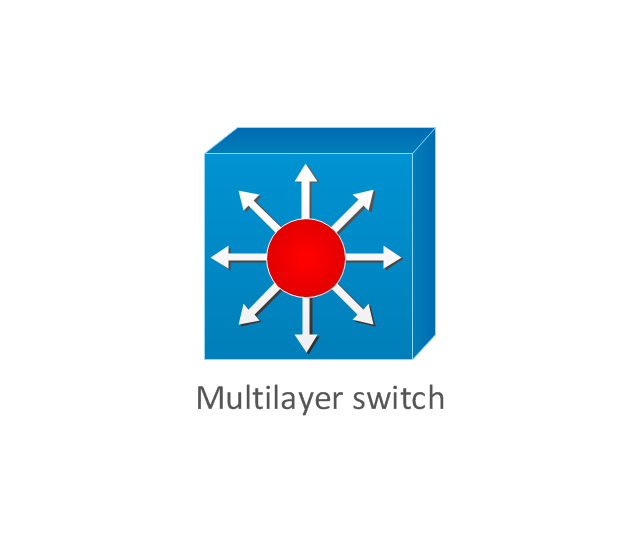
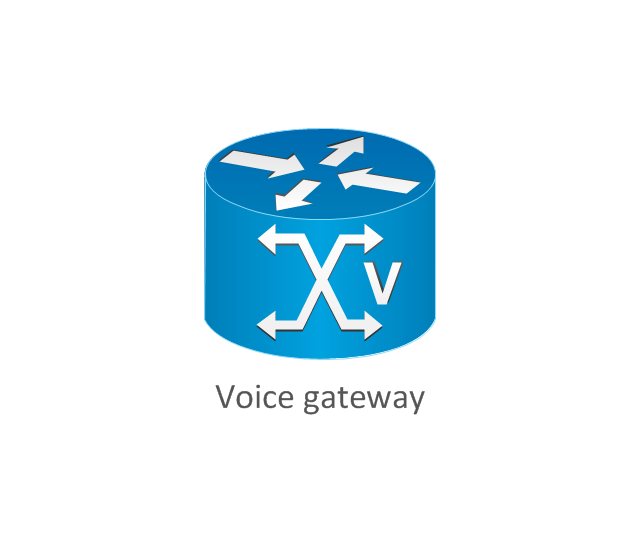
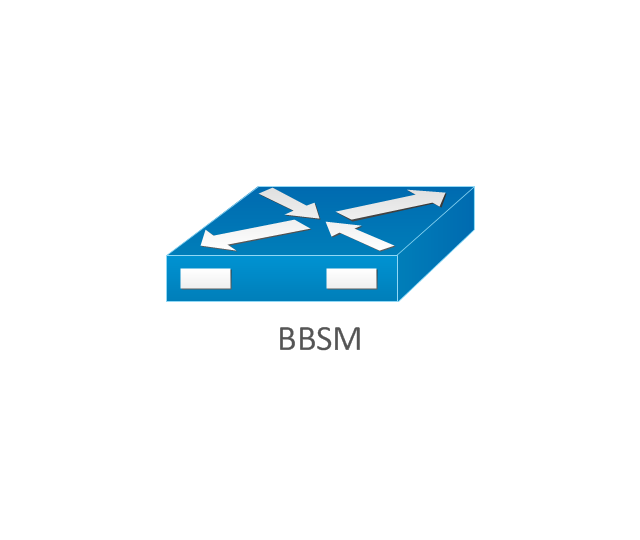
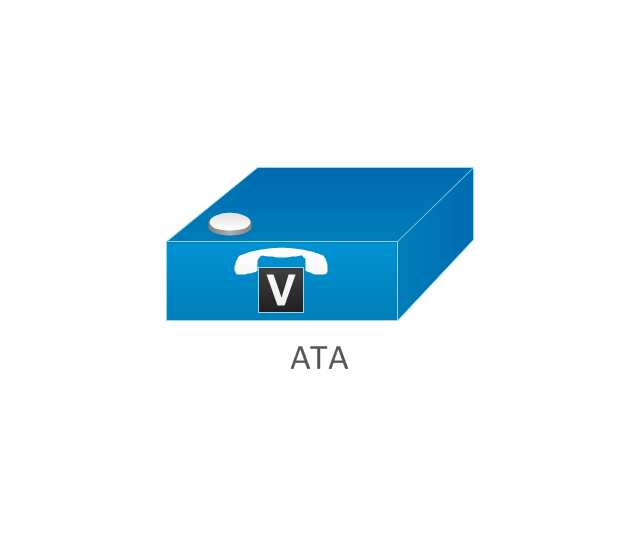
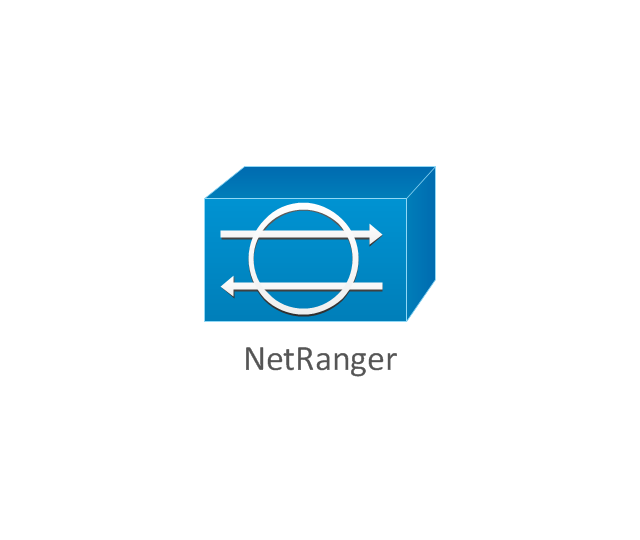
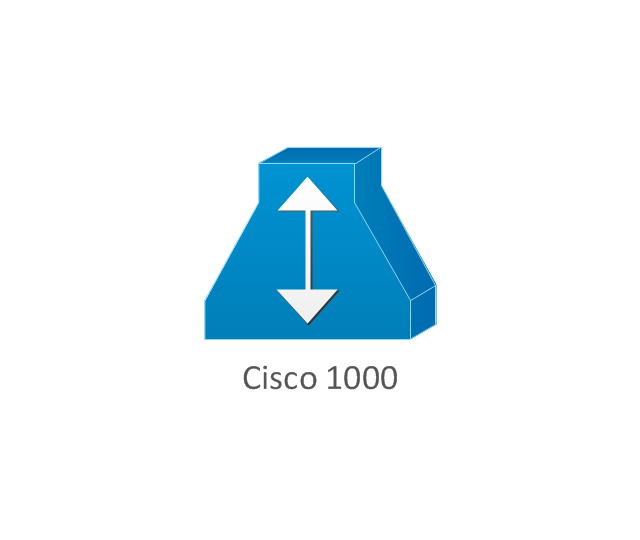
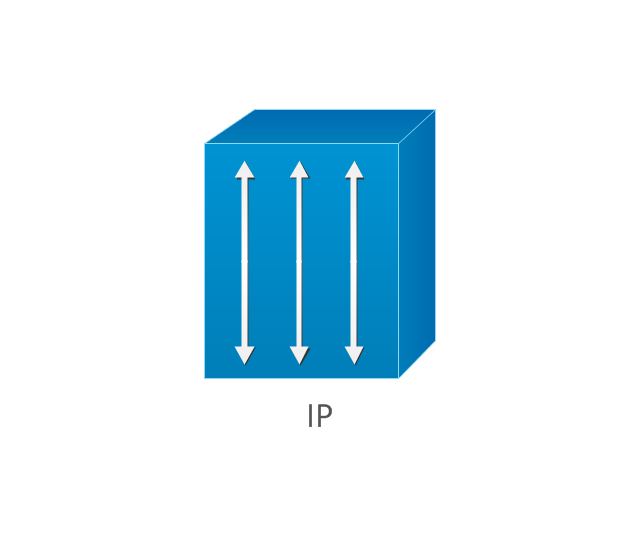
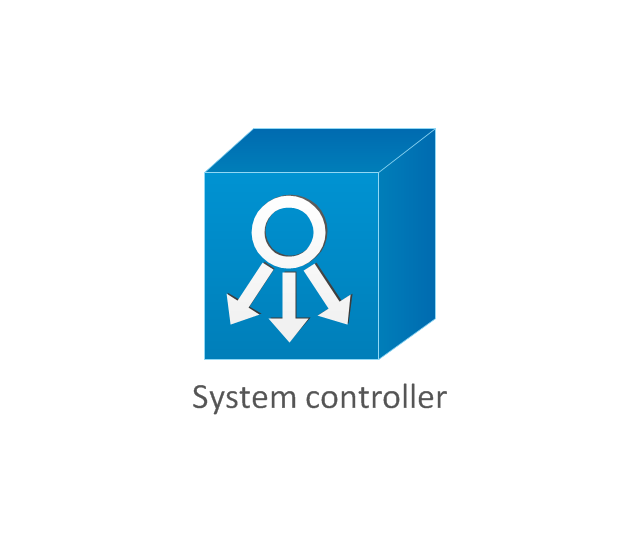
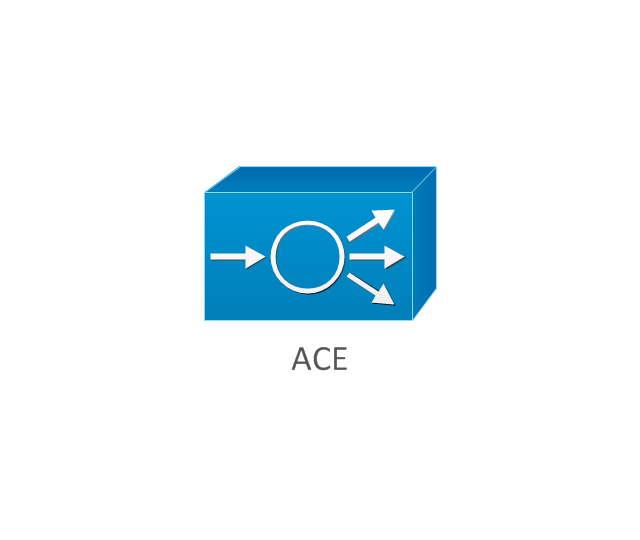
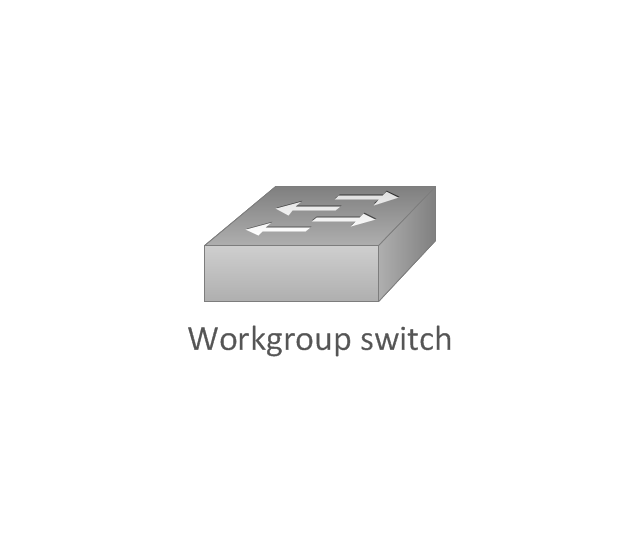
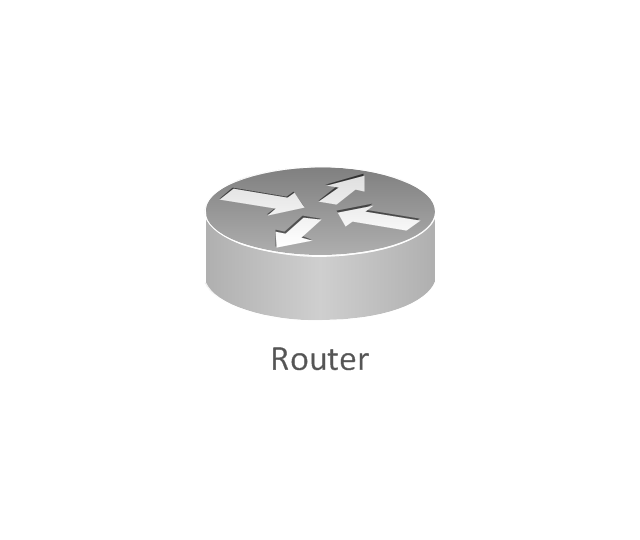
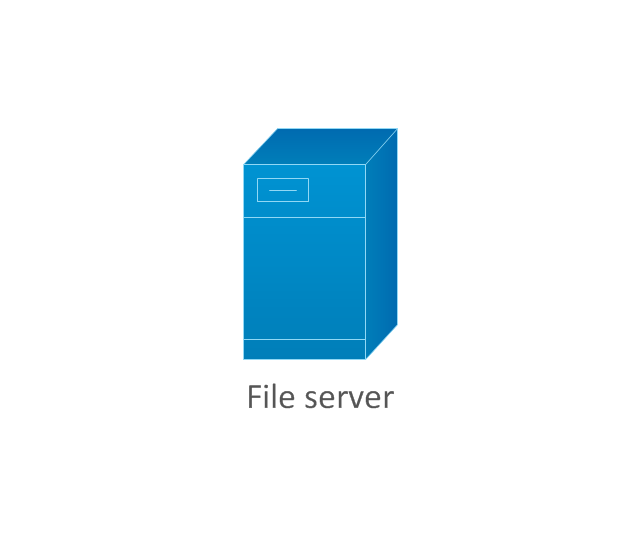
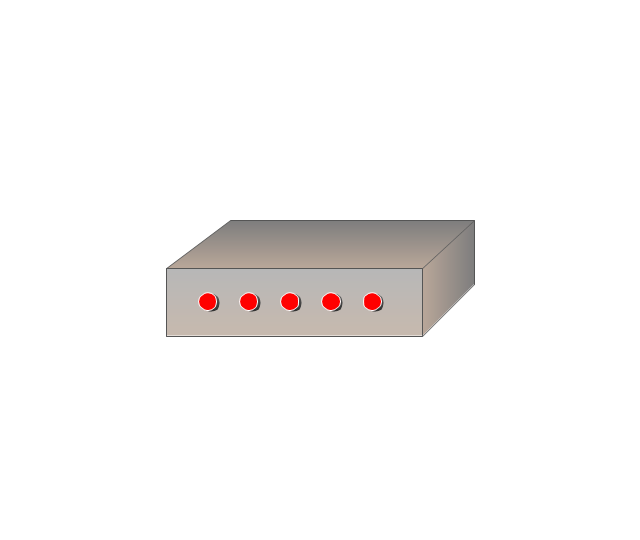
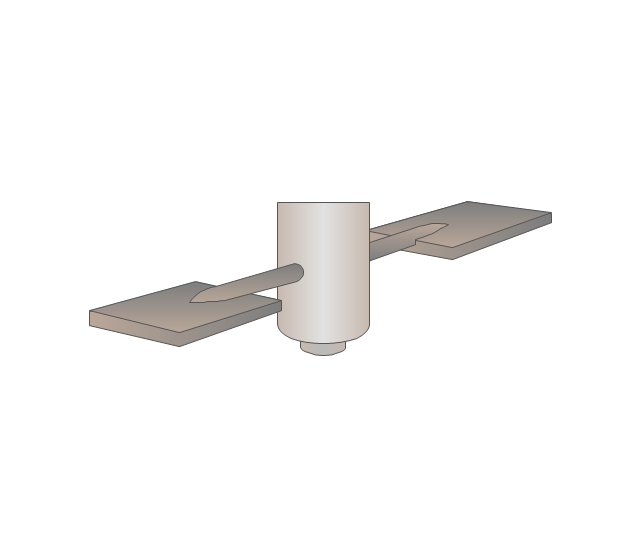
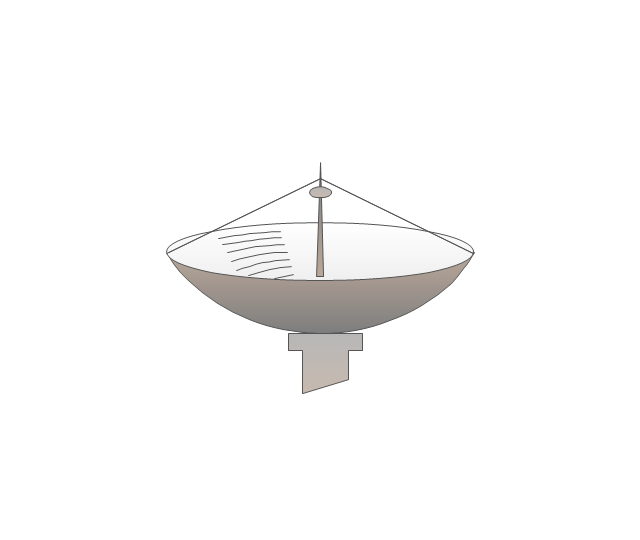
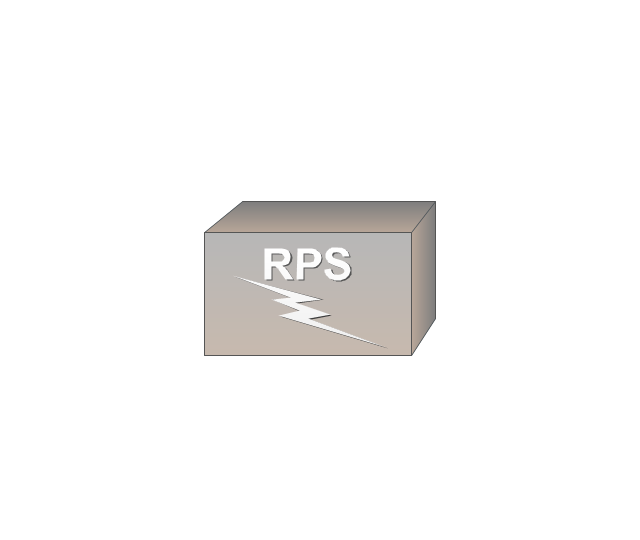
A Venn diagram, sometimes referred to as a set diagram, is a diagramming style used to show all the possible logical relations between a finite amount of sets. In mathematical terms, a set is a collection of distinct objects gathered together into a group, which can then itself be termed as a single object. Venn diagrams represent these objects on a page as circles or ellipses, and their placement in relation to each other describes the relationships between them. The Venn diagram example below visualizes the the class of language inclusions described by the Chomsky hierarchy.The vector stencils library "Cisco network topology" contains 89 symbols of Cisco network devices and design elements for drawing computer network topology diagrams.
"There are two basic categories of network topologies:
(1) Physical topologies,
(2) Logical topologies.
The shape of the cabling layout used to link devices is called the physical topology of the network. This refers to the layout of cabling, the locations of nodes, and the interconnections between the nodes and the cabling. The physical topology of a network is determined by the capabilities of the network access devices and media, the level of control or fault tolerance desired, and the cost associated with cabling or telecommunications circuits.
The logical topology in contrast, is the way that the signals act on the network media, or the way that the data passes through the network from one device to the next without regard to the physical interconnection of the devices." [Network topology. Wikipedia]
The symbols example "Cisco network topology - Vector stencils library" was created using the ConceptDraw PRO diagramming and vector drawing software extended with the Cisco Network Diagrams solution from the Computer and Networks area of ConceptDraw Solution Park.
www.conceptdraw.com/ solution-park/ computer-networks-cisco
The vector stencils library "Business process BPMN 1.2 (Rapid Draw)" contains 12 symbols of objects, roles swimlanes, and task icons for creating the business process diagrams using the ConceptDraw PRO diagramming and vector drawing software.
"BPMN models consist of simple diagrams constructed from a limited set of graphical elements. For both business users and developers, they simplify understanding business activities' flow and process. BPMN's four basic element categories are:
(1) Flow objects.
Events, activities, gateways.
(2) Connecting objects.
Sequence flow, message flow, association
(3) Swim lanes.
Pool, lane.
(4) Artifacts.
Data object, group, annotation.
These four categories enable creation of simple business process diagrams (BPDs). BPDs also permit making new types of flow object or artifact, to make the diagram more understandable. ...
Task.
A task represents a single unit of work that is not or cannot be broken down to a further level of business process detail without diagramming the steps in a procedure (which is not the purpose of BPMN)." [Business Process Model and Notation. Wikipedia]
The shapes example "Design elements - Business process BPMN 1.2 (Rapid Draw)" is included in the Business Process Diagram solution from the Business Processes area of ConceptDraw Solution Park.
 Business Process Workflow Diagrams
The Business Process Workflow Diagrams solution enhances the ConceptDraw DIAGRAM functionality with predesigned examples, samples and a numerous collection of predesigned vector objects of workflow chart elements, icons, arrows, connectors, and varied wor
Block Diagram Creator
A block diagram is a diagram of a system in which the principal parts or functions are represented by blocks connected by lines that show the relationships of the blocks. ConceptDraw DIAGRAM diagramming and vector drawing software extended with Block Diagrams Solution from the "Diagrams" Area is a powerful Block Diagram Creator.Metropolitan area networks (MAN). Computer and Network Examples
A Metropolitan Area Network (MAN) is a great computer network located on the large geographical area or region. It is a network bigger than Local Area Network (LAN), but territorially smaller than Wide Area Network (WAN), its diameter usually ranges from 5 to 50 kilometers. MAN usually includes several buildings or even the whole city (metropolis). It is based on high data rate compounds using the fiber channels and other digital data transmission channels. MAN includes a lot of communicating devices, for its construction are used multiple routers, switches and hubs. MAN can combine together several Local Area Networks or Campus Area Networks located in different buildings within a city and provides the Internet connectivity for them. Solutions included to Computer and Networks Area for ConceptDraw Solution Park are the real godsend for those who want design Computer Network Diagrams, and among others the Metropolitan Area Network Diagrams. They offer the libraries with ready-to-use vector design elements, professional-looking examples, samples and templates.
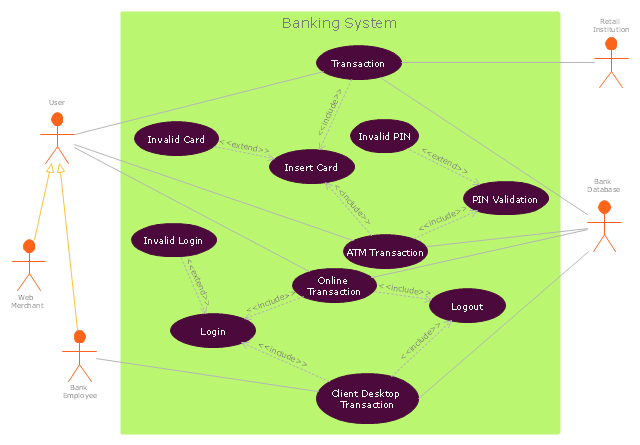
"Banks offer many different channels to access their banking and other services:
(1) Automated Teller Machines.
(2) A branch is a retail location.
(3) Call center.
(4) Mail: most banks accept cheque deposits via mail and use mail to communicate to their customers, e.g. by sending out statements.
(5) Mobile banking is a method of using one's mobile phone to conduct banking transactions.
(6) Online banking is a term used for performing multiple transactions, payments etc. over the Internet.
(7) Relationship Managers, mostly for private banking or business banking, often visiting customers at their homes or businesses.
(8) Telephone banking is a service which allows its customers to conduct transactions over the telephone with automated attendant or when requested with telephone operator.
(9) Video banking is a term used for performing banking transactions or professional banking consultations via a remote video and audio connection. Video banking can be performed via purpose built banking transaction machines (similar to an Automated teller machine), or via a video conference enabled bank branch clarification.
(10) DSA is a Direct Selling Agent, who works for the bank based on a contract. Its main job is to increase the customer base for the bank." [Bank. Wikipedia]
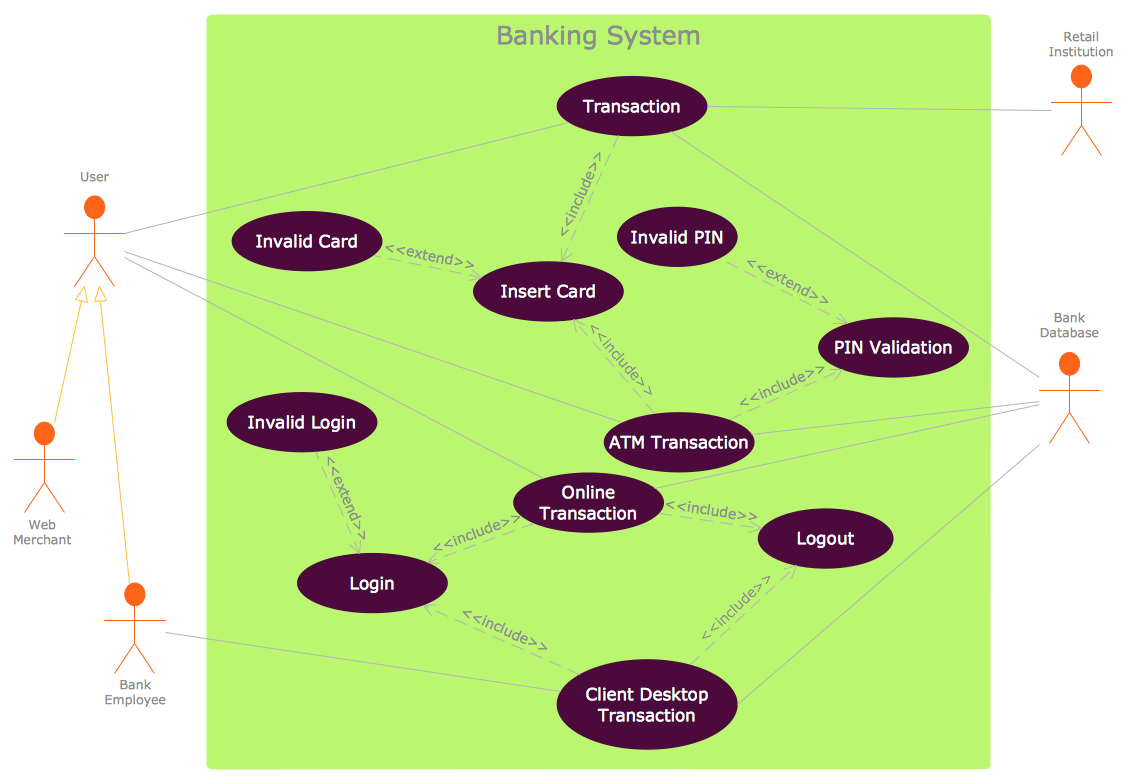
The UML use case diagram example "Banking system" was created using the ConceptDraw PRO diagramming and vector drawing software extended with the Rapid UML solution from the Software Development area of ConceptDraw Solution Park.
 Entity-Relationship Diagram (ERD)
An Entity-Relationship Diagram (ERD) is a visual presentation of entities and relationships. That type of diagrams is often used in the semi-structured or unstructured data in databases and information systems. At first glance ERD is similar to a flowch
Diagramming Software for Design UML Communication Diagrams
UML Communication Diagram depicts the interactions between objects or parts in terms of sequenced messages and describes both the static structure and dynamic behavior of a system.
This vector stencils library contains 195 cloud computing icons.
Use it to design cloud computing infographic and diagrams with ConceptDraw PRO software.
"Cloud computing, also on-demand computing, is a kind of Internet-based computing that provides shared processing resources and data to computers and other devices on demand. It is a model for enabling ubiquitous, on-demand access to a shared pool of configurable computing resources (e.g., networks, servers, storage, applications and services), which can be rapidly provisioned and released with minimal management effort. Cloud computing and storage solutions provide users and enterprises with various capabilities to store and process their data in third-party data centers.
Cloud computing has become a highly demanded service or utility due to the advantages of high computing power, cheap cost of services, high performance, scalability, accessibility as well as availability." [Cloud computing. Wikipedia]
The vector stencils library "Cloud clipart" is included in the Cloud Computing Diagrams solution from the Computer and Networks area of ConceptDraw Solution Park.
- Data Flow Diagram Symbols. DFD Library | Pyramid Chart Examples ...
- Data Flow Diagram Wiki
- Account Flowchart. Flowchart Examples | Audit planning flowchart ...
- Data flow diagram (DFD) - Payment for goods using UPS code ...
- Last resort hotel book room process - DFD | Level 1 Dfd Resort ...
- Last resort hotel book room process - DFD | DFD - Process of ...
- Different Between The Context Level And Zero Level Diagrams
- Last resort hotel book room process - DFD | Data Flow Diagrams ...
- DFD Library System | Ventilation unit with heat pump and ground ...
- Top- level context diagram | IDEF0 Diagrams | Process Flowchart ...
- Data Flow Diagram For Room Reservation
- 4 Level pyramid model diagram - Information systems types | 5 Level ...
- Last resort hotel book room process - DFD | Data Flow Diagrams ...
- Last resort hotel book room process - DFD | Data Flow Diagrams ...
- Program Structure Diagram | Cross Functional Flowchart for ...
- Context Diagram And Level 0 Dfd
- Example of DFD for Online Store ( Data Flow Diagram ) | Context ...
- Top- level context diagram | Project tasks dashboard | Managing the ...
- What Is Dfd Level 0
- Example of DFD for Online Store ( Data Flow Diagram ) DFD ...


























-cisco-network-topology---vector-stencils-library.png--diagram-flowchart-example.png)
-cisco-network-topology---vector-stencils-library.png--diagram-flowchart-example.png)


-cisco-network-topology---vector-stencils-library.png--diagram-flowchart-example.png)

-cisco-network-topology---vector-stencils-library.png--diagram-flowchart-example.png)







-cisco-network-topology---vector-stencils-library.png--diagram-flowchart-example.png)





.png--diagram-flowchart-example.png)




-cloud-clipart---vector-stencils-library.png--diagram-flowchart-example.png)
-cloud-clipart---vector-stencils-library.png--diagram-flowchart-example.png)


-cloud-clipart---vector-stencils-library.png--diagram-flowchart-example.png)


-cloud-clipart---vector-stencils-library.png--diagram-flowchart-example.png)
-cloud-clipart---vector-stencils-library.png--diagram-flowchart-example.png)


