 ConceptDraw Solution Park
ConceptDraw Solution Park collects graphic extensions, examples and learning materials
HelpDesk
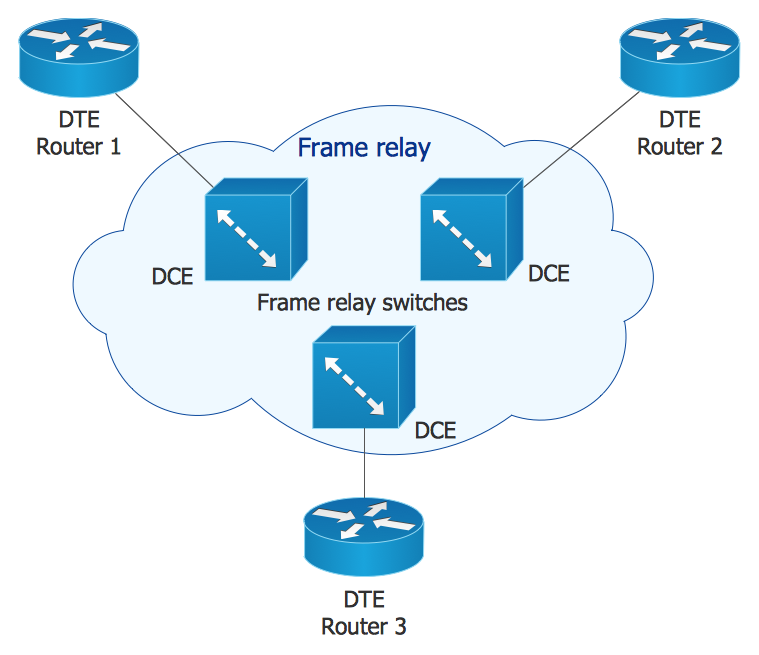
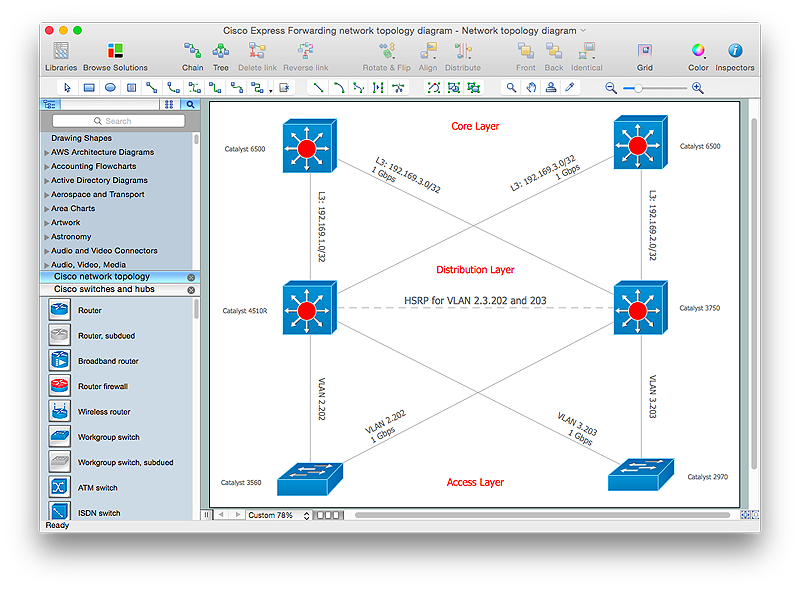
How to Create Cisco Network Diagram Using ConceptDraw Libraries
Cisco Network chart can be a great start for detailed network documentation, as well as serve as a visual instruction for new IT staff, or as a detailed illustration for a presentation. The easiest way to design Cisco Network diagram using standard Cisco product symbols is using ConceptDraw PRO powered by Cisco Network Diagrams solution. The Cisco Network Diagrams solution uses Cisco network symbols and icons to to visually document the Cisco network topology and design of Cisco network diagrams. Using ConceptDraw libraries you can access a wide array of Cisco network icons, so you can quickly prototype a new network or document an existing one.HelpDesk
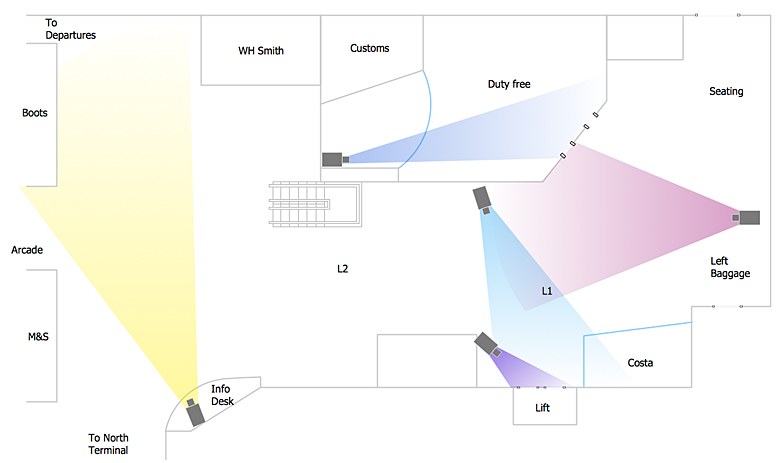
How to Create a CCTV Diagram in ConceptDraw PRO
CCTV (Closed circuit television) diagram is used to depict a system of video monitoring. The CCTV diagram provides video cameras placement strategy. CCTV diagram should include the scheme of strategic placement of video cameras, which capture and transmit videos to either a private network of monitors for real-time viewing, or to a video recorder for later reference. CCTV is commonly used for surveillance and security purposes. Using ConceptDraw PRO with the Security and Access Plans Solution lets you create professional looking video surveillance CCTV system plans, security plans, and access schemes.HelpDesk
How To Create a PERT Chart
Project Evaluation and Review Technique (PERT) is a method of project tasks evaluation and analysis. PERT - is a method of analyzing the tasks required to complete the project. It includes analysis of the time required to complete each task, as well as the determination of the time required to carry out the whole project. PERT was developed to facilitate the planning of huge and complex projects. PERT is used for very large, complex, and non-standard projects. Technology implies the presence of uncertainty, making it possible to develop a schedule of the project without a precise information on details and time required for all of its components. The most popular part of PERT is a method of the critical path, based on the construction of the network schedule (PERT network diagram). ConceptDraw Office delivers you the best way to create PERT chart for your project using compatibility between ConceptDraw PROJECT and ConceptDraw PRO.HelpDesk
How to Draw a Gantt Chart Using ConceptDraw PRO
A Gantt chart is intended to provide a visualization of a project schedule. It is developed to help planning, coordinating, and tracking on project tasks implementation. One of the most critical resources for a project implementation is a time resources. Gantt chart - is one of the most convenient and popular way of graphical representation of a project tasks progress in conjunction with the corresponding time consumption. Gantt chart's function is to show project tasks completion in a progress, and to make a project manager sure that project tasks were completed on time. ConceptDraw Office is a clear and easy-to-use tool for project management. It is a very handy visual tool that helps make a project processing clear.
 Computer and Networks Area
The solutions from Computer and Networks Area of ConceptDraw Solution Park collect samples, templates and vector stencils libraries for drawing computer and network diagrams, schemes and technical drawings.
HelpDesk
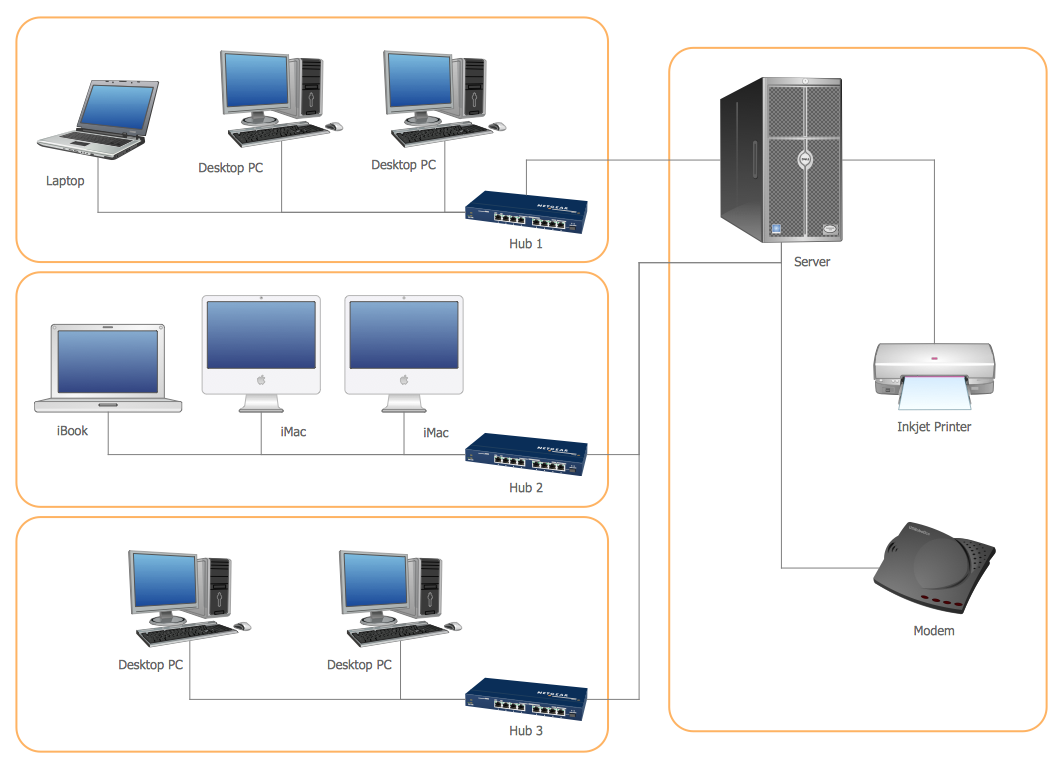
How to Make Network Diagram
ConceptDraw PRO allows you to represent and communicate network architecture, topology, and design to engineers, stakeholders and end-users.HelpDesk
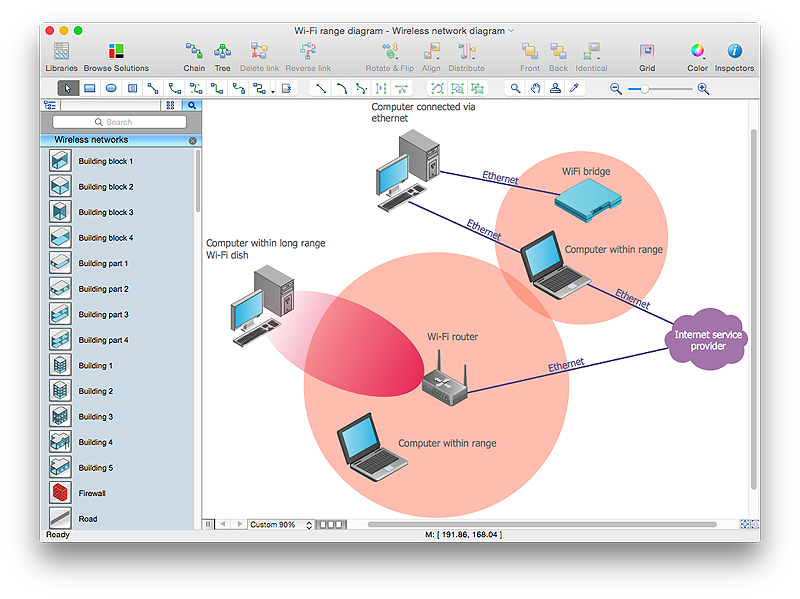
How to Create a Wireless Network Diagram
A wireless network diagram is a specialized type of computer network diagrams. Wireless Network diagrams are used to develop, operate and maintain the WLAN systems. Making a Wireless Network diagram involves many different elements that can be managed using ConceptDraw PRO. With ConceptDraw PRO you can easily create and communicate the Wireless Network diagram of any complexity.HelpDesk
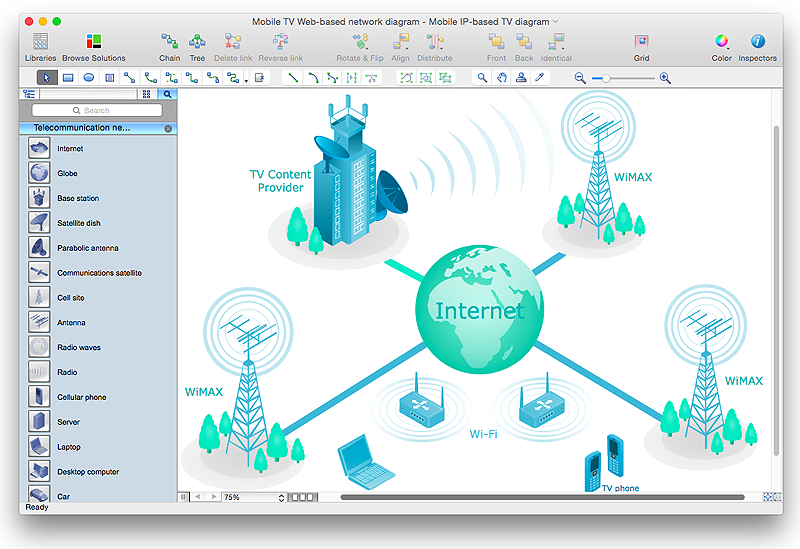
How to Create a Telecommunication Network Diagram in ConceptDraw PRO
Telecommunication network diagram displays components and connections in a telecommunication network: how they are interacted between each other and with end-users. Telecommunication network diagrams usually created by system engineers for planning telecom networks. Also they may be useful for a network management. Telecom network diagram visualizes the level of security and user access to certain eqipment and data within a current network. Telecom network diagram can be used to identify weak points of an entire network or a part of it. ConceptDraw PRO allows you to draw a simple and clear Telecommunication Network diagrams.
 Computer Network Diagrams
Computer Network Diagrams solution extends ConceptDraw PRO software with samples, templates and libraries of vector stencils for drawing the computer network topology diagrams.
HelpDesk
How to Create Cisco Network Diagrams
The easiest way to design Cisco Network diagram using standard Cisco product symbols is using ConceptDraw PRO powered by Cisco Network Diagrams solution. The Cisco Network Diagrams solution uses Cisco network symbols to to visually document the topology and design of Cisco networks.HelpDesk
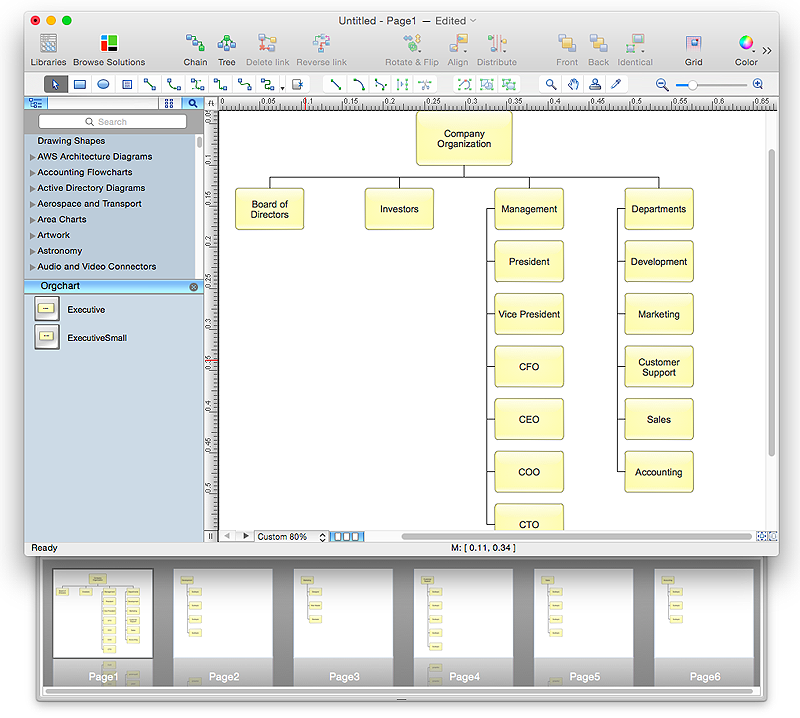
How to Create Organizational Chart Quickly
Use ConceptDraw MINDMAP for generating structured data on organization structure and then ConceptDraw PRO for presenting the results as chart.HelpDesk
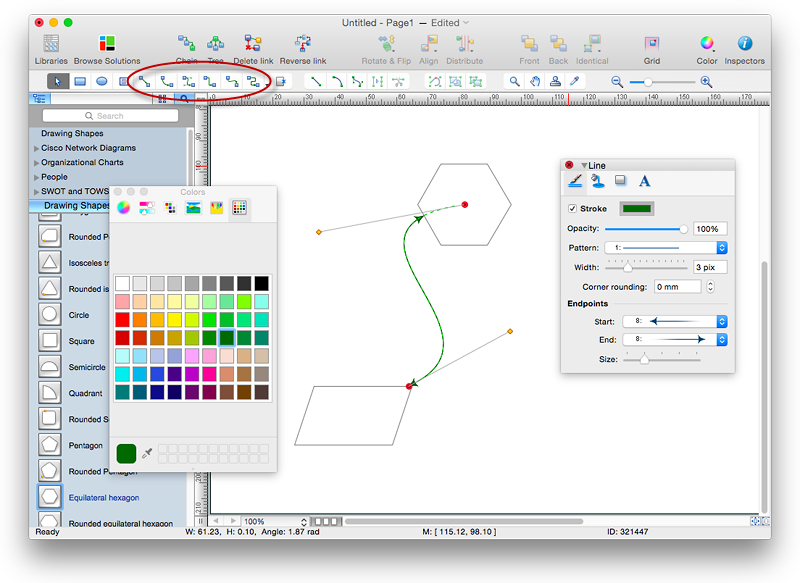
How to Connect Objects in ConceptDraw PRO on Mac
ConceptDraw PRO provides a few options for drawing connections between. This article describes how you can connect objects with connectors and how you can ascribe different types and behaviors.
HelpDesk
How to Create a Timeline Diagram in ConceptDraw PRO
A Timeline is a chart which displays a project plan schedule in chronological order. A Timeline is used in project management to depict project milestones and visualize project phases, and show project progress. The graphic form of a timeline makes it easy to understand critical project milestones, such as the progress of a project schedule. Timelines are particularly useful for project scheduling or project management when accompanied with a Gantt chart. It captures the main of what the project will accomplish and how it will be done. making a project timeline is one of the most important skills a project manager needs have. Making comprehensive, accurate timelines allows you getting every project off in the best way. ConceptDraw PRO allows you to draw a timeline charts using special library.HelpDesk
How to Save a Diagram as a Web Page in ConceptDraw PRO
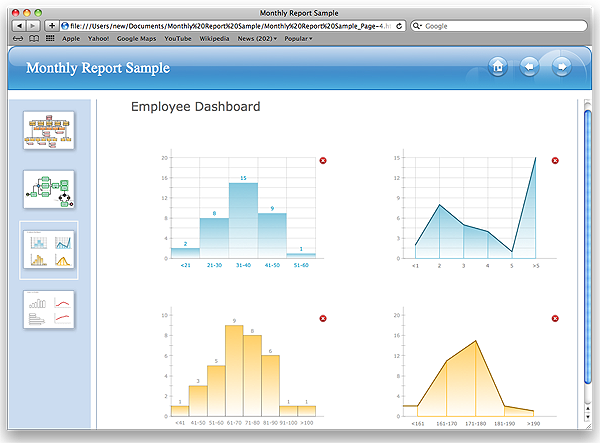
Using ConceptDraw PRO, you can save diagrams as a Web pages. ConceptDraw PRO adds the HTML tags that are needed to display your diagrams in a Web browser, so all you have to do is design their appearance.HelpDesk
How to Create an AWS Architecture Diagram
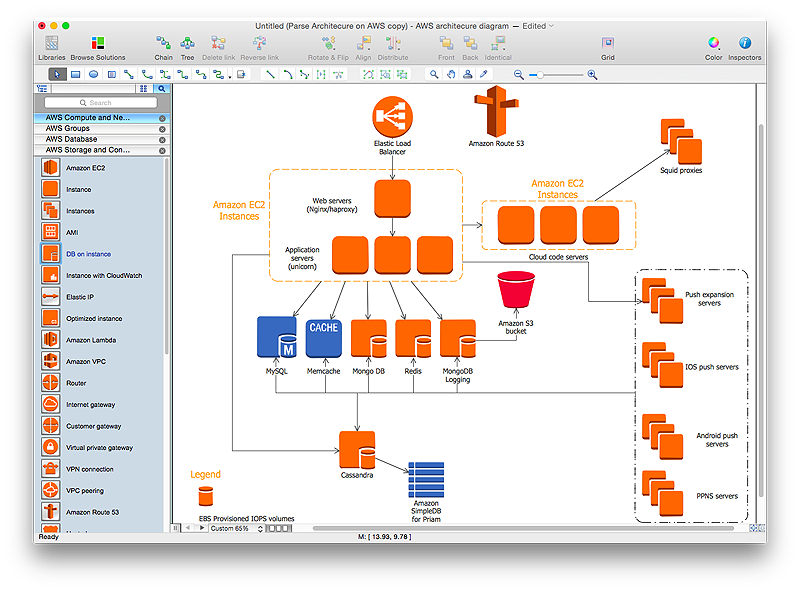
Displaying an Amazon Web Service (AWS) cloud actually requires large amounts of attention to detail. Every element of technology has to be addressed: software, middle ware, transaction processing, scaling, data storage; the complete list is staggering. Using the ConceptDraw AWS Architecture Diagrams solution makes much easier the work on documenting the Amazon Web Service architecture. The ConceptDraw AWS Architecture Diagrams solution includes icons, sample and templates for some Amazon Web Services products and resources, to be used when buiding architecture diagrams. The icons are simple so that user can easily incorporate them in his drawings. AWS Architecture Diagrams can be used in presentations, datasheets, or any other technical visualizations.HelpDesk
How to Create a Venn Diagram in ConceptDraw PRO
Venn diagrams were invented by John Venn as a method of depicting relationships between different components. A Venn diagram consists of two or more circles. Each circle represents a specific group or set. The entities which are depicted by circles generally have some common characteristics. A Venn Diagram shows all the possible logical relations between these entities. Any properties that belong to more than one set should be indicated in the sections where the circles overlap. A Venn Diagram can be useful to visually summarize the status and future viability of a project. ConceptDraw PRO allows you to make a Venn diagrams using the Venn Diagrams solution.- Network Diagram Examples
- Entity-Relationship Diagram (ERD) | Fishbone Diagram | Network ...
- How to Draw a Computer Network Diagrams | 3D Network Diagram ...
- ConceptDraw PRO Network Diagram Tool | How to Draw a ...
- Network Diagram Software | ConceptDraw PRO Network Diagram ...
- How to Draw a Computer Network Diagrams | Engineering ...
- How to Draw a Computer Network Diagrams | Network Architecture ...
- How to Draw a Computer Network Diagrams ... - Conceptdraw.com
- ConceptDraw Solution Park | How to Draw a Computer Network ...
- UML Deployment Diagram | Design Element: Basic Network for ...
- UML Component Diagram Example - Online Shopping ...
- Network Diagram Examples | Draw Network Diagram based on ...
- ConceptDraw PRO Network Diagram Tool | Network Diagram ...
- Network Diagram Examples
- Cisco Network Templates | Draw Network Diagram based on ...
- UML Sample Project | UML 2 4 Process Flow Diagram | UML Use ...
- UML Composite Structure Diagram | Data structure diagram with ...
- Activity Network (PERT) Chart | ConceptDraw PRO Network ...
- Network Diagram Software | ConceptDraw PRO Network Diagram ...
- UML Component Diagram
