HelpDesk
How to Draw a Pyramid Diagram in ConceptDraw PRO
Pyramid diagram (triangle diagram) is used to represent data, which have hierarchy and basics. Due to the triangular form of diagram, each pyramid section has a different width. The width of the segment shows the level of its hierarchy. Typically, the top of the pyramid is the data that are more important than the base data. Pyramid scheme can be used to show proportional and hierarchical relationships between some logically related items, such as departments within an organization, or successive elements of any process. This type of diagram is often used in marketing to display hierarchical related data, but it can be used in a variety of situations. ConceptDraw PRO allows you to make a pyramid diagram, quickly and easily using special libraries.Network Diagramming with ConceptDraw PRO
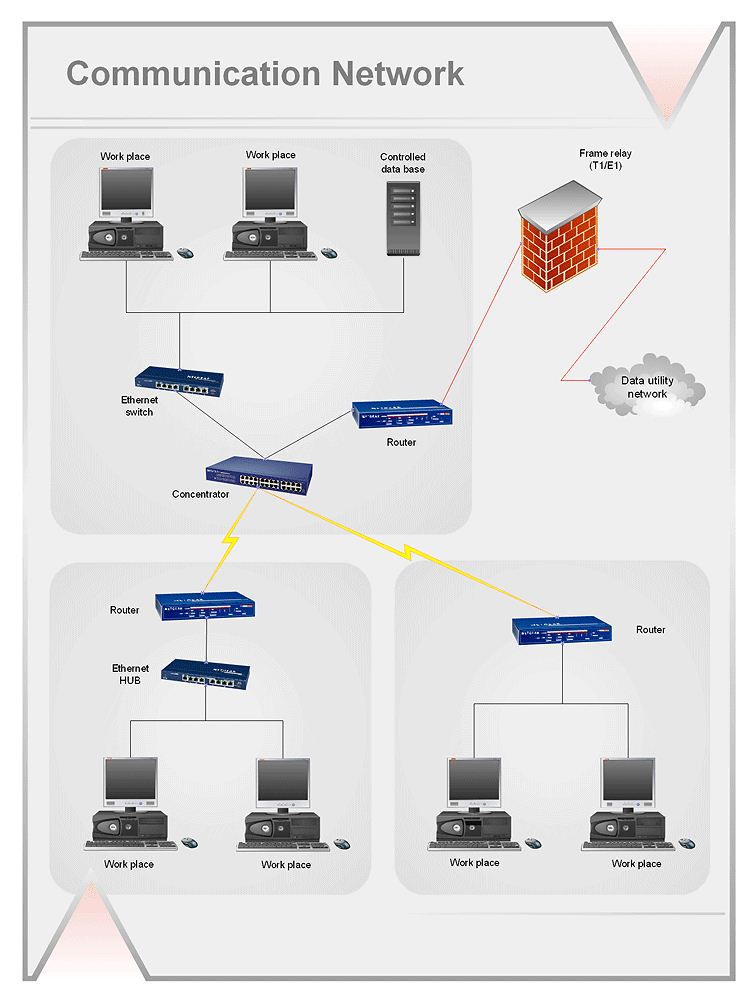
At the moment computer networks are widespread, various types of computer networks are constructed around the world, operate and interact with each other. There are many kinds of computer networks that differ in the transmission medium, in communications protocols, in size, topology, organizational intent, and also in territorial basis. There are popular such types of computer networks as Global Area Network (GAN), Wide Area Network (WAN), Metropolitan Area Network (MAN), Local Area Network (LAN). ConceptDraw PRO is a powerful network diagramming software, perfect for software engineers, software designers and software developers who need to draw Computer Network diagrams, designs, schematics, and network maps in no time. The pre-drawn shapes representing computers, network devices and smart connectors offered by ConceptDraw solutions help to create the accurate diagrams and documentation, represent computer network topologies and designs, depict Computer network architectures, logical, physical, cable networks, and vehicular networks.HelpDesk
How to Draw a Gantt Chart Using ConceptDraw PRO
A Gantt chart is intended to provide a visualization of a project schedule. It is developed to help planning, coordinating, and tracking on project tasks implementation. One of the most critical resources for a project implementation is a time resources. Gantt chart - is one of the most convenient and popular way of graphical representation of a project tasks progress in conjunction with the corresponding time consumption. Gantt chart's function is to show project tasks completion in a progress, and to make a project manager sure that project tasks were completed on time. ConceptDraw Office is a clear and easy-to-use tool for project management. It is a very handy visual tool that helps make a project processing clear.- 4 Level pyramid model diagram - Information systems types ...
- Chart Of Management Information System With Diagram
- Levels Of Management Block Diagram
- Pyramid Diagram Indicating Levels Of Management And Their
- Diagram Of Management Levels In An Organization
- 4 Level pyramid model diagram - Information systems types
- Draw A Diagram Showing The Different Levels Of Management
- Diagram Illustrating The Levels Of Management
- How to Draw an Organization Chart | ConceptDraw PRO ...
- Pyramid Diagram | How to Draw an Organization Chart ...
- Draw And Explain The Various Level Of Management
- A Diagram Illustrating The Different Levels Of Management
- Draw A Diagram Levels Of Management In Organization
- Pyramid Diagram | Organizational Structure | How to Draw a ...
- Levels Of Management Flow Chart
- Management Area | Organizational Charts | Pyramid Diagram | 25 ...
- Draw 3 Levels Of Dfd For Library Management Systems
- Explain The Hierarchy Of Management And Draw Diagram
- Level 1 Dfd Of Library Management System


