HelpDesk
How to Draw the Different Types of Pie Charts
Using the Pie Chart, you can visually estimate the relative contribution that different data categories contribute to a whole value. The pie chart displays the statistics in a visual format. The main use of pie charts to show comparisons. The larger piece of the pie, the more the value of this value compared to the rest. Various applications of pie charts can be found in business and education. For business, pie charts can be used to compare the success or failure of the goods or services. They may also be used to display the business market share.HelpDesk
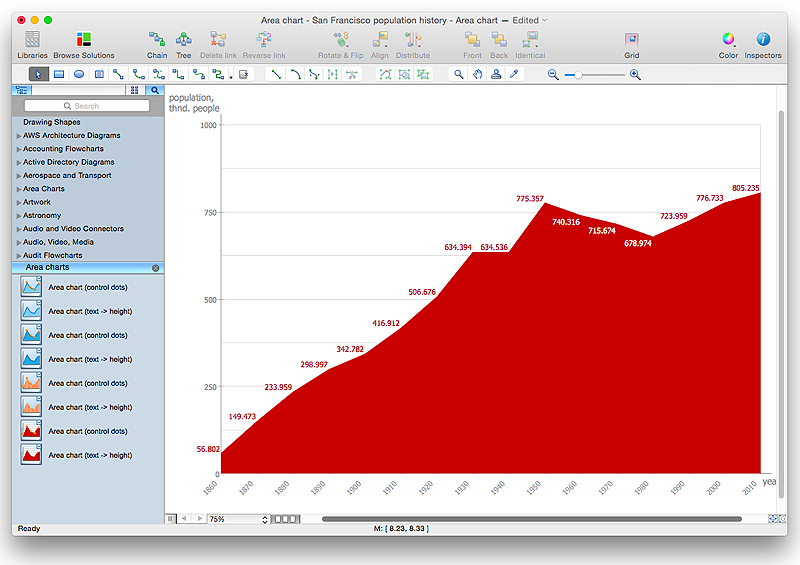
How to Draw an Area Chart in ConceptDraw PRO
Area chart is similar to a line chart, but an area chart has an area, commonly filled with color below the line. The applying of Line charts and area charts are also very similar. They both show continuity across a data set. They are both can be used for displaying time series data and for depicting tendencies better than separate values, but they have some different characteristics. Using the proper one is good chance to show once again a professionalism of your graphic documents. An area chart depicts a colored area below the line. The sum on the vertical axis of an area chart represents the entire value, while the height of each separate piece shows its parts. Area charts are used to display multiple data series with proportion to a whole value , or for separate data series showing a set of countable values, or cumulative data.HelpDesk
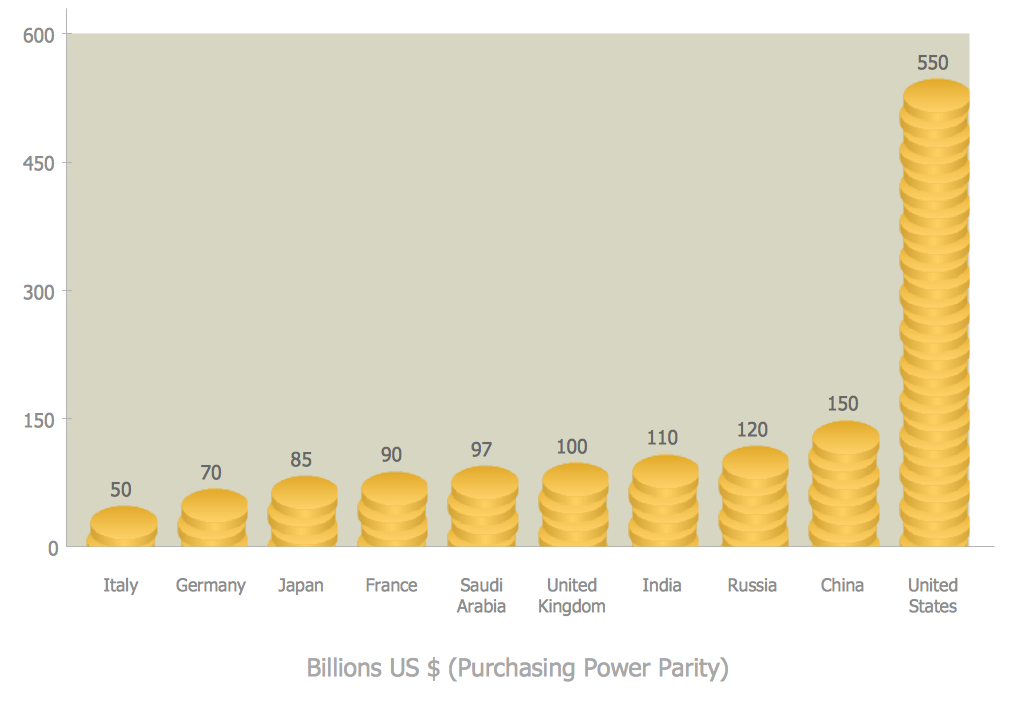
How to Create a Picture Graph in ConceptDraw PRO
Picture Graphs are used commonly to represent non-complex data to a large audience. A Picture Graph is simple kind of marketing diagram used to show the relationship among various quantities. It include pictures or symbols to represent information visually. There are many cases when you have just some numbers to show and compare. This is not a reason to not use visual tools. You can produce a simple picture graph using memorable symbols to get the best visual presentation. Using specific symbols instead of regular colored bars makes picture graphs a much more descriptive tool. You can use tools from an existing library or find appropriate clipart in ConceptDraw’s collection. ConceptDraw PRO allows you to draw a simple and easy to understand Graph Charts using the special library.Diagram of a Pyramid
Pyramid diagram is a convenient way of representing data hierarchical structure and visualization relationships between hierarchy levels. You need create the diagram of a pyramid? ConceptDraw diagramming and vector drawing software supplied with Pyramid Diagrams Solution from the Marketing Area of ConceptDraw Solution Park is the best tool for drawing attractive and successful diagram of a pyramid.Biology Drawing Software
Biology is incredibly interesting and useful natural science which studies all living things on the earth (people, animals, plants), structure, functions, interactions, evolution of living organisms. Biologists of the whole world use actively illustrations and drawings in your science and education activity. To facilitate their task of biology drawing, ConceptDraw PRO diagramming and vector drawing software was extended with Biology solution from the Science and Education area. Now, ConceptDraw PRO is a powerful biology drawing software.Block Diagram Creator
A block diagram is a diagram of a system in which the principal parts or functions are represented by blocks connected by lines that show the relationships of the blocks. ConceptDraw PRO diagramming and vector drawing software extended with Block Diagrams Solution from the "What is a Diagram" Area is a powerful Block Diagram Creator.Competitor Analysis
Competitor analysis is a first and obligatory step in elaboration the proper corporate marketing strategy and creating sustainable competitive advantage. Use powerful opportunities of numerous solutions from ConceptDraw Solution Park for designing illustrative diagrams, charts, matrices which are necessary for effective competitor analysis.- Approximate composition of the air - Pie chart | Percentage Pie ...
- Process Flowchart | Pie Chart Examples and Templates | Basic ...
- Process Flowchart | Pie Chart Examples and Templates | Business ...
- Process Flowchart | Pie Chart Examples and Templates ...
- Process Flowchart | Pie Chart Examples and Templates | Basic ...
- Process Flowchart | Onion Diagram Process Design | Stakeholder ...
- Domestic garden | Domestic sector SWOT | Pie chart - Domestic ...
- Pyramid Chart Examples | Pyramid Diagram and Pyramid Chart ...
- Financial Comparison Chart | Pie Donut Chart. Pie Chart Examples ...
- Flow Chart for Olympic Sports | Building Drawing Software for ...
- Energy Pyramid Diagram | Resources and energy - Vector stencils ...
- Marketing Organization Chart | Bar Diagrams for Problem Solving ...
- Mechanical Engineering | Mechanical Drawing Software ...
- Approximate composition of the air - Pie chart | Stars and planets ...
- Percentage Pie Chart . Pie Chart Examples | LLNL Flow Charts ...
- Pyramid Diagram and Pyramid Chart | 3D Segmented pyramid chart ...
- Onion Diagram Process Design | How To Create Onion Diagram ...
- How to Draw a Pictorial Chart in ConceptDraw PRO | How to Draw ...
- Directional Maps | Plant Layout Plans | Onion Diagram Process ...
- Basic Diagramming | CAD Drawing Software for Making Mechanic ...


