Venn Diagram

Software and Database Design with ConceptDraw DIAGRAM

Example of DFD for Online Store (Data Flow Diagram)


Piping and Instrumentation Diagram Software

Data Modeling Diagram

 Telecommunication Network Diagrams
Telecommunication Network Diagrams solution extends ConceptDraw DIAGRAM software with samples, templates, and great collection of vector stencils to help the specialists in a field of networks and telecommunications, as well as other users to create Computer systems networking and Telecommunication network diagrams for various fields, to organize the work of call centers, to design the GPRS networks and GPS navigational systems, mobile, satellite and hybrid communication networks, to construct the mobile TV networks and wireless broadband networks.
Data modeling with ConceptDraw DIAGRAM

 Computer and Networks Area
The solutions from Computer and Networks Area of ConceptDraw Solution Park collect samples, templates and vector stencils libraries for drawing computer and network diagrams, schemes and technical drawings.
Types of Flowcharts


 SYSML
SYSML
The SysML solution helps to present diagrams using Systems Modeling Language; a perfect tool for system engineering.
What is a Quality Management

 Event-driven Process Chain Diagrams
Event-Driven Process Chain Diagrams solution extends ConceptDraw DIAGRAM functionality with event driven process chain templates, samples of EPC engineering and modeling the business processes, and a vector shape library for drawing the EPC diagrams and EPC flowcharts of any complexity. It is one of EPC IT solutions that assist the marketing experts, business specialists, engineers, educators and researchers in resources planning and improving the business processes using the EPC flowchart or EPC diagram. Use the EPC solutions tools to construct the chain of events and functions, to illustrate the structure of a business process control flow, to describe people and tasks for execution the business processes, to identify the inefficient businesses processes and measures required to make them efficient.
Finite State Machine

 AWS Architecture Diagrams
AWS Architecture Diagrams with powerful drawing tools and numerous predesigned Amazon icons and AWS simple icons is the best for creation the AWS Architecture Diagrams, describing the use of Amazon Web Services or Amazon Cloud Services, their application for development and implementation the systems running on the AWS infrastructure. The multifarious samples give you the good understanding of AWS platform, its structure, services, resources and features, wide opportunities, advantages and benefits from their use; solution’s templates are essential and helpful when designing, description and implementing the AWS infrastructure-based systems. Use them in technical documentation, advertising and marketing materials, in specifications, presentation slides, whitepapers, datasheets, posters, etc.
 Sales Flowcharts
The Sales Flowcharts solution lets you create and display sales process maps, sales process workflows, sales steps, the sales process, and anything else involving sales process management.
UML Tool & UML Diagram Examples

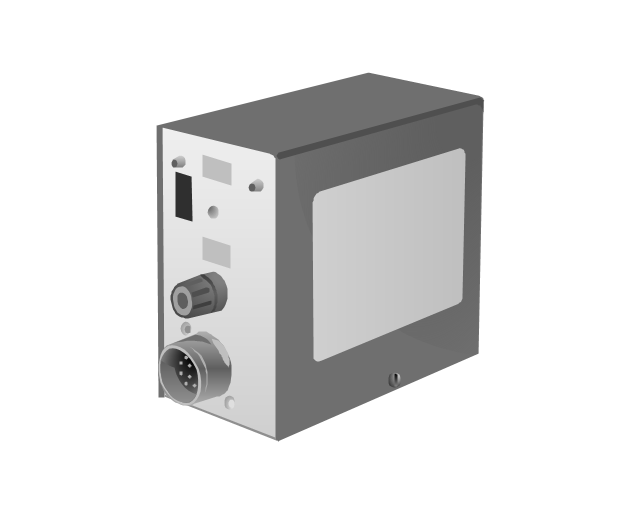
The vector stencils library "Telecommunication networks" contains 32 clipart images of telecommunication network devices and equipment for drawing telecom network diagrams.
"A telecommunications network is a collection of terminal nodes, links and any intermediate nodes which are connected so as to enable telecommunication between the terminals.
The transmission links connect the nodes together. The nodes use circuit switching, message switching or packet switching to pass the signal through the correct links and nodes to reach the correct destination terminal.
Each terminal in the network usually has a unique address so messages or connections can be routed to the correct recipients. The collection of addresses in the network is called the address space." [Telecommunications network. Wikipedia]
The clip art example "Telecommunication networks - Vector stencils library" was created using the ConceptDraw PRO diagramming and vector drawing software extended with the Telecommunication Network Diagrams solution from the Computer and Networks area of ConceptDraw Solution Park.
Internet

Globe

Base station

Satellite dish

Satellite dish

Communications satellite

Wireless cell tower

Radio waves

Radio waves

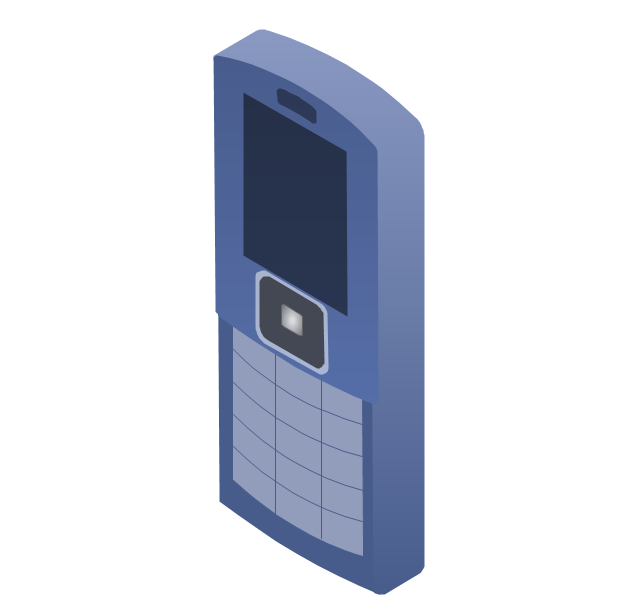
Cellular phone
Server

Laptop computer

Desktop computer

Car

Satellite truck

House

House

Office building

Mountain

Tree

Tree

User

Call-center

Multi-storey

Antenna

Router

IP phone

Fax

Network cell

IP Camera

Wireless router

Networking device

 EXPRESS-G data Modeling Diagram
EXPRESS-G data Modeling Diagram solution extends the ConceptDraw DIAGRAM software functionality with capabilities of EXPRESS data modeling language, includes powerful data modeling tools, Express-G diagram tool, database diagram tool, database design tool, wide variety of pre-made vector objects of EXPRESS-G notation and EXPRESS-G diagrams samples allowing software developers, software designers, software engineers and other stakeholders to make their data models for information systems, to develop the databases, to learn the principles of construction EXPRESS-G diagrams and helping to draw their own EXPRESS-G Data Modeling Diagrams, Express-G Diagrams or Database Model Diagram without any efforts.
The vector stencils library "Workflow diagrams" contains 54 symbol icons of workflow diagrams.
The workflow diagrams represent information flow, automation of business processes, business process re-engineering, accounting, management, and human resources tasks in industry, business, and manufacturing.
Use this library to draw workflow diagrams in the ConceptDraw PRO diagramming and vector drawing software extended with the Workflow Diagrams solution from the Business Processes area of ConceptDraw Solution Park.
www.conceptdraw.com/ solution-park/ business-process-workflow-diagrams
Accounting

Accounts Payable

Accounts Receivable

Bank

Board of Directors

Copy Center

Customer Service

Distribution

Finance

Information Systems

International Division

International Marketing

International Sales

Inventory

Legal Department

Mailroom 2

Mailroom 1

Management

Manufacturing

Marketing

Motor Pool

Packaging

Payroll

Person 1

Person 2

Personnel/ Staff

Publications

Purchasing

Quality Assurance

Exchange

Reception

Research and Development

Sale contract

Shipping

Suppliers

Telecommunications

Treasurer

Warehouse

Lorry

Quality

Production

Box

Boxes

Open box

Payment

Receiving

Sales

Phone

Operator 1

Online booking

Operator 2

Server

Car

Mini truck

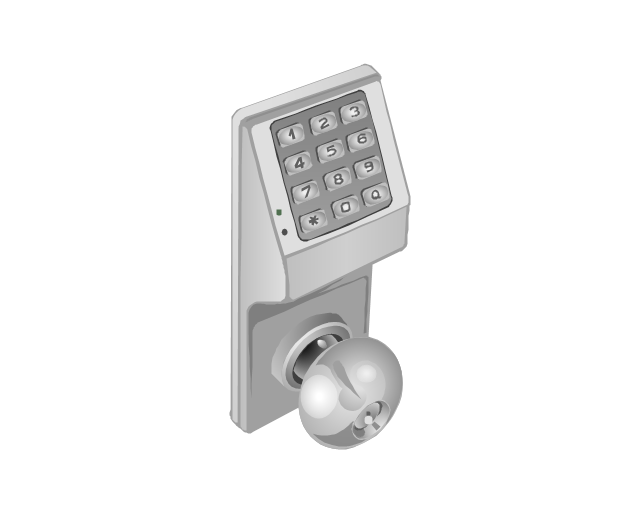
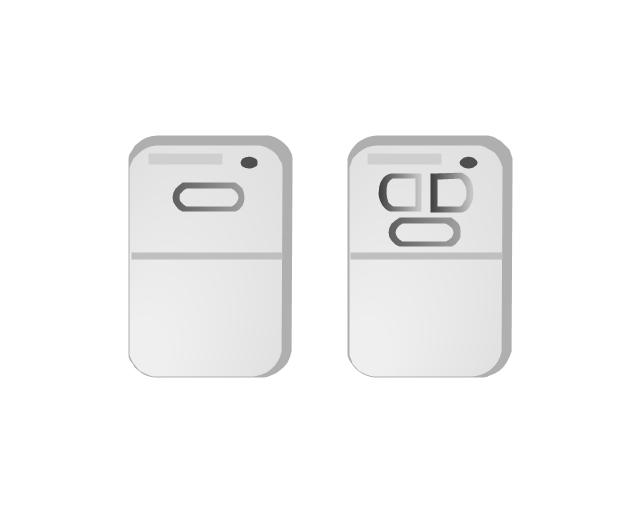
The vector stencils library "Access and security" contains 17 clipart images of access control and security system equipment which you can easy use in your diagrams and illustrations.
"Physical security describes security measures that are designed to deny unauthorized access to facilities, equipment and resources, and to protect personnel and property from damage or harm (such as espionage, theft, or terrorist attacks). Physical security involves the use of multiple layers of interdependent systems which include CCTV surveillance, security guards, protective barriers, locks, access control protocols, and many other techniques." [Physical security. Wikipedia]
The clip art example "Access and security - Vector stencils library" was created in the ConceptDraw PRO diagramming and vector drawing software using the Presentation Clipart solution from the Illustration area of ConceptDraw Solution Park.
www.conceptdraw.com/ solution-park/ illustrations-presentation-clipart
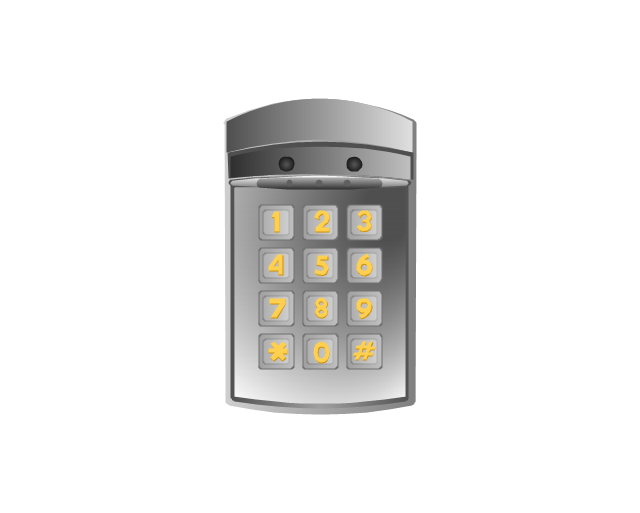
Digital keyless entry
Card reader 1
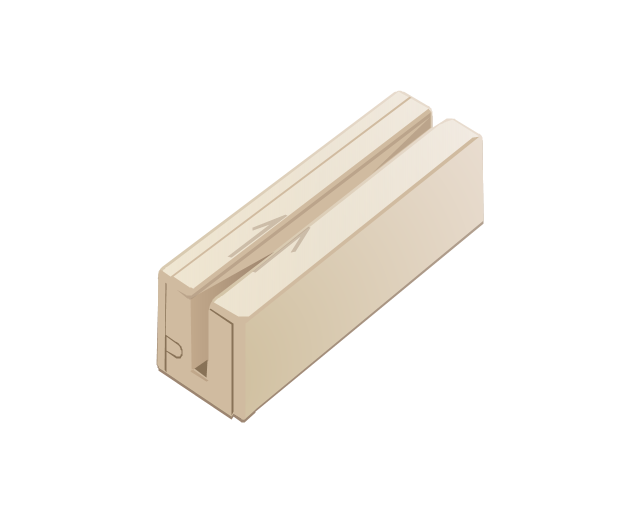
Card reader 2

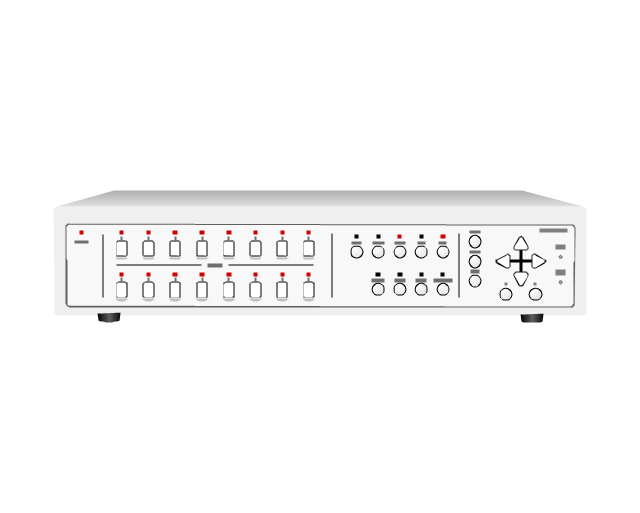
Multiplexer
Alarm light, blue

Alarm light, yellow

Alarm light, red

Vehicle detector
Loop detector

Traffic spikes
Intercom

Telephone entry system

Keyless entry system
Swing gate operator
Slide gate operator
Barrier gate operator

Transmitters
- SYSML | Rapid UML | Boolean Venn Diagram Generator
- Venn Diagram Examples for Problem Solving. Venn Diagram as a ...
- Venn Diagram Examples for Problem Solving. Venn Diagram as a ...
- Network Drawing Software | Entity-Relationship Diagram ( ERD ) with ...
- Venn Diagram Examples for Problem Solving. Venn Diagram as a ...
- Electrical Symbols — Logic Gate Diagram | Piping and ...
- CCTV Network Example | CCTV Network Diagram Software | Entity ...
- Simple Logic Circuit Using Modern Software Tool
- Process Flowchart | Circuits and Logic Diagram Software | Electrical ...
- Mechanical Drawing Software | Mechanical Drawing Symbols ...
- Electrical Symbols — Maintenance | Manufacturing and ...
- Logic gate diagram - Template | Circuits and Logic Diagram ...
- Biology Drawing Software | Physics Diagrams | Chemistry Drawing ...
- Technical Drawing Software | How To use House Electrical Plan ...
- Design elements - Semiconductor diodes | Electrical Symbols ...
- Venn Diagram Examples for Problem Solving
- Circuits and Logic Diagram Software | How To use House Electrical ...
- Explain Industrial Engineering Diagram In Videos
- Piping and Instrumentation Diagram Software | ERD Symbols and ...