Entity-Relationship Diagram (ERD) with ConceptDraw DIAGRAM
Entity-Relationship Diagram (ERD) is applied for detailed description of structures and high-level (conceptual) design databases using the Chen's and Crow's Foot notations. An ERD represents a diagram constructed mainly of rectangular blocks (for entities, data) linked with relationships. The links between the blocks are used to describe relations between the entities. There are three types of relationships: one-to-one, one-to-many, and many-to-many. Use the specialized ERD software - ConceptDraw DIAGRAM to create the Entity-Relationship Diagrams (ERDs) of any degree of complexity with Chen's and Crow's Foot notations. Draw them easily applying the powerful built-in tools and libraries of predesigned ERD vector objects from Entity-Relationship Diagram (ERD) solution from the Software Development area of ConceptDraw Solution Park. You can also start with one of ready template or sample included to this solution. Designing the ERDs in ConceptDraw DIAGRAM you can easy move the objects within a diagram with saving the relationships between them.
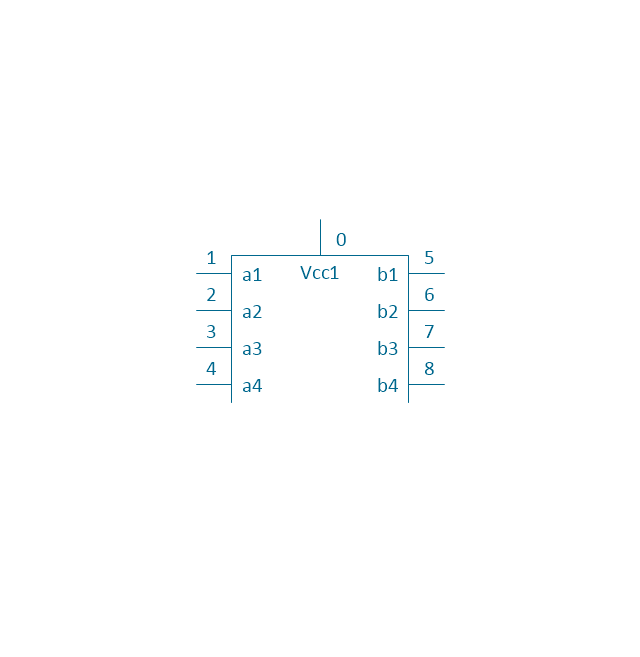
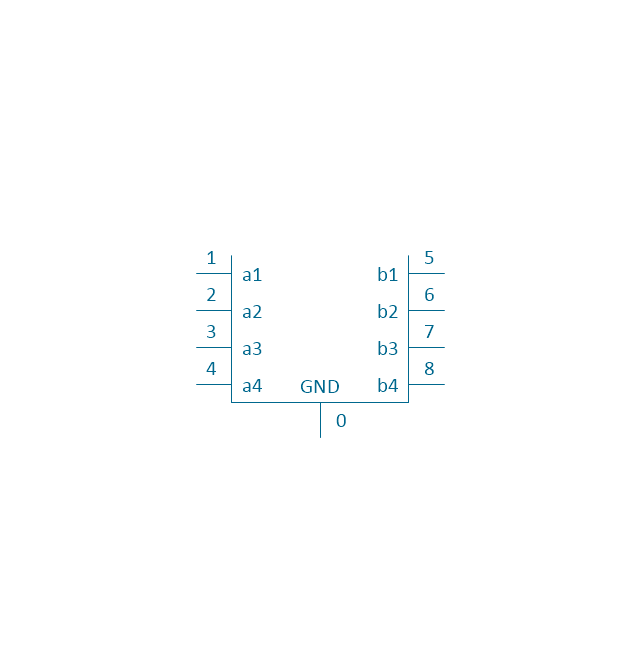
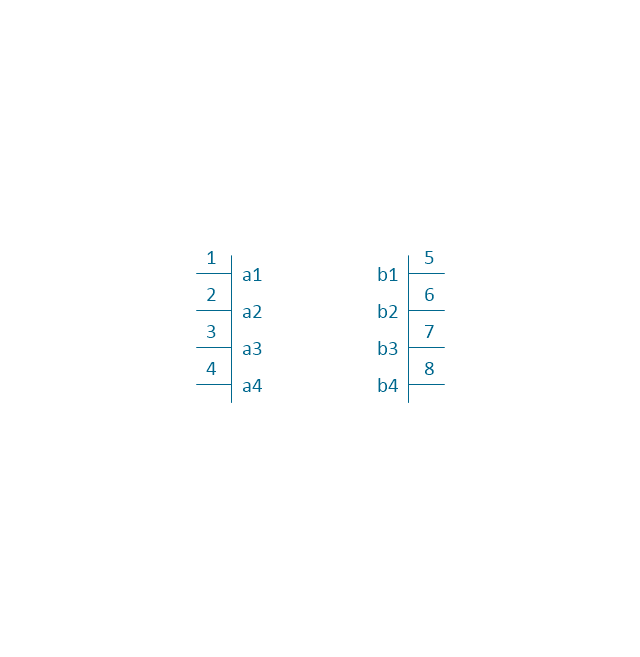
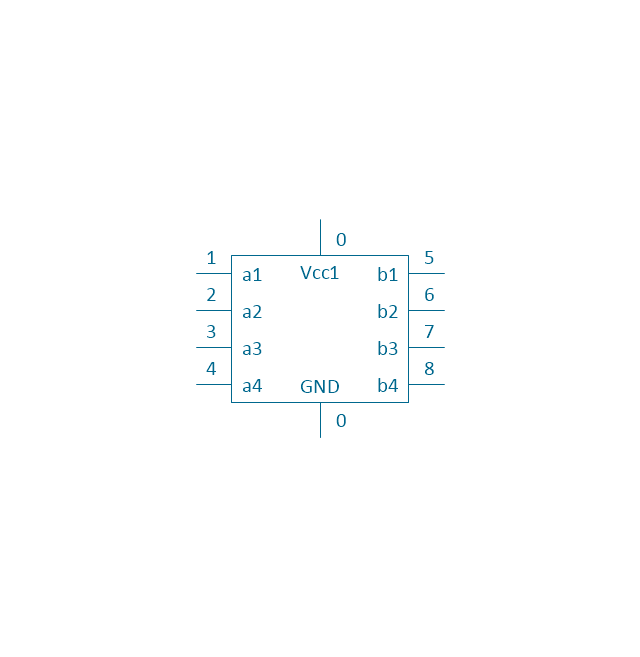
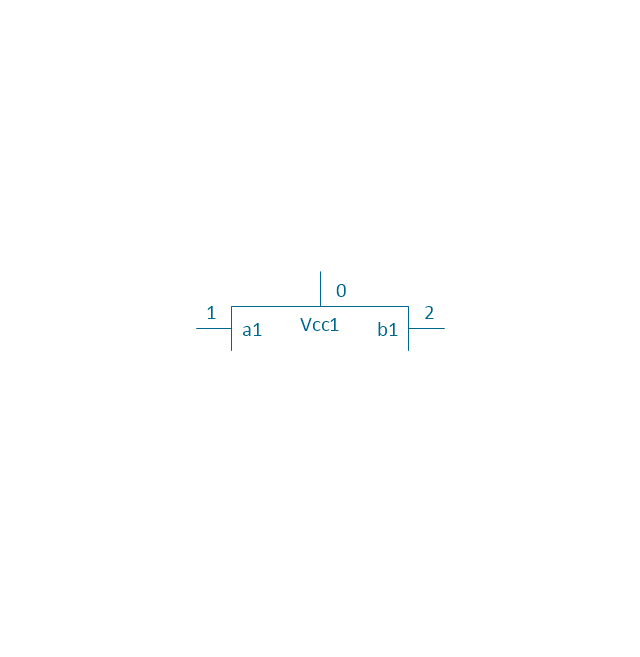
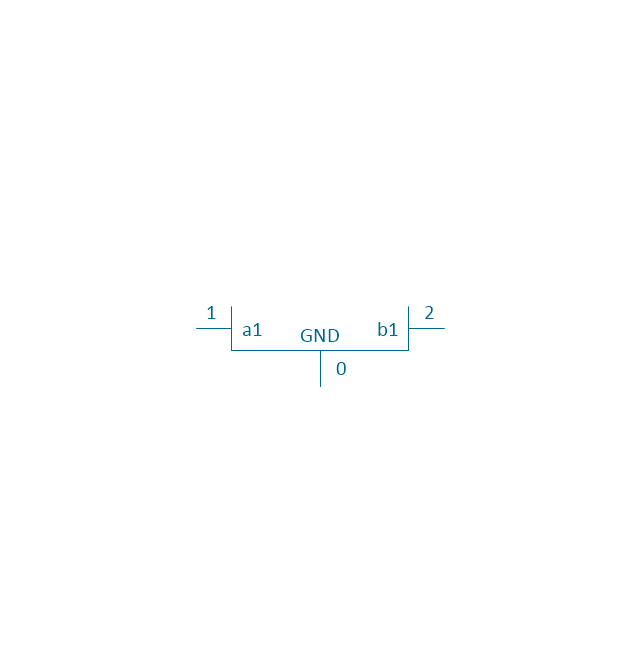
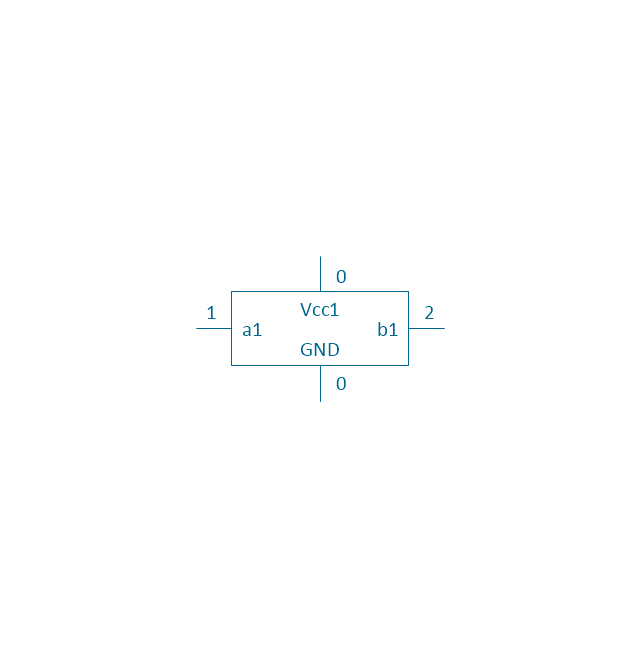
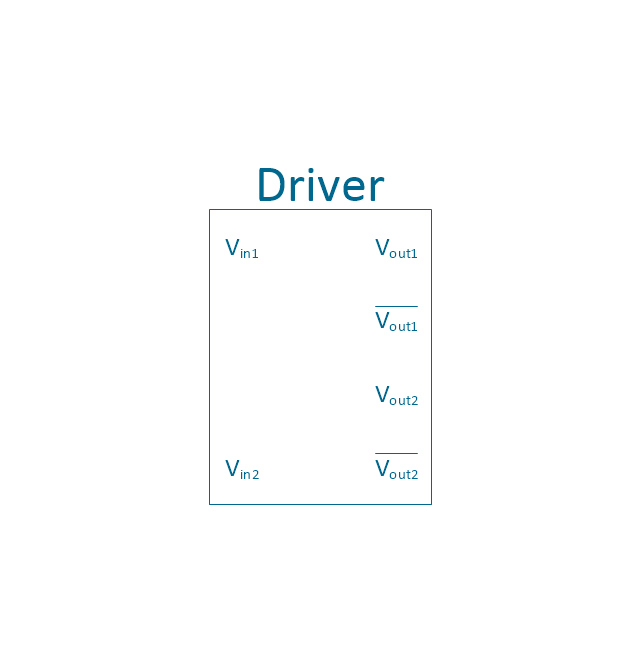
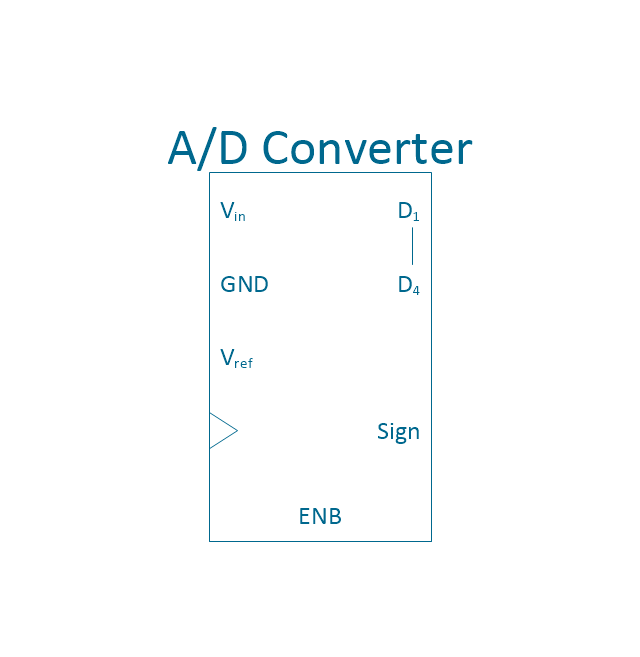
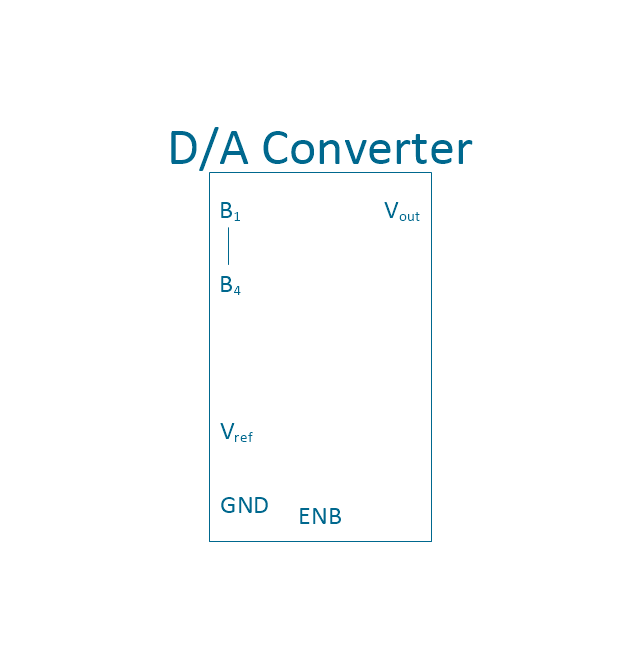
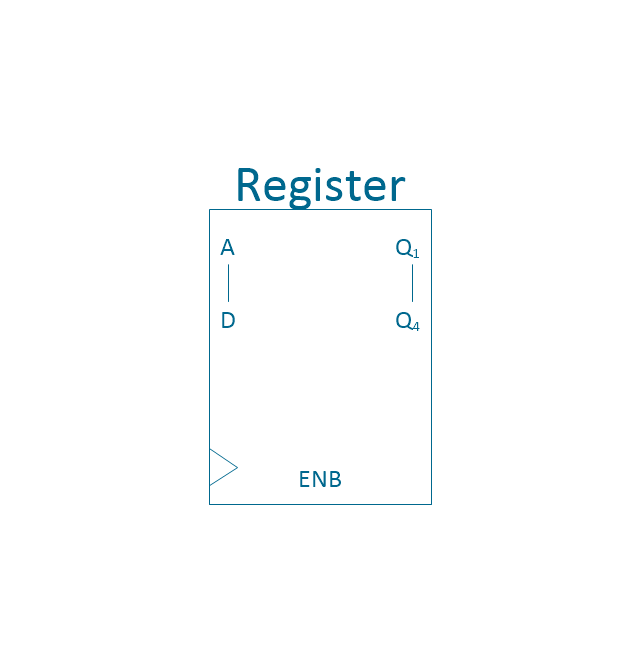
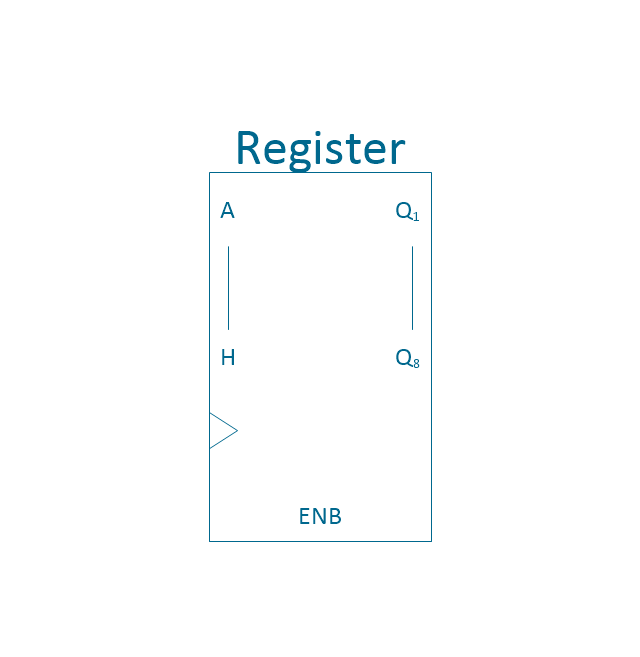
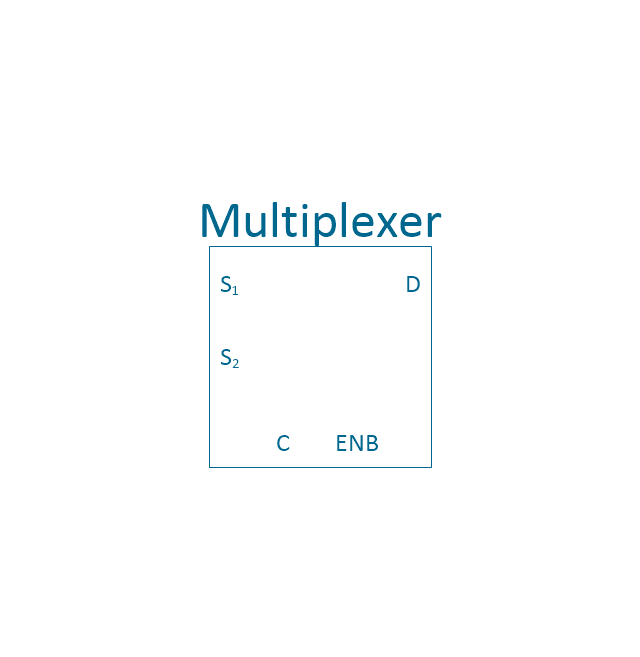
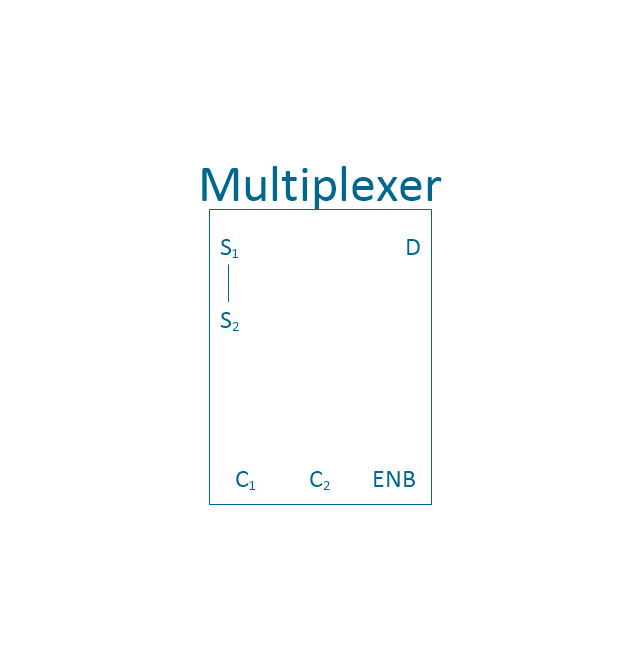
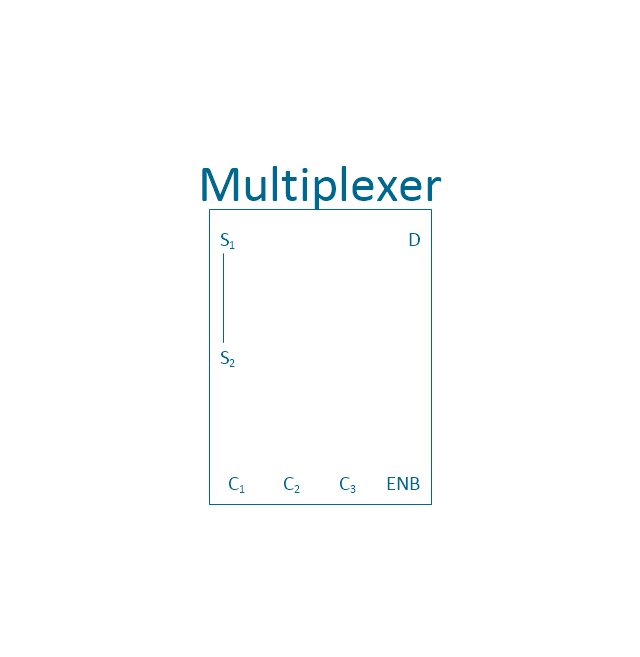
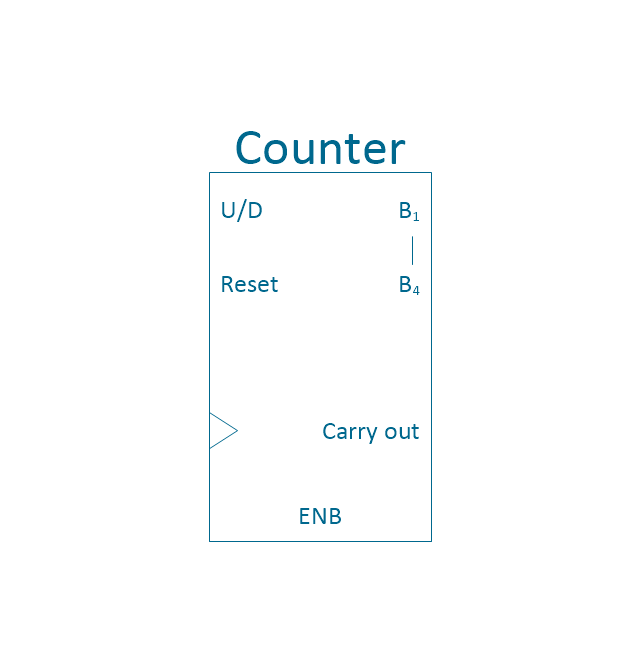
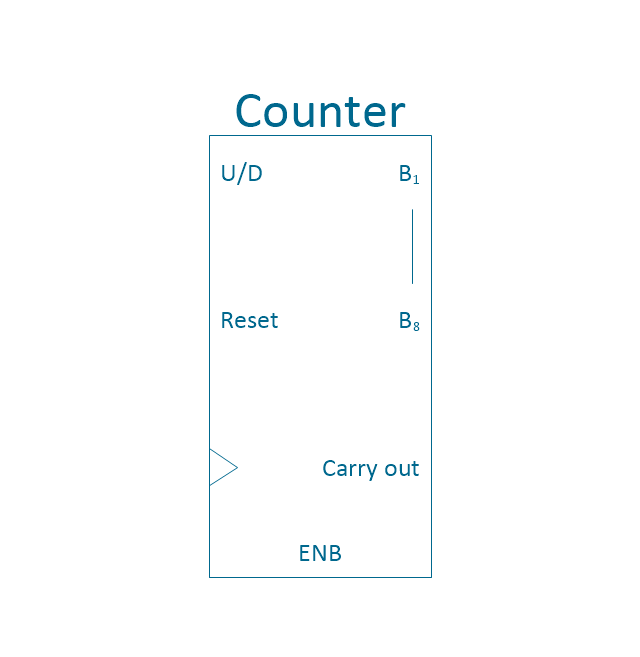
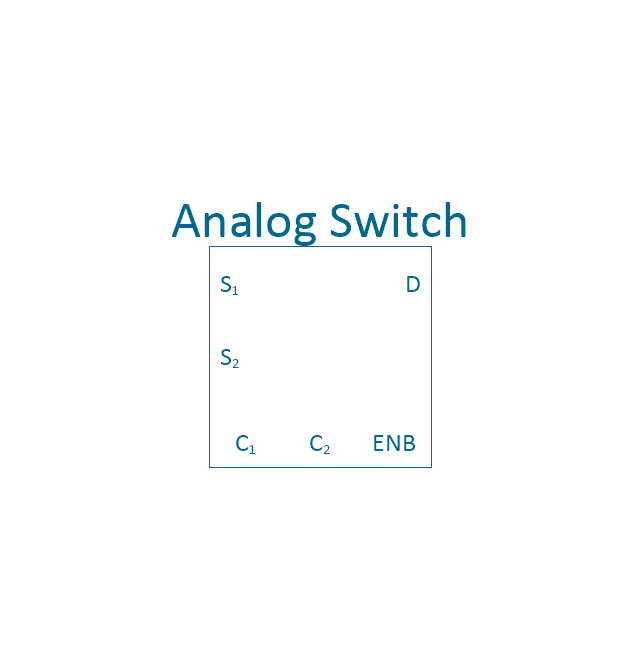
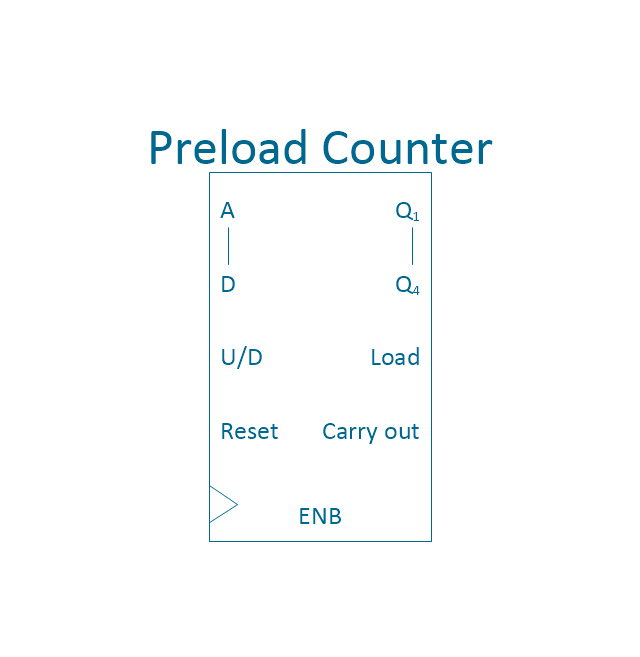
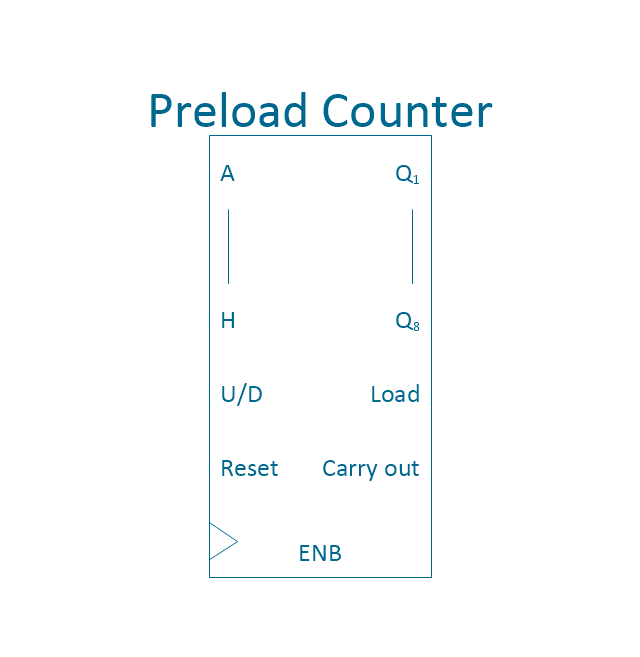
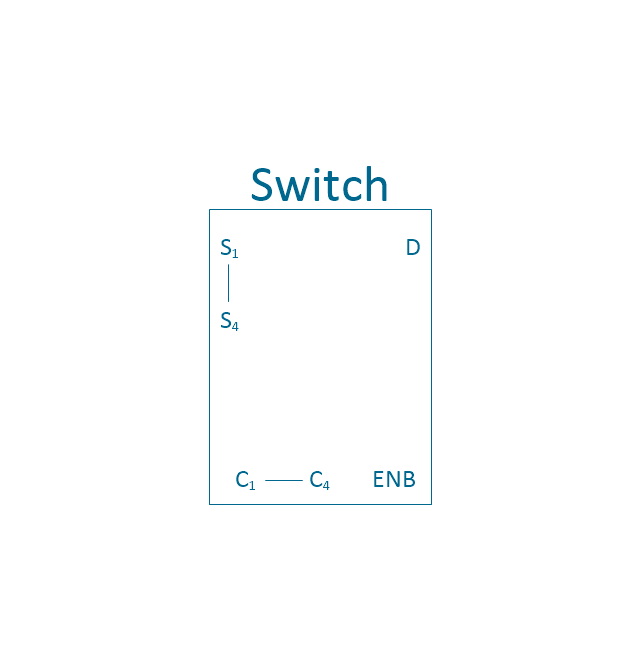
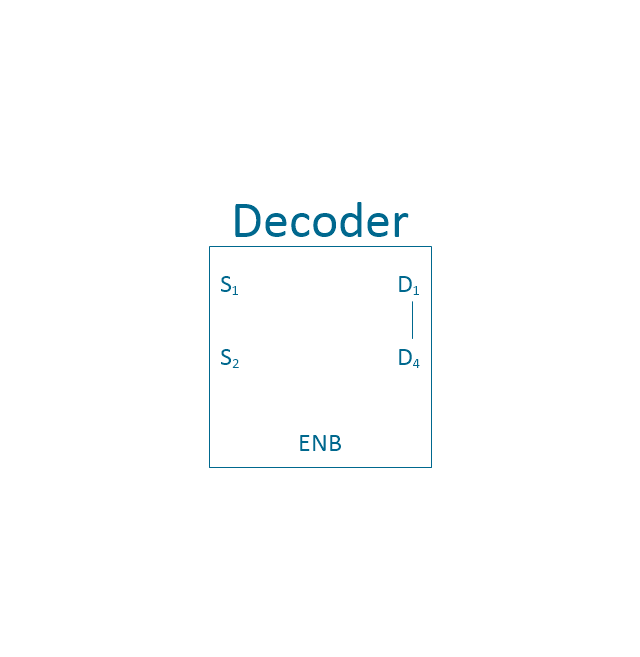
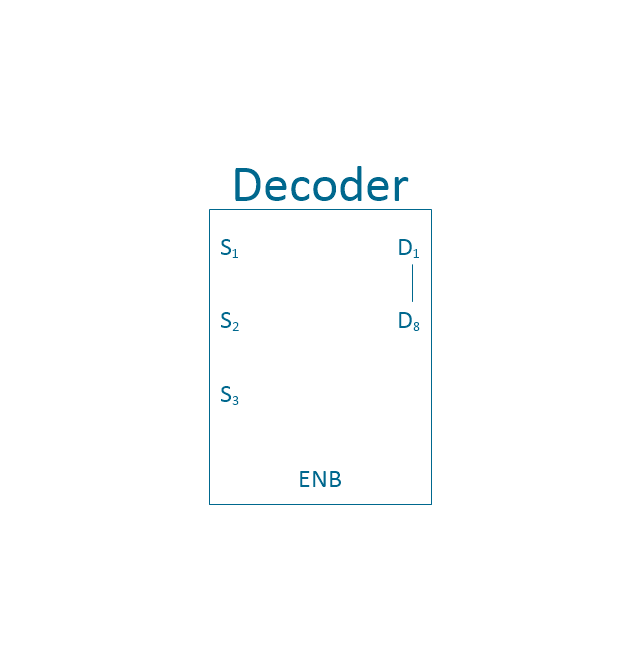
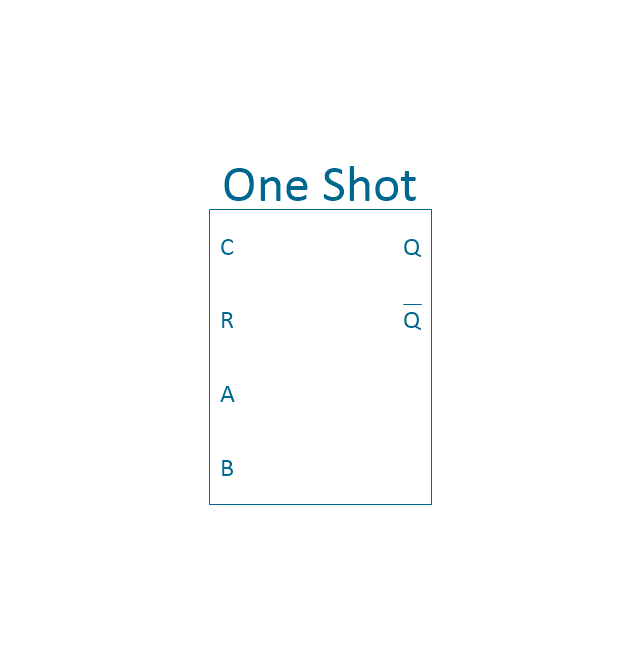
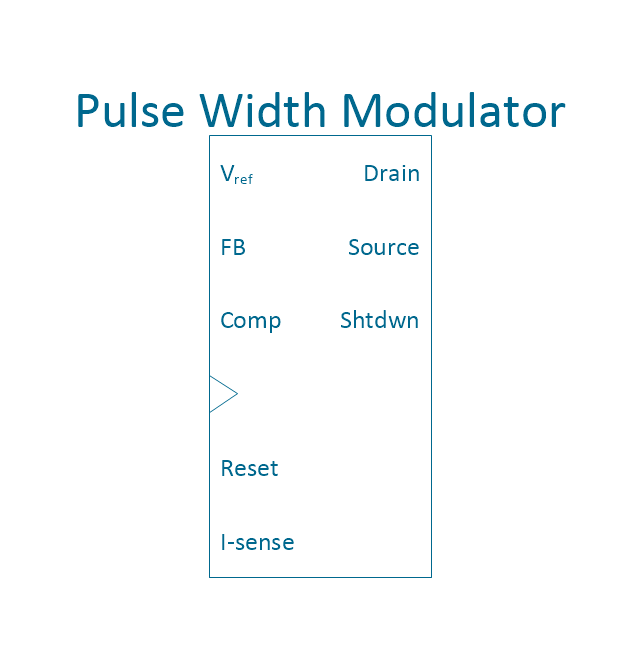
The vector stencils library "Integrated circuit" contains 43 components of integrated circuits.
Use these shapes for integrated circuit design, including transducers, rotary devices, converters, registers, analog switches, counters, registers, decoders, and multiplex transmitters in the ConceptDraw PRO diagramming and vector drawing software extended with the Electrical Engineering solution from the Engineering area of ConceptDraw Solution Park.
www.conceptdraw.com/ solution-park/ engineering-electrical
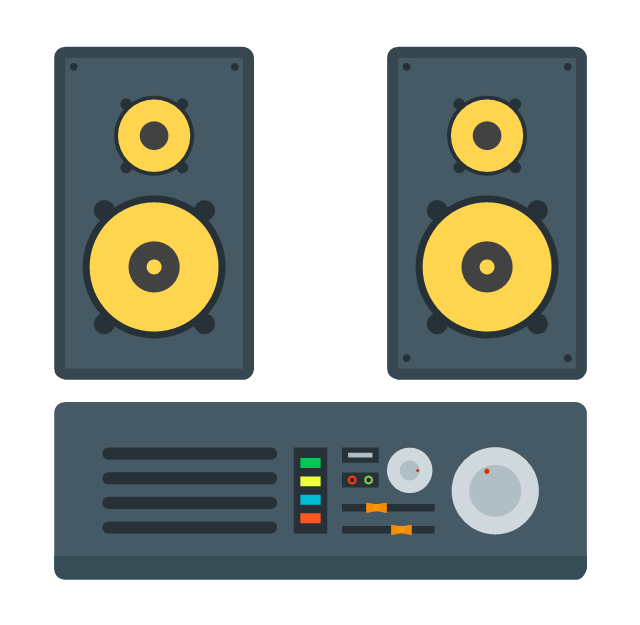
The vector stencils library "Audio" contains 91 audio, sound and music icons. Use it to design your audio, video and multimedia illustrations, presentations, web pages and infographics with ConceptDraw PRO diagramming and vector drawing software.
"Digital audio refers to technology that can be used to record, store, generate, manipulate, and reproduce sound using audio signals encoded in digital form. Following significant advances in digital audio technology during the 1970s, it rapidly replaced analog audio technology in most areas of sound production, sound engineering and telecommunications. Sound is converted to an analog electrical signal by a microphone, then an analog-to-digital converter (ADC), typically using pulse-code modulation, is used to convert it to a digital signal. A digital-to-analog converter performs the reverse process, converting a digital signal back into an analog signal, which can be converted to an audible sound by a loudspeaker. Digital audio systems may include compression, storage, processing and transmission components. Conversion to a digital format allows convenient manipulation, storage, transmission and retrieval of an audio signal." [Digital audio. Wikipedia]
The vector stencils library "Audio" is included in the Audio, Video, Media solution from the Illustration area of ConceptDraw Solution Park.
Maps Driving Directions
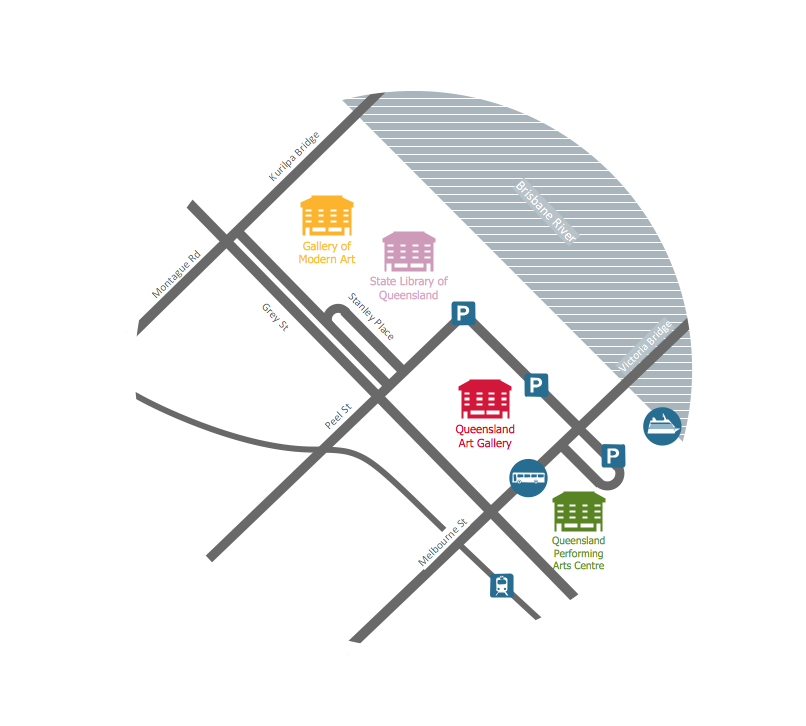
You need visually represent the Maps Driving Directions? Now it's incredibly easy to do this in ConceptDraw DIAGRAM diagramming and vector drawing software which was supplied with unique Directional Maps Solution from the Maps Area.The vector stencils library "Integrated circuit" contains 43 components of integrated circuits.
Use these shapes for integrated circuit design, including transducers, rotary devices, converters, registers, analog switches, counters, registers, decoders, and multiplex transmitters in the ConceptDraw PRO diagramming and vector drawing software extended with the Electrical Engineering solution from the Engineering area of ConceptDraw Solution Park.
www.conceptdraw.com/ solution-park/ engineering-electrical
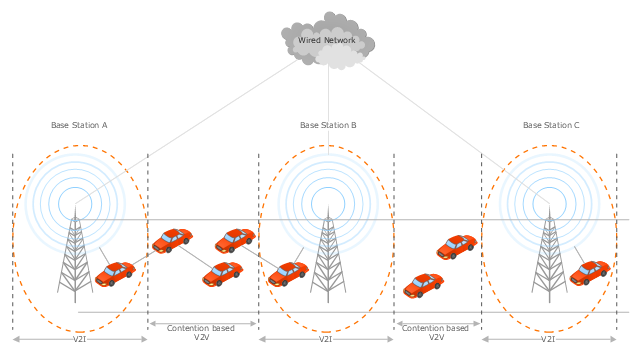
This vehicular network diagram sample was drawn on the base of the picture "Inter-Vehicle Communication (IVC) systems" from the website of the Department of Electrical and Computer Engineering, the Ohio State University.
[www2.ece.ohio-state.edu/ ~ekici/ res_ ivc.html]
"Driver assistance systems are meant to support drivers with driving process in order to avoid traffic accidents, speed up the traffic and have a higher control over the traffic in general. There are a lot of systems which give support to the drivers, such as adaptive cruise control, traffic sign recognition, automatic parking, etc. ... the vehicular communication systems ... use the capacity of the vehicles to communicate, not only between them but also with infrastructures. All the information is collected and processed to offer use
ful services. Wireless Sensor Networks (WSN) are widely used in this area. With the incoming upgrades of these networks, they are becoming an attractive solution to give support with the communication mechanisms between vehicles." [mi.fu-berlin.de/ inf/ groups/ ag-tech/ teaching/ 2011_ SS/ S_ 19510b_ Proseminar_ Technische_ Informatik/ daniel-lopez-report.pdf?1346662267]
The vehicular network diagram example "Inter-vehicle communication systems" was created using the ConceptDraw PRO diagramming and vector drawing software extended with the Vehicular Networking solution from the Computer and Networks area of ConceptDraw Solution Park.
"Driving is the controlled operation and movement of a vehicle, such as a car, carriage, truck or bus. ...
Driving as a physical skill.
A driver must have physical skills to be able to control direction, acceleration, and deceleration. For motor vehicles, the detailed tasks include:
(1) Starting the vehicle's engine with the starting system.
(2) Setting the transmission to the correct gear.
(3) Depressing the pedals with one's feet to accelerate, slow, and stop the vehicle, and if the vehicle is equipped with a manual transmission, to modulate the clutch.
(4) Steering the vehicle's direction with the steering wheel.
(5) Operating other important ancillary devices such as the indicators, headlights, and windshield wipers.
(6) Observing the environment for hazards." [Driving. Wikipedia]
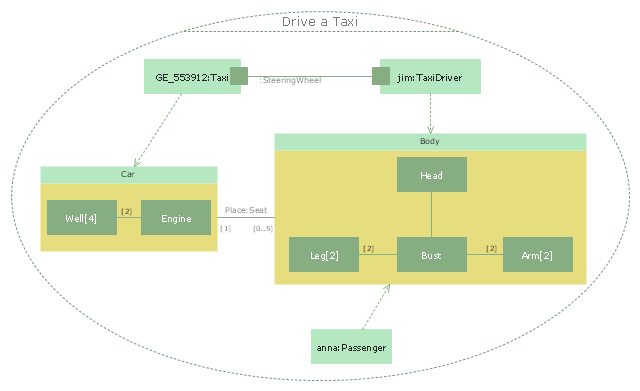
The UML composite structure diagram example "Drive a taxi" was created using the ConceptDraw PRO diagramming and vector drawing software extended with the Rapid UML solution from the Software Development area of ConceptDraw Solution Park.
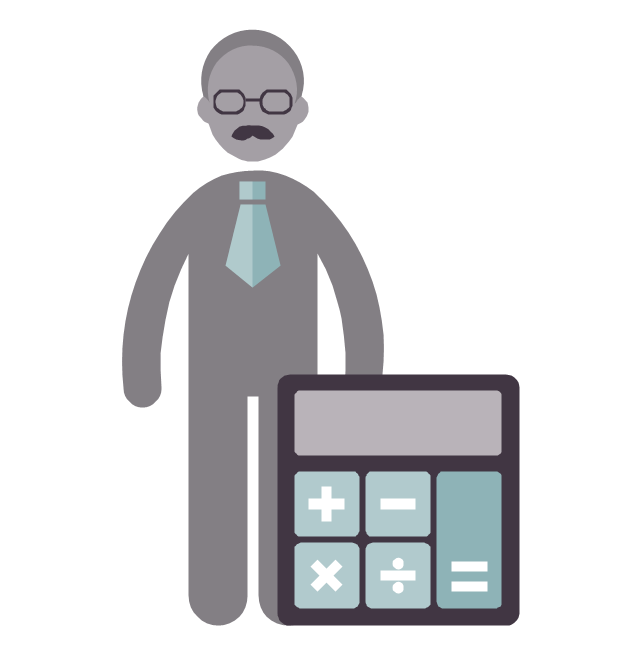
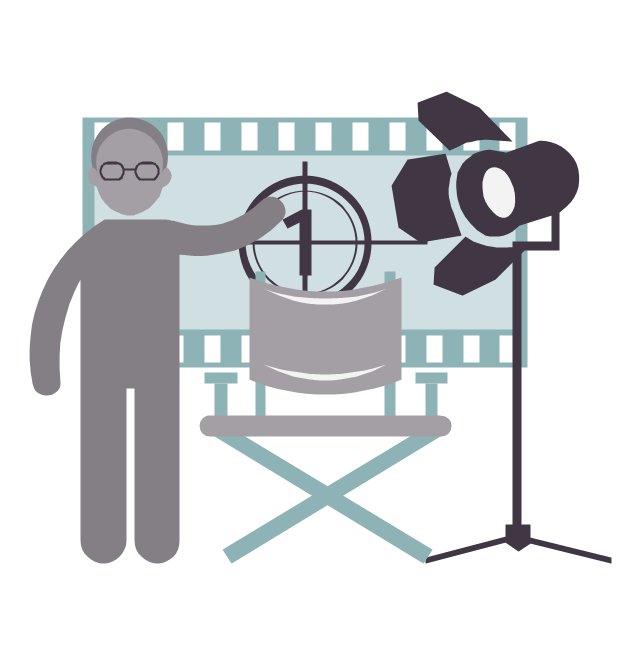
The vector stencils library "HR professions" contains 81 professions pictograms.
Use this HR icon set to draw your HR flowcharts, workflow diagrams, process charts and infographics with the ConceptDraw PRO diagramming and vector drawing software.
The HR pictograms library "HR professions" is included in the HR Flowcharts solution from the Management area of ConceptDraw Solution Park.
HelpDesk
How To Create the Interaction (Relations) Diagram
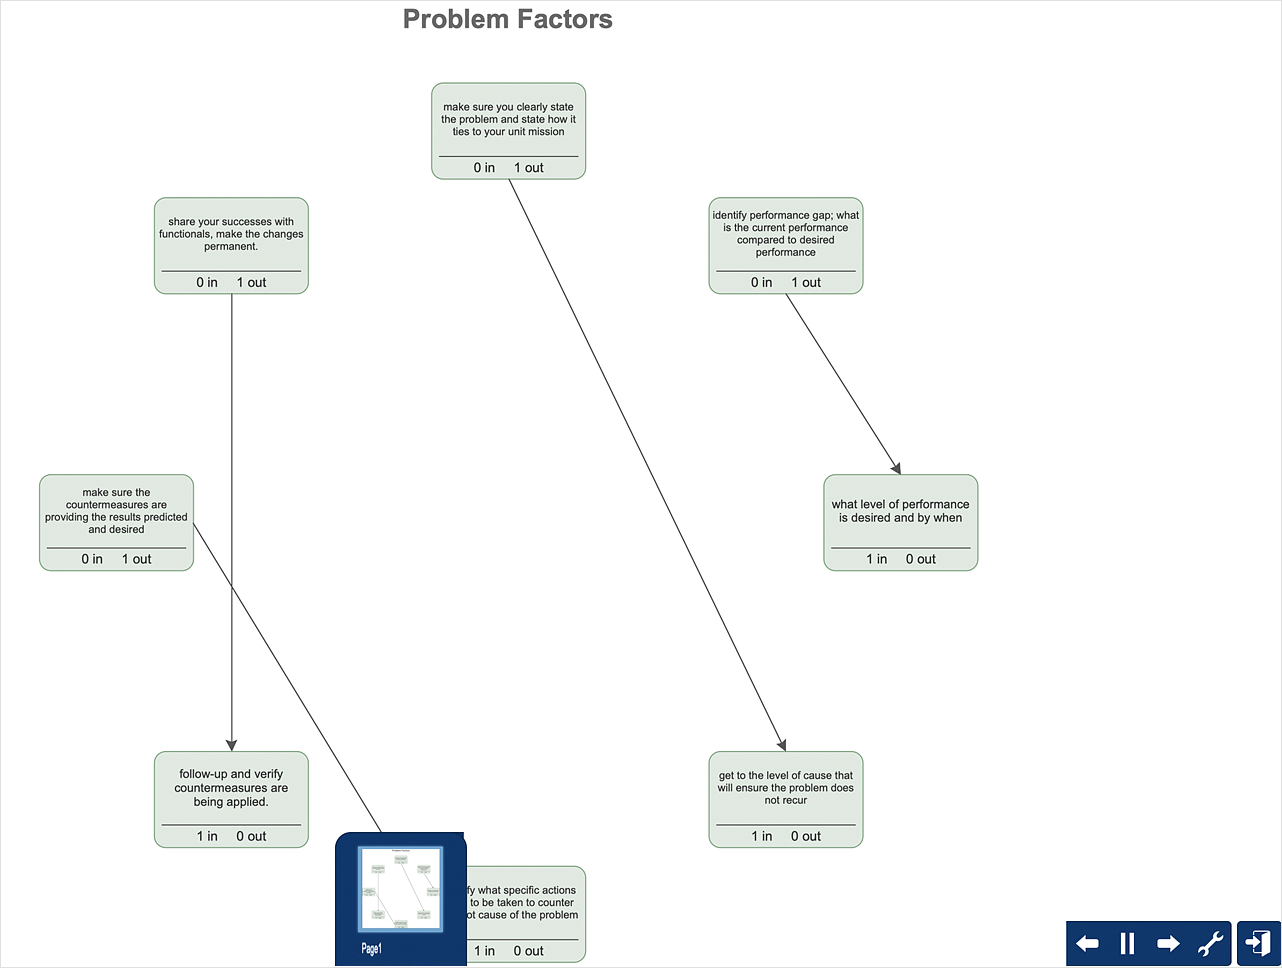
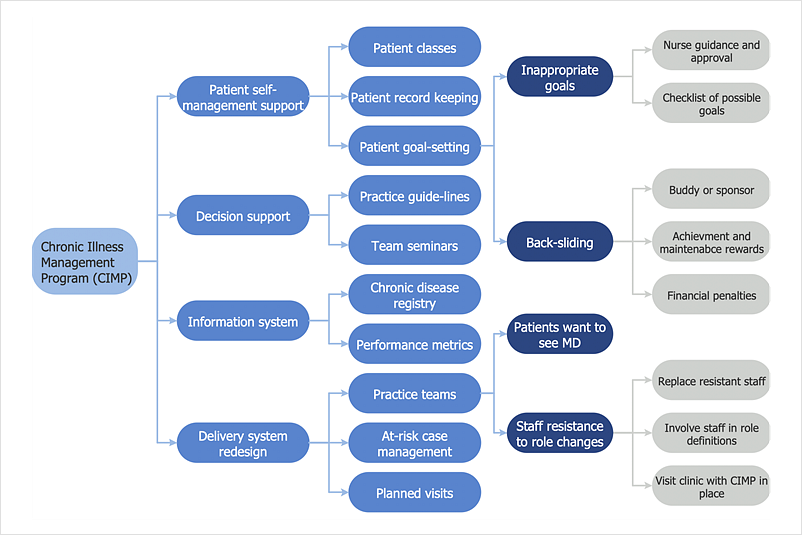
Identify relationships between factors affecting a problem using interaction (relation) diagram. The ability to create a Relation diagram from a mind map is supported by the ConceptDraw Seven Management and Planning Tools solution.Relations Diagram
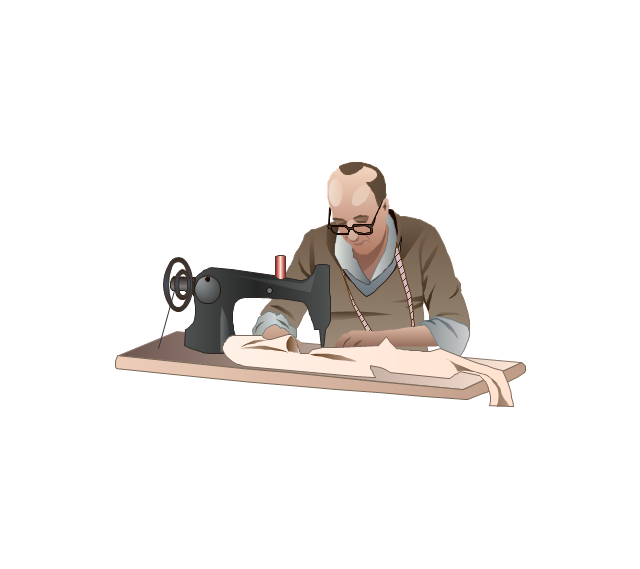
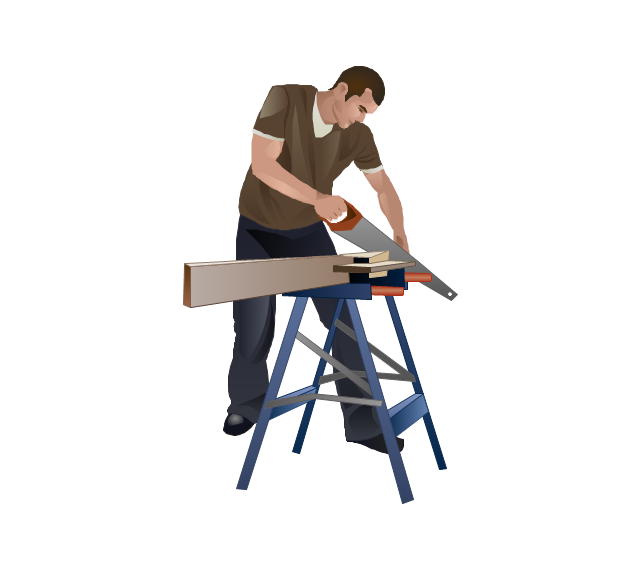
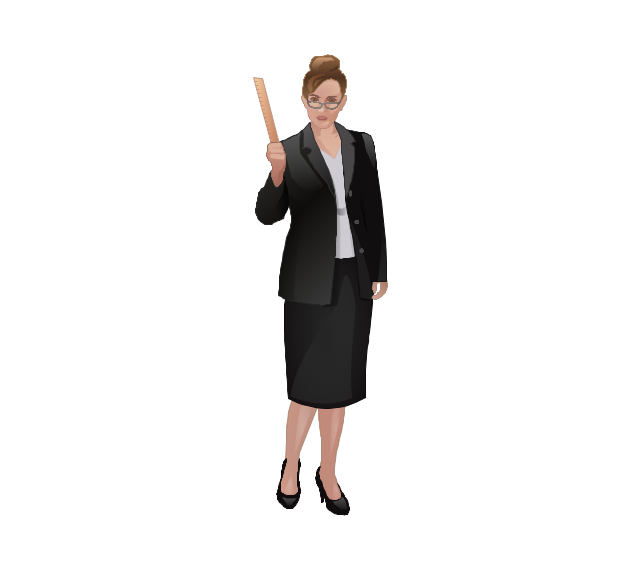
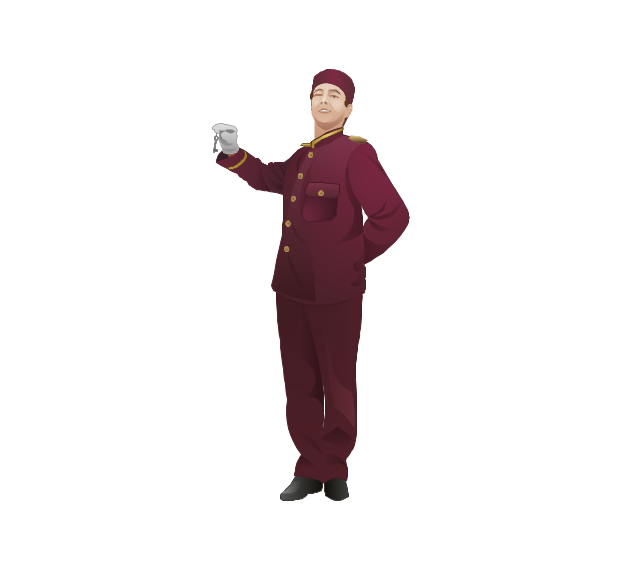
The Relations Diagram is used to identify how the factors influence each other, to determine what factors are causes and what are effects. The factors mostly influencing are called “drivers”, the primarily affected factors are “indicators”. The problem solving is focused on the change of "drivers" factors by applying the corrective actions. The "indicators" factors help establish the Key Performance Indicators (KPIs) to monitor the changes and also define the effectiveness of the corrective actions in resolving a problem. ConceptDraw MINDMAP software ideally suits for designing Relations Diagrams. The easiest way to create the MINDMAP Relations Diagram, is to use the included Relations Diagram input template. Open it in ConceptDraw MINDMAP application from the Input tab and hold a new brainstorming session, identify the central issue and the contributing factors to this issue. Click the Finish Brainstorm button to generate a Mind Map and begin the further work with it, or select Relations Diagram item from the Output tab to automatically draw it in ConceptDraw DIAGRAM application.The vector stencils library "Professions" contains 58 people clipart images of different professions you can use in your presentations, illustrations and infographics.
"Electronic clip art is available in several different file formats. It is important for clip art users to understand the differences between file formats so that they can use an appropriate image file and get the resolution and detail results they need.
Clip art file formats are divided into 2 different types: bitmap or vector graphics. ...
In contrast to the grid format of bitmap images, Vector graphics file formats use geometric modeling to describe an image as a series of points, lines, curves, and polygons. Because the image is described using geometric data instead of fixed pixels, the image can be scaled to any size while retaining "resolution independence", meaning that the image can be printed at the highest resolution a printer supports, resulting in a clear, crisp image. Vector file formats are usually superior in resolution and ease of editing as compared to bitmap file formats, but are not as widely supported by software and are not well-suited for storing pixel-specific data such as scanned photographs. In the early years of electronic clip art, vector illustrations were limited to simple line art representations." [Clip art. Wikipedia]
The clip art example "Professions - Vector stencils library" was created using the ConceptDraw PRO diagramming and vector drawing software extended with the People solution from the Illustration area of ConceptDraw Solution Park.
www.conceptdraw.com/ solution-park/ illustrations-people
Databases Access Objects Model with ConceptDraw DIAGRAM
ConceptDraw Basic gives the opportunity of interaction with any ODBC-compatible databases. For this the Database Access Objects Model is provided. All calls to the database are made by certain methods of objects of this model.HelpDesk
How to Manage Problem Solving Using Seven Management and Planning Tools
Stage by stage gouide on using visual tools to move toward solving the problem.
This financila dashboard example was drawn on the base of the Enterprise dashboard from the Mecklenburg County Government website.
[charmeck.org/ mecklenburg/ county/ CountyManagersOffice/ OMB/ dashboards/ Pages/ Enterprise.aspx]
"In management information systems, a dashboard is "an easy to read, often single page, real-time user interface, showing a graphical presentation of the current status (snapshot) and historical trends of an organization’s key performance indicators to enable instantaneous and informed decisions to be made at a glance."
For example, a manufacturing dashboard may show key performance indicators related to productivity such as number of parts manufactured, or number of failed quality inspections per hour. Similarly, a human resources dashboard may show KPIs related to staff recruitment, retention and composition, for example number of open positions, or average days or cost per recruitment.
Types of dashboards.
Dashboard of Sustainability screen shot illustrating example dashboard layout.
Digital dashboards may be laid out to track the flows inherent in the business processes that they monitor. Graphically, users may see the high-level processes and then drill down into low level data. This level of detail is often buried deep within the corporate enterprise and otherwise unavailable to the senior executives.
Three main types of digital dashboard dominate the market today: stand alone software applications, web-browser based applications, and desktop applications also known as desktop widgets. The last are driven by a widget engine.
Specialized dashboards may track all corporate functions. Examples include human resources, recruiting, sales, operations, security, information technology, project management, customer relationship management and many more departmental dashboards.
Digital dashboard projects involve business units as the driver and the information technology department as the enabler. The success of digital dashboard projects often depends on the metrics that were chosen for monitoring. Key performance indicators, balanced scorecards, and sales performance figures are some of the content appropriate on business dashboards." [Dashboard (management information systems). Wikipedia]
The example "Enterprise dashboard" was created using the ConceptDraw PRO diagramming and vector drawing software extended with the Composition Dashboard solution from the area "What is a Dashboard" of ConceptDraw Solution Park.
- Cab Driver Project Dfd
- Diagram Of Hammer Plier And Screw Driver
- Driver
- Driver Hiring Vector
- Audio - Vector stencils library
- PROBLEM ANALYSIS. Prioritization Matrix | How To Create a ...
- Taxi order process - BPMN 1.2 diagram | Taxi service order ...
- Integrated circuit - Vector stencils library | Integrated circuit - Vector ...
- Directions Maps | Directions Map | Maps Driving Directions ...
- Directional Maps | Maps and Directions | Maps Driving Directions ...
- Taxi service order procedure - BPMN 1.2 diagram | Taxi order ...
- Design elements - 3D directional maps | Directional Maps | Maps ...
- HR professions - Vector stencils library
- Landscape Architecture with ConceptDraw PRO | Interactive Voice ...
- UML Use Case Diagram Example Registration System | UML activity ...
- HR professions - Vector stencils library | Professions - Vector ...
- Business process diagram BPMN 1.2 - Hiring process | How to ...
- Cashier Icon
- Farmer Icon

