HelpDesk
How to Create a Timeline Diagram in ConceptDraw PRO
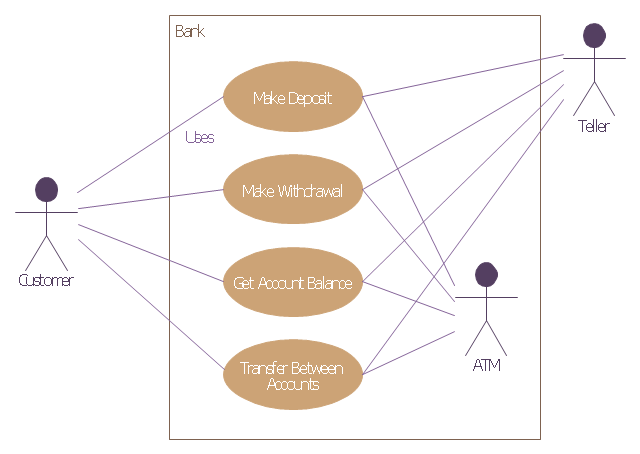
A Timeline is a chart which displays a project plan schedule in chronological order. A Timeline is used in project management to depict project milestones and visualize project phases, and show project progress. The graphic form of a timeline makes it easy to understand critical project milestones, such as the progress of a project schedule. Timelines are particularly useful for project scheduling or project management when accompanied with a Gantt chart. It captures the main of what the project will accomplish and how it will be done. making a project timeline is one of the most important skills a project manager needs have. Making comprehensive, accurate timelines allows you getting every project off in the best way. ConceptDraw PRO allows you to draw a timeline charts using special library.This example of bank ATM UML activity diagram was created on the base of UML use case diagram of automated teller machine from the course "Thinking in Java, 2nd edition, Revision 9" by Bruce Eckel published on the website of the Computer Science and Electrical Engineering Department of the University of Maryland, Baltimore (UMBC).
"If you are designing an auto-teller, for example, the use case for a particular aspect of the functionality of the system is able to describe what the auto-teller does in every possible situation. Each of these “situations” is referred to as a scenario, and a use case can be considered a collection of scenarios. You can think of a scenario as a question that starts with: “What does the system do if...?” For example, “What does the auto-teller do if a customer has just deposited a check within the last 24 hours, and there’s not enough in the account without the check having cleared to provide a desired withdrawal?”
Use case diagrams are intentionally simple to prevent you from getting bogged down in system implementation details prematurely...
Each stick person represents an “actor,” which is typically a human or some other kind of free agent. (These can even be other computer systems, as is the case with “ATM.”) The box represents the boundary of your system. The ellipses represent the use cases, which are descriptions of valuable work that can be performed with the system. The lines between the actors and the use cases represent the interactions.
It doesn’t matter how the system is actually implemented, as long as it looks like this to the user."
[csee.umbc.edu/ courses/ 331/ resources/ tij/ text/ TIJ213.gif]
This automated teller machine (ATM) UML use case diagram example was created using the ConceptDraw PRO diagramming and vector drawing software extended with the ATM UML Diagrams solution from the Software Development area of ConceptDraw Solution Park.
- How to use Each and Every | How it works : eLearning | eLearning ...
- Each And Every
- Each Node Is Connected To Every Other Node By Direct Link In
- Various Types Of Box Used In Flow Chart Every Box With Explain
- Every Player Position Area In The Football Field Pdf
- eLearning - Easy English on Skype | eLearning: Speaking English ...
- Skype as eLearning Platform | How Teachers Use Skype for ...
- Add Two Numbers Using Flowchart And Show Every Step
- How Teachers Use Skype for eLearning | eLearning - Easy English ...
- eLearning for Skype | How Teachers Use Skype for eLearning ...
- eLearning: Speaking English | How Teachers Use Skype for ...
- Organizational Structure | Orgchart | Emergency Plan | The Different ...
- Context Diagram Template | Root Cause Tree Diagram | Influence ...
- How to Draw an Organization Chart | Organizational Structure ...
- Language Learning | Language School E-Learning | Sentence ...
- Fire Evacuation Plan Template | Emergency Plan | Restaurant Floor ...
- eLearning for Skype | Entity-Relationship Diagram (ERD) | Entity ...
- Vehicular ad-hoc network | Conventional and wireless ad hoc ...
- Free Sentence Diagrammer | Compound sentence | The Reed ...

