HelpDesk
How to Create an Electrical Diagram Using ConceptDraw PRO
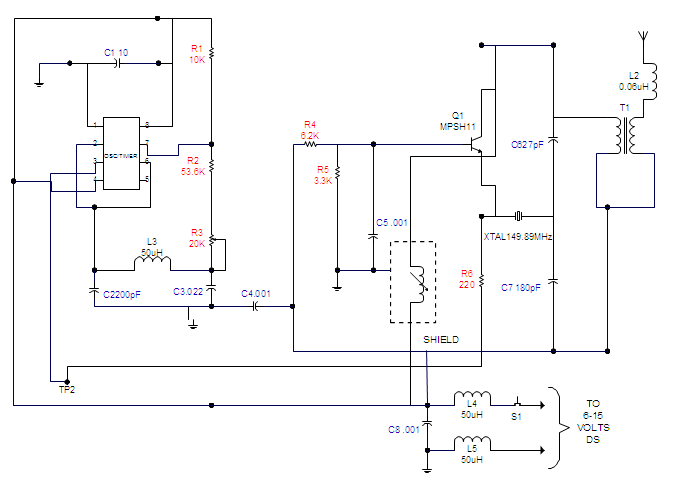
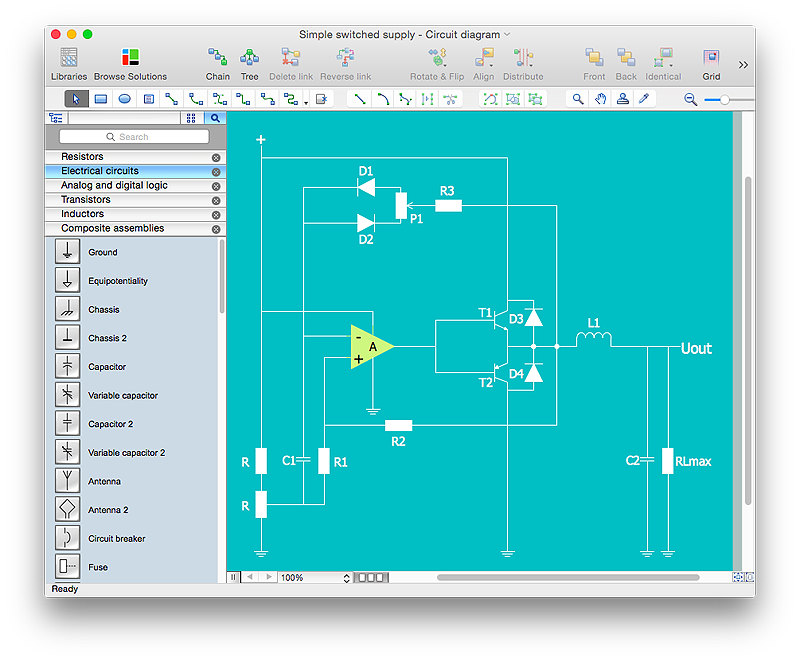
There are many of different electric circuit symbols that can be used in a circuit diagram. Knowing how to read circuit diagrams is a useful skill not only for professionals, but for any person who can start creating his own small home electronic projects. The circuit diagram shows the scheme of a location of components and connections of the electrical circuit using a set of standard symbols. It can be use for graphical documentation of an electrical circuit components. The ability to create electrical diagrams and schematic using ConceptDraw PRO is delivered by the Electrical Engineering solution. The solution supplied with samples, templates and libraries of design elements for drawing electrical schematics, digital and analog logic, circuit and wiring schematics and diagrams, power systems diagrams, maintenance and repair diagrams for electronics and electrical engineering.Process Flowchart
The main reason of using Process Flowchart or PFD is to show relations between major parts of the system. Process Flowcharts are used in process engineering and chemical industry where there is a requirement of depicting relationships between major components only and not include minor parts. Process Flowcharts for single unit or multiple units differ in their structure and implementation. ConceptDraw PRO is Professional business process mapping software for making Process flowcharts, Process flow diagram, Workflow diagram, flowcharts and technical illustrations for business documents and also comprehensive visio for mac application. Easier define and document basic work and data flows, financial, production and quality management processes to increase efficiency of your business with ConcepDraw PRO. Business process mapping software with Flowchart Maker ConceptDraw PRO includes extensive drawing tools, rich examples and templates, process flowchart symbols and shape libraries, smart connectors that allow you create the flowcharts of complex processes, process flow diagrams, procedures and information exchange. Process Flowchart Solution is project management workflow tools which is part ConceptDraw Project marketing project management software. Drawing charts, diagrams, and network layouts has long been the monopoly of Microsoft Visio, making Mac users to struggle when needing such visio alternative like visio for mac, it requires only to view features, make a minor edit to, or print a diagram or chart. Thankfully to MS Visio alternative like ConceptDraw PRO software, this is cross-platform charting and business process management tool, now visio alternative for making sort of visio diagram is not a problem anymore however many people still name it business process visio tools.
 ConceptDraw Solution Park
ConceptDraw Solution Park collects graphic extensions, examples and learning materials
 Electrical Engineering
This solution extends ConceptDraw PRO v.9.5 (or later) with electrical engineering samples, electrical schematic symbols, electrical diagram symbols, templates and libraries of design elements, to help you design electrical schematics, digital and analog
HelpDesk
How to Draw an Electrical Scheme Using ConceptDraw Solution Park
The ability to visualize industrial systems in electronics, electrical, chemical, process, and mechanical engineering is delivered by the ConceptDraw Engineering solution.
 HR Flowcharts
Human resource management diagrams show recruitment models, the hiring process and human resource development of human resources.
 Sales Flowcharts
The Sales Flowcharts solution lets you create and display sales process maps, sales process workflows, sales steps, the sales process, and anything else involving sales process management.
 Audit Flowcharts
Audit flowcharts solution extends ConceptDraw PRO software with templates, samples and library of vector stencils for drawing the audit and fiscal flow charts.
 Flowcharts
The Flowcharts solution for ConceptDraw PRO is a comprehensive set of examples and samples in several varied color themes for professionals that need to represent graphically a process. Solution value is added by the basic flow chart template and shapes' libraries of flowchart notation. ConceptDraw PRO flow chart creator lets one depict the processes of any complexity and length, as well as design the Flowchart either vertically or horizontally.
How To use House Electrical Plan Software
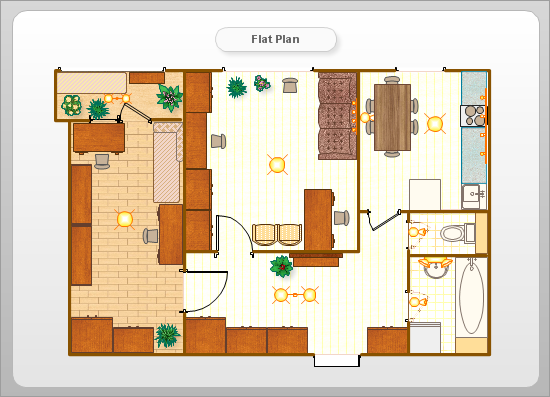
How we can conduct the electricity at house correctly without a plan? It is impossible. The House electrical diagram depicts locations of switches, outlets, dimmers and lights, and lets understand how you will connect them. But design of House Electrical Plan looks a complex task at a glance, which requires a lot of tools and special experience. But now all is simple with all-inclusive floor plan software - ConceptDraw PRO. As a house electrical plan software, the ConceptDraw PRO contains libraries with a large range of professional lighting and electrical symbols, ready-to-use electrical plans samples and examples, and built-in templates for creating great-looking Home floor electrical plans. It is a fastest way to draw Electrical circuit diagrams, Electrical wiring and Circuit schematics, Digital circuits, Electrical equipment, House electrical plans, Satellite television, Cable television, Home cinema, Closed-circuit television when are used the tools of Electric and Telecom Plans Solution from ConceptDraw Solution Park. Files created in Visio for Mac app can be easily imported to ConceptDraw PRO. Also you may import stencils and even libraries. Try for free an alternative to Visio that Apple users recommend.
Types of Flowcharts
A Flowchart is a graphical representation of process, algorithm, workflow or step-by-step solution of the problem. It shows the steps as boxes of various kinds and connects them by arrows in a defined order depicting a flow. There are twelve main Flowchart types: Basic Flowchart, Business Process Modeling Diagram (BPMN), Cross Functional Flowchart, Data Flow Diagram (DFD), IDEF (Integrated DEFinition) Flowchart, Event-driven Process Chain (EPC) Diagram, Influence Diagram (ID), Swimlane Flowchart, Process Flow Diagram (PFD), Specification and Description Language (SDL) Diagram, Value Stream Mapping, Workflow Diagram. Using the Flowcharts solution from the Diagrams area of ConceptDraw Solution Park you can easy and quickly design a Flowchart of any of these types. This solution offers a lot of special predesigned vector symbols for each of these widely used notations. They will make the drawing process of Flowcharts much easier than ever. Pay also attention for the included collection of ready Flowchart examples, samples and quick-start templates. This is business process improvement tools. If you are looking for MS Visio for your Mac, then you are out of luck, because it hasn't been released yet. However, you can use Visio alternatives that can successfully replace its functions. ConceptDraw PRO is an alternative to MS Visio for Mac that provides powerful features and intuitive user interface for the same.
 Accounting Flowcharts
Accounting Flowcharts solution extends ConceptDraw PRO software with templates, samples and library of vector stencils for drawing the accounting flow charts.
How To use Appliances Symbols for Building Plan
One of the obligatory documents that is included to design project of home, appartment, office center, or any other premise is the plan of arrangement of different appliances and home appliances. Creation the plan of such kind lets you to preplan the location of appliances, to make sure in convenience of their location and to envisage all nuances. Well thought-out plan helps to avoid mistakes and future reworks, especially in relation to the location of major and large appliances. ConceptDraw PRO software extended with Floor Plans solution offers the perfect set of drawing tools, samples, examples, templates and ready-to-use vector objects that let you easily develop best layouts for your rooms, kitchen, bathroom, laundry, etc. Ready-made symbols of appliances included to the Appliances library are ideal and even indispensible for designing professional building plans and appliances layouts for homes, commercial and office premises. When designing your plans, you can make several variants and choose the best solution.
How To Create Restaurant Floor Plan in Minutes
Developing Floor Plans, Design Drawings, Plans of Furniture Placement for restaurants and cafes is one of the most responsible and important steps at their construction and designing. Selection of favorable design, the right style of furniture and decors largely determine the success and atmosphere of the institution. The restaurant floor planner ConceptDraw PRO is a perfect choice for architects and designers. Enhanced with Cafe and Restaurant Floor Plans solution it offers a lot of extensive vector symbol libraries and building plan elements for drawing Restaurant floor plans, Restaurant layouts, Restaurant furniture layouts, Cafe floor plans, Bar area floor plan, Fast food restaurant plan, etc. With ConceptDraw PRO you don't need to be an artist to create great-looking restaurant floor plan drawings in minutes, all needed drawing tools are delivered by Building Plans area solutions. Construct your own general plan of restaurant's premises, choose the furniture for your taste from the Cafe and Restaurant Floor Plans solution libraries and arrange it on the plan as you desire fast and easy. ConceptDraw PRO has many of the features found in Visio for Mac such as Drawing, Connection, Shape and Editing Tools.
Business diagrams & Org Charts with ConceptDraw PRO
The business diagrams are in great demand, they describe the business processes, business tasks and activities which are executed to achieve specific organizational and business goals, increase productivity, reduce costs and errors. They let research and better understand the business processes. ConceptDraw PRO is a powerful professional cross-platform business graphics and business flowcharting tool which contains hundreds of built-in collections of task-specific vector stencils and templates. They will help you to visualize and structure information, create various Business flowcharts, maps and diagrams with minimal efforts, and add them to your documents and presentations to make them successful. Among them are Data flow diagrams, Organization charts, Business process workflow diagrams, Audit flowcharts, Cause and Effect diagrams, IDEF business process diagrams, Cross-functional flowcharts, PERT charts, Timeline diagrams, Calendars, Marketing diagrams, Pyramids, Target diagrams, Venn diagrams, Comparison charts, Analysis charts, Dashboards, and many more. Being a cross-platform application, ConceptDraw PRO is very secure, handy, free of bloatware and one of the best alternatives to Visio for Mac users.
- Electrical Symbols And Functions Ppt
- General Schematic Electrical Symbols And Equipment Symbols
- How To use House Electrical Plan Software | Basic Flowchart ...
- Electrical Diagram Symbols | Process Flowchart | Electrical ...
- Process Flowchart | Electrical Engineering | Engineering | Eltrical ...
- Electrical Drawing Software | Process Flowchart | Design elements ...
- Electrical Diagram Symbols | Process Flowchart | Electrical ...
- Process Flowchart | Electrical Engineering | Technical Drawing ...
- Symbol For Different Types Of Light In Electrical Layout
- Basic Flowchart Symbols and Meaning | How To use House ...
- Process Flowchart | Flowchart Software | Electrical Diagram ...
- Symbols For Electrical Installation And Their Functions
- Process Flowchart | How To use House Electrical Plan Software ...
- Basic Flowchart Symbols and Meaning | Entity Relationship ...
- Basic Flowchart Symbols and Meaning | Process Flowchart ...
- Installation Electrical Instrument Symbols
- Chemical and Process Engineering | Process Flowchart | Electrical ...
- Mechanical Drawing Symbols | Basic Flowchart Symbols and ...
- Design elements - Qualifying | Process Flowchart | Cafe electrical ...


