Venn Diagram Examples for Problem Solving. Venn Diagram as a Truth Table
Venn diagrams are illustrations used in the branch of mathematics known as set theory. They show the mathematical or logical relationship between different groups of things (sets). A Venn diagram shows all the possible logical relations between the sets.3 Circle Venn Diagram. Venn Diagram Example
This template shows the Venn Diagram. It was created in ConceptDraw DIAGRAM diagramming and vector drawing software using the ready-to-use objects from the Venn Diagrams Solution from the "Diagrams" area of ConceptDraw Solution Park. Venn Diagrams visualize all possible logical intersections between several sets and are widely used in mathematics, logic, statistics, marketing, sociology, etc.Use this template to design your two-set Venn diagrams.
"A Venn diagram or set diagram is a diagram that shows all possible logical relations between a finite collection of sets. Venn diagrams were conceived around 1880 by John Venn. They are used to teach elementary set theory, as well as illustrate simple set relationships in probability, logic, statistics, linguistics and computer science." [Venn diagram. Wikipedia]
This template "2-set Venn diagram" for the ConceptDraw PRO diagramming and vector drawing software is included in the Venn Diagrams solution from the area "What is a Diagram" of ConceptDraw Solution Park.
3 Circle Venn. Venn Diagram Example
This example shows the 3 Circle Venn Diagram. The Venn Diagrams visualize all possible logical intersections between several sets. On this example you can see the intersections of 3 sets. Venn Diagrams are widely used in mathematics, logic, statistics, marketing, sociology, etc.Venn Diagram Template
It's impossible to overestimate the usefulness and convenience of using the ready templates when you create your own diagrams and charts. And Venn Diagrams are not exception. ConceptDraw DIAGRAM diagramming and vector drawing software presents the Venn Diagrams solution from "Diagrams" area which offers a set of Venn Diagram templates and samples. Use the suitable Venn Diagram Template to create your own Venn Diagram of any complexity.Venn Diagram Examples for Problem Solving. Computer Science. Chomsky Hierarchy
A Venn diagram, sometimes referred to as a set diagram, is a diagramming style used to show all the possible logical relations between a finite amount of sets. In mathematical terms, a set is a collection of distinct objects gathered together into a group, which can then itself be termed as a single object. Venn diagrams represent these objects on a page as circles or ellipses, and their placement in relation to each other describes the relationships between them. The Venn diagram example below visualizes the the class of language inclusions described by the Chomsky hierarchy.2 Circle Venn Diagram. Venn Diagram Example
Using the ready-to-use predesigned objects, samples and templates from the Venn Diagrams Solution for ConceptDraw DIAGRAM you can create your own professional looking Venn Diagrams quick and easy.Circles Venn Diagram
This example shows the 4 Circle Venn Diagram. The Venn Diagram visualizes all possible logical relations between several sets. The sets are represented as circles on the Venn Diagram. On this example you can see the intersections of 4 sets. Venn Diagrams are widely used in mathematics, logic, statistics, marketing, sociology, etc.Venn Diagram Template for Word
This template shows the Venn Diagram. It was created in ConceptDraw DIAGRAM diagramming and vector drawing software using the ready-to-use objects from the Venn Diagrams Solution from the "Diagrams" area of ConceptDraw Solution Park.Venn Diagram Maker
ConceptDraw DIAGRAM diagramming and vector drawing software extended with Venn Diagrams solution from the "Diagrams" area of ConceptDraw Solution Park is a powerful Venn Diagram maker. Create fast and easy your own Venn Diagrams to visualize: all the possible logical relations between sets, simple set relationships in logic, statistics, mathematics, sociology, marketing, summarize the status and future viability of a project.Basic Circles Venn Diagram. Venn Diagram Example
Venn Diagrams visualize all possible logical relations between several sets and are widely used in mathematics, logic, statistics, marketing, sociology, etc. This Venn Diagram shows the relative complement of the set A with respect to the set B. It is the set of the elements in B, but not in A. In other words it is the set-theoretic difference B-A.Cylinder Venn Diagram
You need design Cylinder Venn Diagram? Nothing could be easier with ConceptDraw DIAGRAM diagramming and vector drawing software extended with Venn Diagrams Solution from the “Diagrams” Area. ConceptDraw DIAGRAM allows you to design various Venn Diagrams including Cylinder Venn Diagrams.Venn Diagrams
Venn Diagrams are the intuitive way to work with sets which allows to visualize all possible logical relations between several sets. They are widely used in mathematics, marketing, logic, statistics, sociology, etc. ConceptDraw DIAGRAM diagramming and vector drawing software extended with Venn Diagrams solution from "Diagrams" area offers set of useful drawing tools for easy creating the Venn Diagrams for any quantity of sets.Basketball Court Dimensions
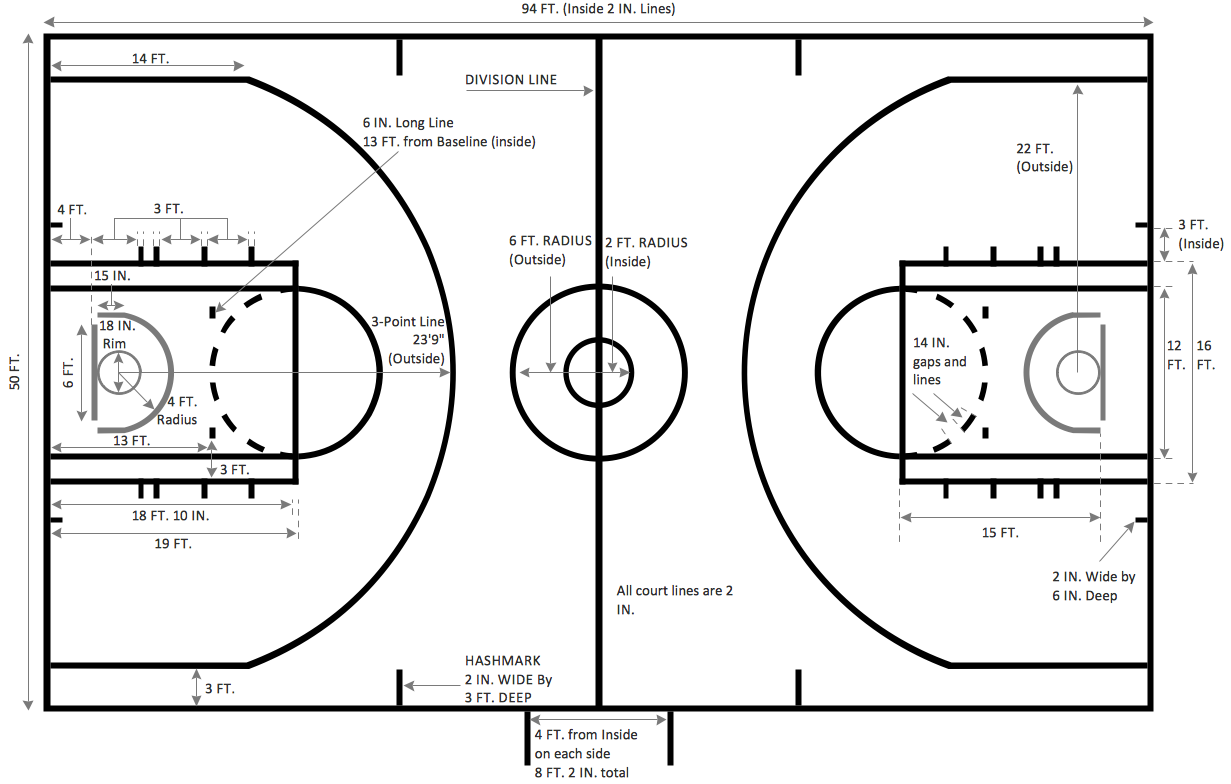
The basketball is a team game with a ball on a specially organized court, which is constructed according to the setted rules and dimensions. The game's standards specify the existence of defined list of equipment on any basketball court, such as backboards, poles, baskets, basketballs, timer, scoreboard, horns, as well as some other additional technical devices. The basketball game's goal is to throw a ball into one of the baskets, that is mounted to a backboard at a certain height on the edges of the court. When planning the construction of basketball court you need primarily create the detailed plan with all dimensions. The Basketball solution from the Sport area of ConceptDraw Solution Park will help you to make it effectively and quickly. This solution was designed as a tool that assists in producing any basketball-related illustrations you need in a few minutes. Use it to illustrate the best and winning positions when training the basketball team, to make the posters when planning the sport competitions, basketball games, sport conferences, etc.Venn Diagram Examples
ConceptDraw DIAGRAM diagramming and vector drawing software extended with Venn Diagrams solution from "Diagrams" area offers a wide set of professionally designed Venn Diagram examples which can become the good start and beautiful source of inspiration for your own Venn Diagrams.- Elementary Diagram
- 2- Set Venn diagram - Template
- Basic Example On Elementary Mathematics Of Flowchart
- Accounting Flowcharts | Venn Diagram | Elementary Knowledge Of ...
- Example Of Elementary Flowchart
- Venn Diagram | Venn Diagrams | 2- Set Venn diagram - Template ...
- Venn diagrams - Vector stencils library | 2- Set Venn diagram ...
- Design elements - Venn diagrams
- Material Requisition Flowchart. Flowchart Examples | Venn Diagram ...
- Venn Diagram | Venn Diagrams | Examples of Flowcharts, Org ...
- Venn Diagram Template | 3 Circle Venn Diagram . Venn Diagram ...
- Venn Diagram Template
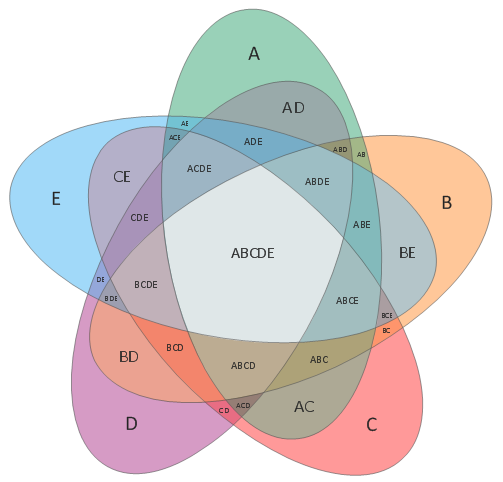
- 5- Set Venn diagram - Template
- How To Make Flowchart In Elementary Algorithms
- Fully Connected Network Topology Diagram | Star Network ...
- Star Network Topology | Hybrid Network Topology | Network ...
- Local area network (LAN). Computer and Network Examples ...
- Wireless access point - Network diagram | Hotel Network Topology ...
- Gane Sarson Diagram | DFD, Gane-Sarson notation - Vector stencils ...


