The vector stencils library "Education charts" contains 12 graphs and charts: area chart, column chart, divided bar diagram, histogram, horizontal bar graph, line graph, pie chart, ring chart, scatter plot.
Use it to create your educational infograms.
"A chart can take a large variety of forms, however there are common features that provide the chart with its ability to extract meaning from data.
Typically the data in a chart is represented graphically, since humans are generally able to infer meaning from pictures quicker than from text. Text is generally used only to annotate the data.
One of the more important uses of text in a graph is the title. A graph's title usually appears above the main graphic and provides a succinct description of what the data in the graph refers to.
Dimensions in the data are often displayed on axes. If a horizontal and a vertical axis are used, they are usually referred to as the x-axis and y-axis respectively. Each axis will have a scale, denoted by periodic graduations and usually accompanied by numerical or categorical indications. Each axis will typically also have a label displayed outside or beside it, briefly describing the dimension represented. If the scale is numerical, the label will often be suffixed with the unit of that scale in parentheses. ...
The data of a chart can appear in all manner of formats, and may include individual textual labels describing the datum associated with the indicated position in the chart. The data may appear as dots or shapes, connected or unconnected, and in any combination of colors and patterns. Inferences or points of interest can be overlaid directly on the graph to further aid information extraction.
When the data appearing in a chart contains multiple variables, the chart may include a legend (also known as a key). A legend contains a list of the variables appearing in the chart and an example of their appearance. This information allows the data from each variable to be identified in the chart." [Chart. Wikipedia]
The shapes example "Design elements - Education charts" was created using the ConceptDraw PRO diagramming and vector drawing software extended with the Education Infographics solition from the area "Business Infographics" in ConceptDraw Solution Park.
Graphs and charts

HelpDesk
How to Create Education Infographics

Basic Flowchart Symbols and Meaning


Organization Chart Software


 Cross-Functional Flowcharts
Cross-functional flowcharts are powerful and useful tool for visualizing and analyzing complex business processes which requires involvement of multiple people, teams or even departments. They let clearly represent a sequence of the process steps, the order of operations, relationships between processes and responsible functional units (such as departments or positions).
Make an Infographic

Educational Technology Tools

 Area Charts
Area Charts are used to display the cumulative totals over time using numbers or percentages; or to show trends over time among related attributes. The Area Chart is effective when comparing two or more quantities. Each series of data is typically represented with a different color, the use of color transparency in an object’s transparency shows overlapped areas and smaller areas hidden behind larger areas.
 Pie Charts
Pie Charts are extensively used in statistics and business for explaining data and work results, in mass media for comparison (i.e. to visualize the percentage for the parts of one total), and in many other fields. The Pie Charts solution for ConceptDraw PRO v10 offers powerful drawing tools, varied templates, samples, and a library of vector stencils for simple construction and design of Pie Charts, Donut Chart, and Pie Graph Worksheets.
 SYSML
SYSML
The SysML solution helps to present diagrams using Systems Modeling Language; a perfect tool for system engineering.
 HR Flowcharts
Human resource management diagrams show recruitment models, the hiring process and human resource development of human resources.
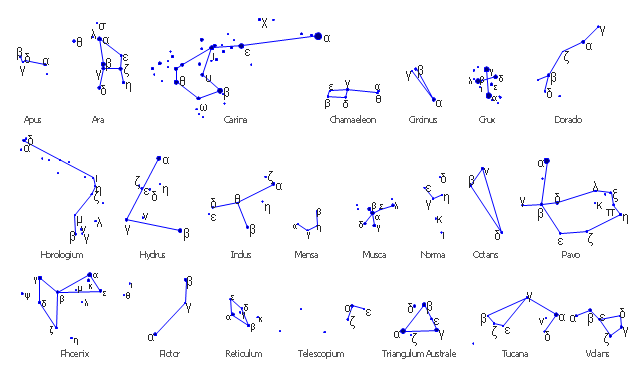
The vector stencils library "Southern constellations" contains 22 star constellations maps for drawing astronomical diagrams.
"In modern astronomy, a constellation is an internationally defined area of the celestial sphere. These areas are grouped around asterisms (which themselves are generally referred to in non-technical language as "constellations"), which are patterns formed by prominent stars within apparent proximity to one another on Earth's night sky.
There are also numerous historical constellations not recognized by the IAU or constellations recognized in regional traditions of astronomy or astrology, such as Chinese, Hindu and Australian Aboriginal." [Constellation. Wikipedia]
The star charts example "Design elements - Southern constellations" was created using the ConceptDraw PRO diagramming and vector drawing software extended with the Astronomy solution from the Science and Education area of ConceptDraw Solution Park.
Southern constellations - Star charts
 Basic Pie Charts
This solution extends the capabilities of ConceptDraw PRO v10.3.0 (or later) with templates, samples, and a library of vector stencils for drawing pie and donut charts.
- Design elements - Education charts | How to Draw a Scatter ...
- Design elements - Education charts | SWOT and TOWS Matrix ...
- Design elements - Education charts | Line Graph | How to Create a ...
- Education charts - Vector stencils library | Education infogram 5 ...
- How to Create a Line Chart | Design elements - Education charts ...
- 2^x Function graph | Design elements - Education charts | Design ...
- Design elements - Education charts | Education infogram 5 ...
- Design elements - Education charts
- Design elements - Education charts | Educationcharts Shape Design
- Pie charts - Vector stencils library | Data-driven charts - Vector ...
- Education | How to Create Education Infographics | Presentations in ...
- Chart Maker for Presentations | Chart Templates | Education charts ...
- Design elements - Nuclear physics | Physics | Education | Nuclear ...
- Design elements - Marketing charts | Design elements - Picture bar ...
- Uses Of Pictogram In Education
- Design elements - Area charts | Area Charts | Basic Area Charts ...
- Design elements - Trigonometric functions | Sine function ...
- Scatter Plot And Charts
- Design elements - Time series charts | Line Chart Examples ...
- Cross-Functional Flowchart (Swim Lanes) | Swim Lane Diagrams ...