"Business process improvement (BPI) is a systematic approach to help an organization optimize its underlying processes to achieve more efficient results. ...
An organization is only as good as its processes. To be able to make the necessary changes in an organization, one needs to understand the key processes of the company. Rummler and Brache suggested a model for running a Process Improvement and Management project (PI&M), containing the following steps:
1. Identify the process to be improved (based on a critical business issue): The identification of key processes can be a formal or informal exercise. The management team might select processes by applying a set of criteria derived from strategic and tactical priorities, or process selection is based on obvious performance gaps. It is important is to select the process(es) which have the greatest impact on a competitive advantage or customer requirement.
2. Develop the objective(s) for the project based on the requirements of the process: The focus might be on quality improvement, productivity, cost, customer service or cycle time. The goal is however always the same; to get the key process under control.
3. Select the members of the cross-functional team: A horizontal (cross-functional) analysis is carried out by a team composed of representatives of all functions involved in the process. While a consultant or in-house staff person can do the job, the quality of the analysis and the commitment to change is far greater with a cross-functional team.
4. Document the current process by creating a flowchart or "organization map": Describe the process regarding the Organizational level, the Process level and the Job/ Performer level according to Rummler. Develop a cross-functional process map for the process.
5. Identify "disconnects" in the process: “Disconnections” are everything that inhibit the efficiency and effectiveness of the process. The identification should be categorized into the three levels: The Organizational level, the Process level and the Job/ Performer level.
6. Recommend changes (organizational, in the process or in its execution): Categorize and prioritize the main problems and possibilities, evaluate alternative solutions. Develop a cross-functional process map for the recommended process.
7. Establish process and sub-process measures: The process measures should reflect the objectives of the project.
8. Implement the improvements." [Business process improvement. Wikipedia]
The opportunity flow chart example "Replacing engine oil" was created using the ConceptDraw PRO diagramming and vector drawing software extended with the Cross-Functional Flowcharts solution from the Business Processes area of ConceptDraw Solution Park.
The vector stencils library "AWS Analytics" contains 9 Amazon Web Services analytics icons: Amazon EMR, Cluster, MapR M3 engine, MapR M5 engine, MapR M7 engine, Engine, Amazon Kinesis, Kinesis-enabled app, AWS Data Pipeline. Use it to draw AWS architecture diagrams of cloud service. AWS analytics services include: Hadoop, Real-time, Machine Learning, Data Warehouse, Data Pipelines. The symbols example "AWS Analytics - Vector stencils library" was created using the ConceptDraw PRO diagramming and vector drawing software extended with the AWS Architecture Diagrams solution from the Computer and Networks area of ConceptDraw Solution Park.
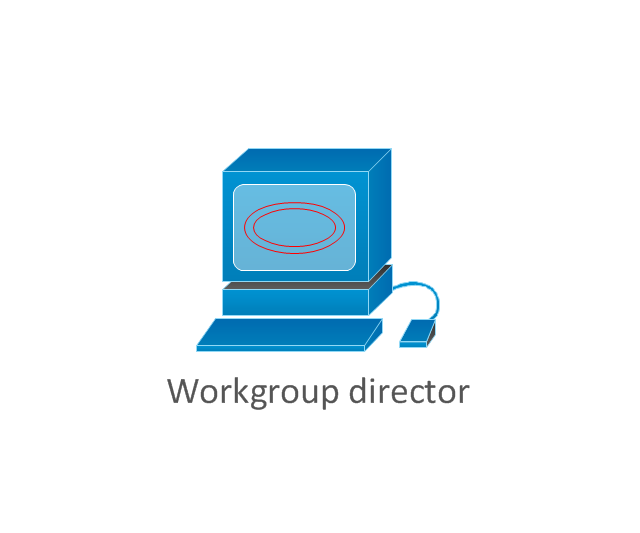
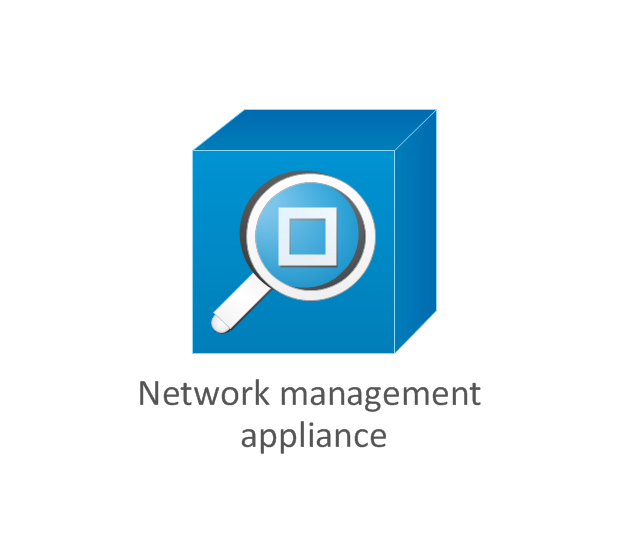
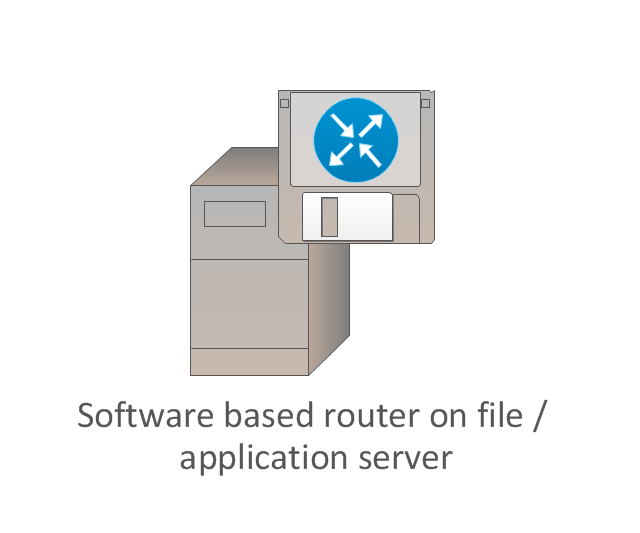
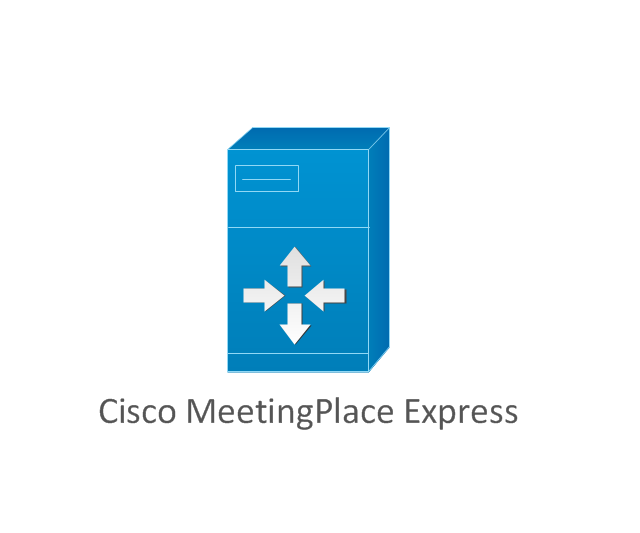
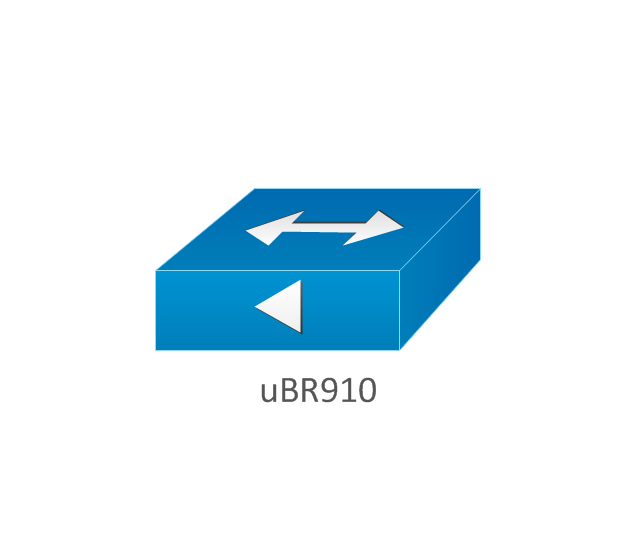
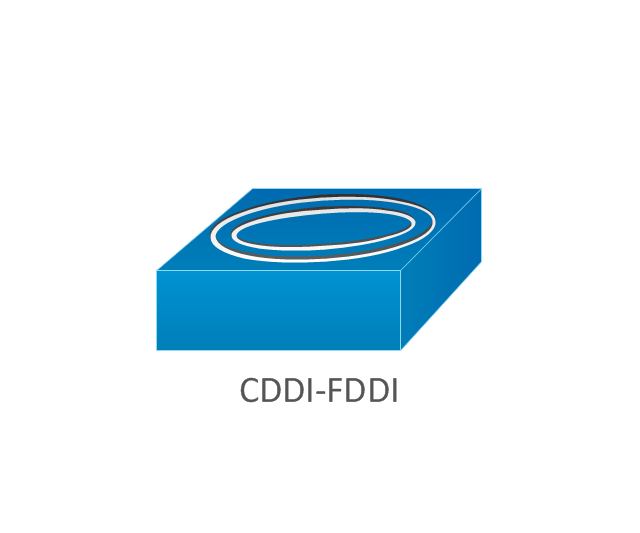
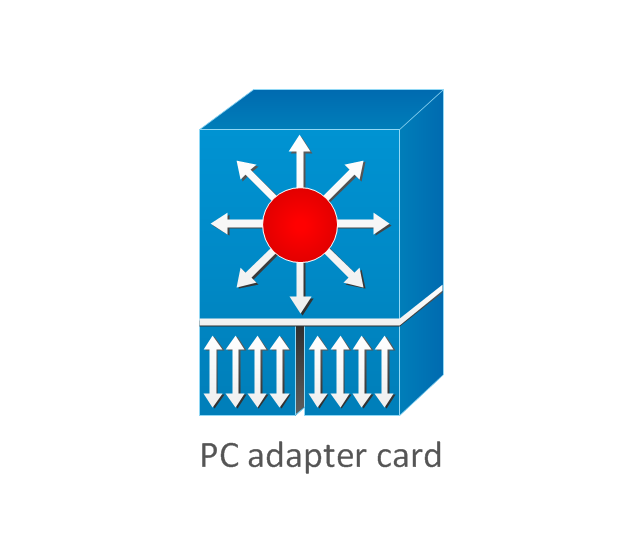
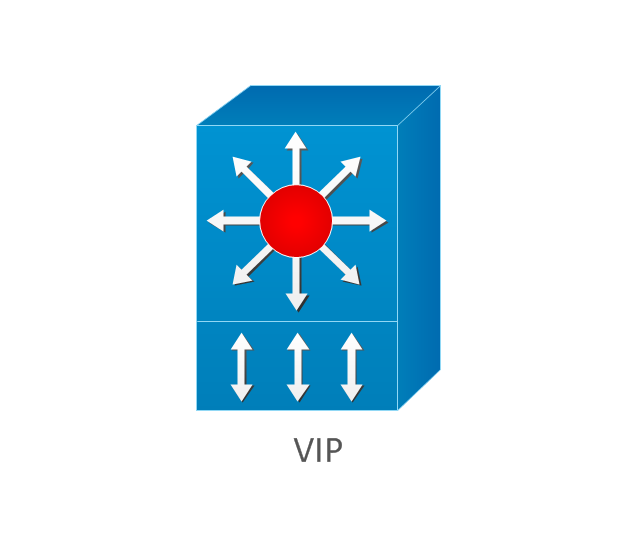
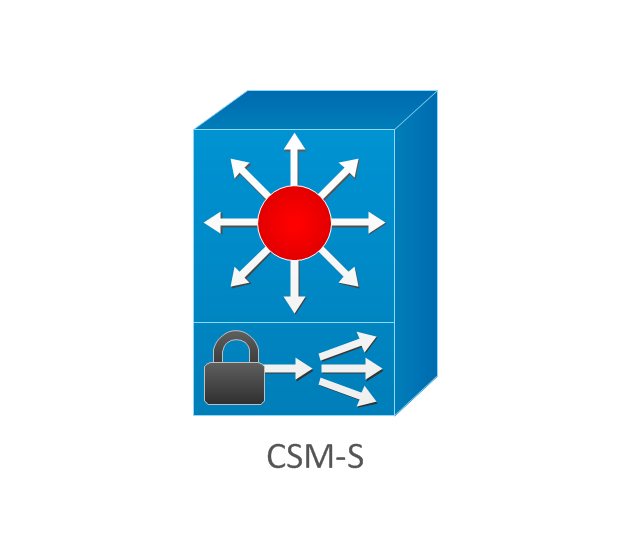
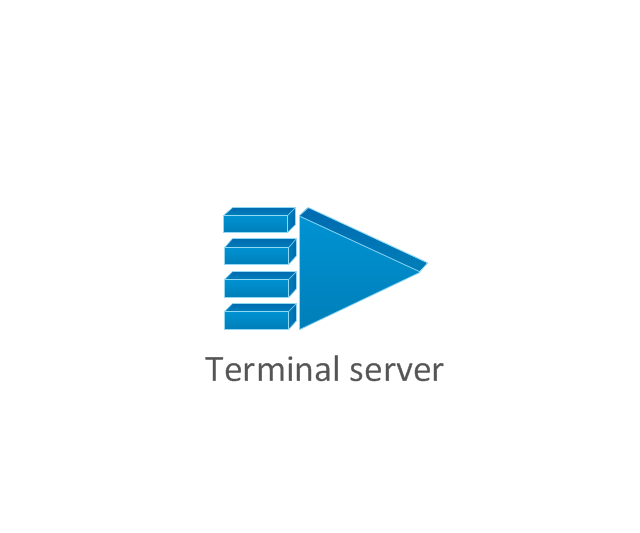
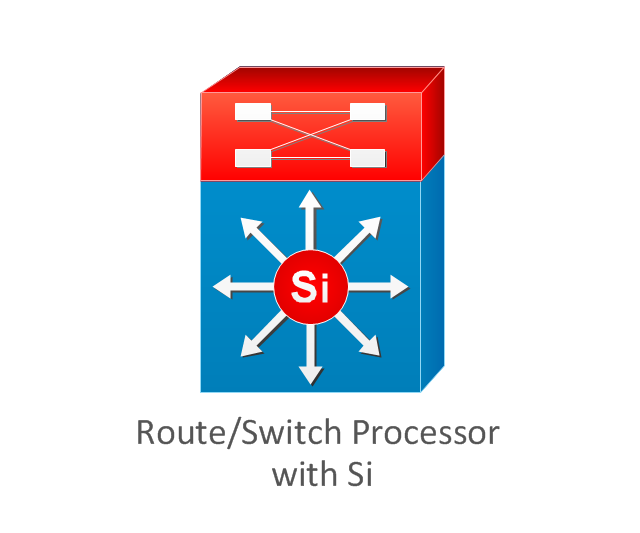
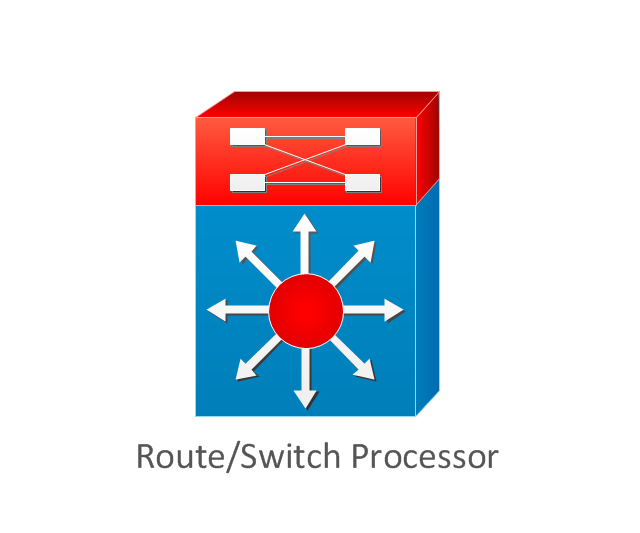
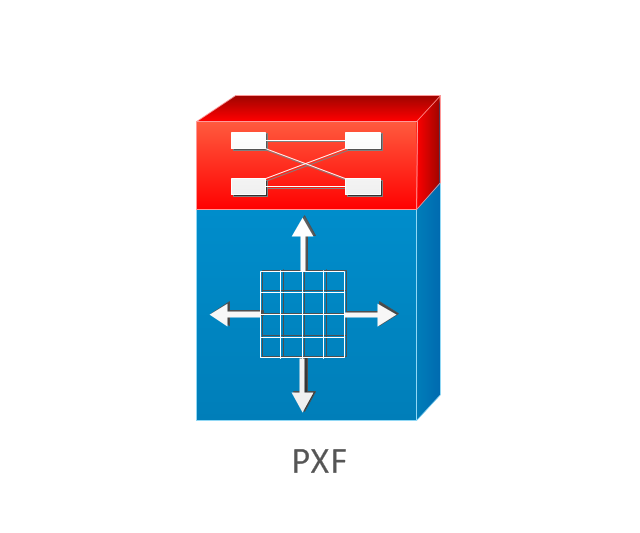
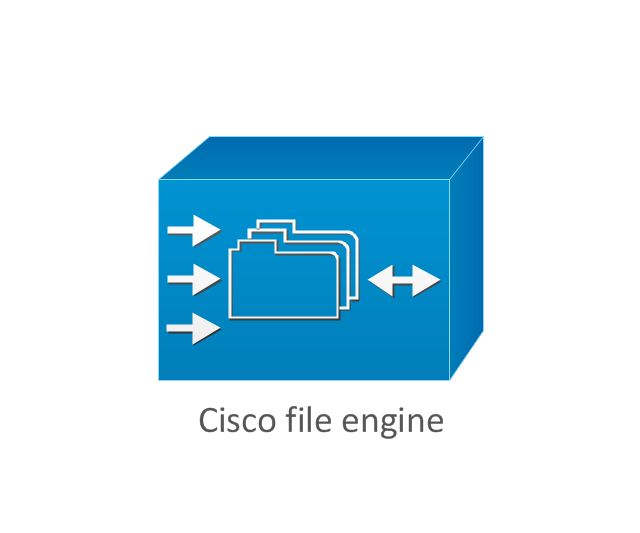
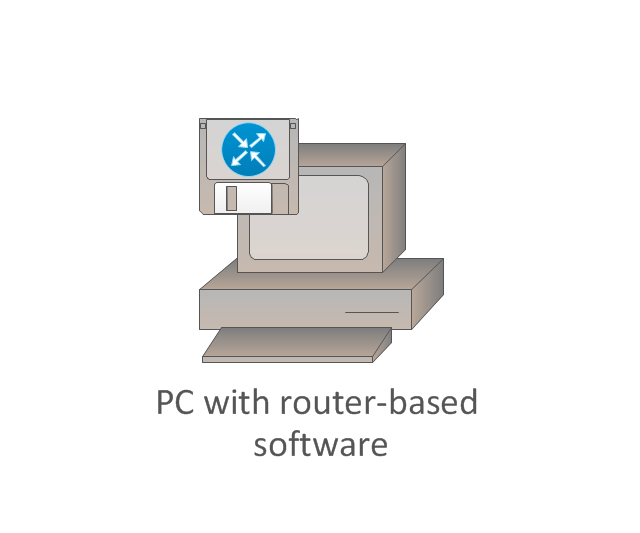
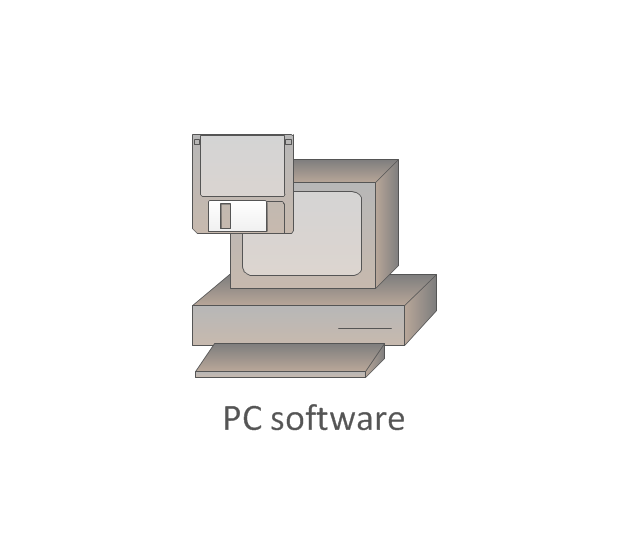
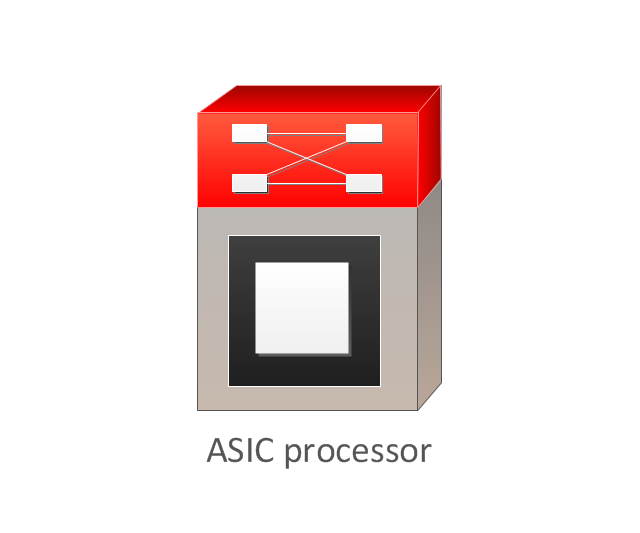
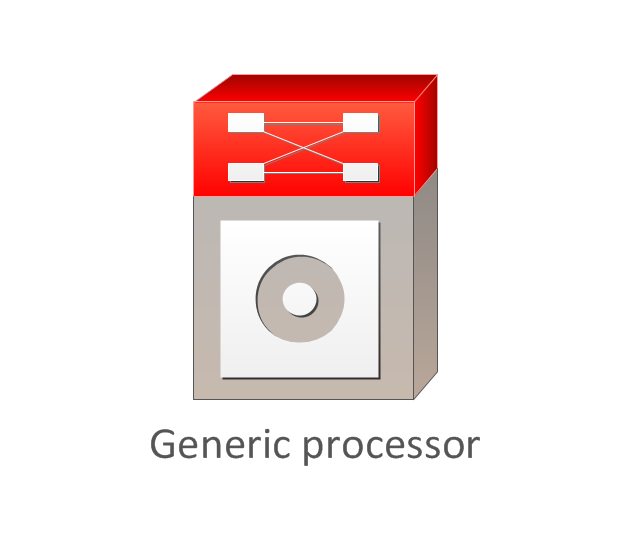
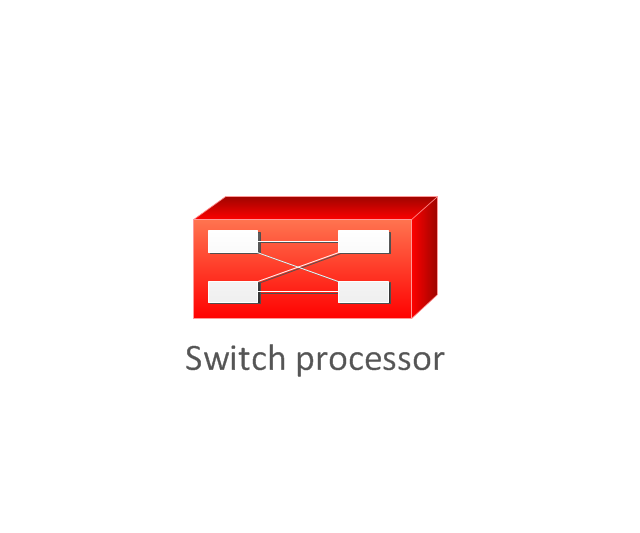
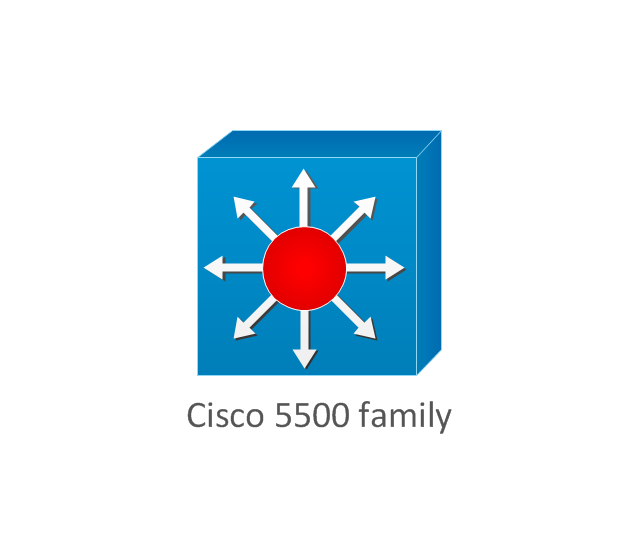
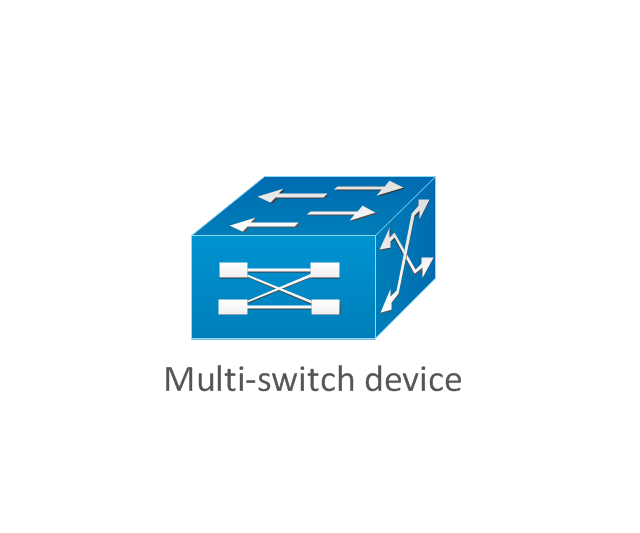
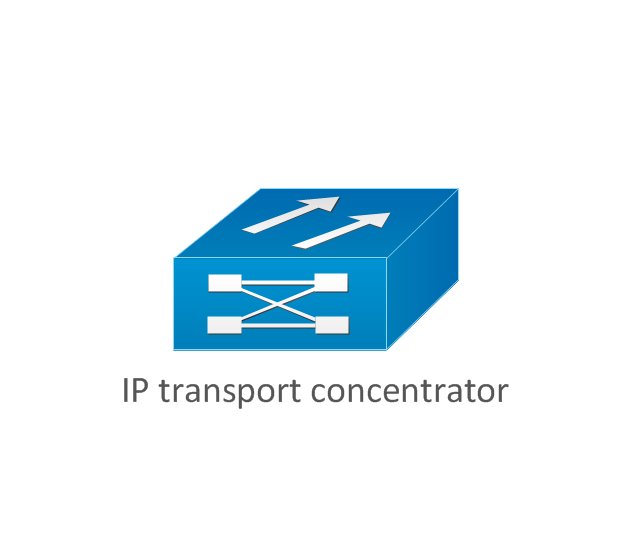
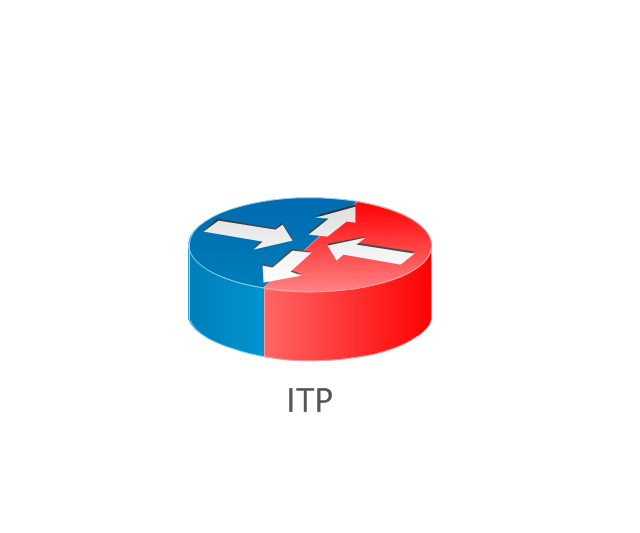
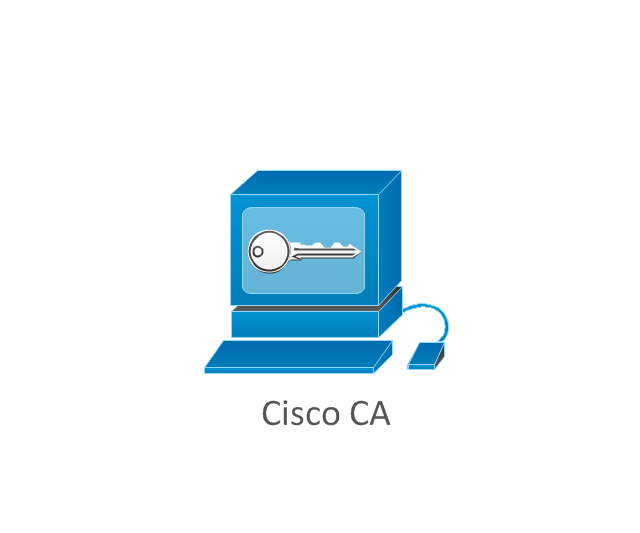
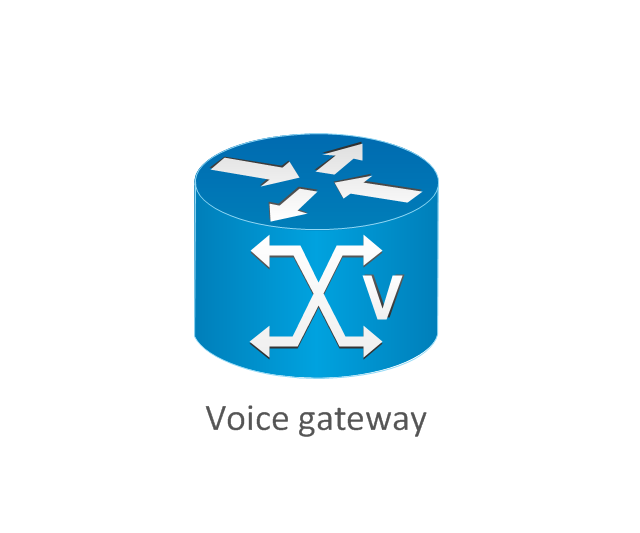
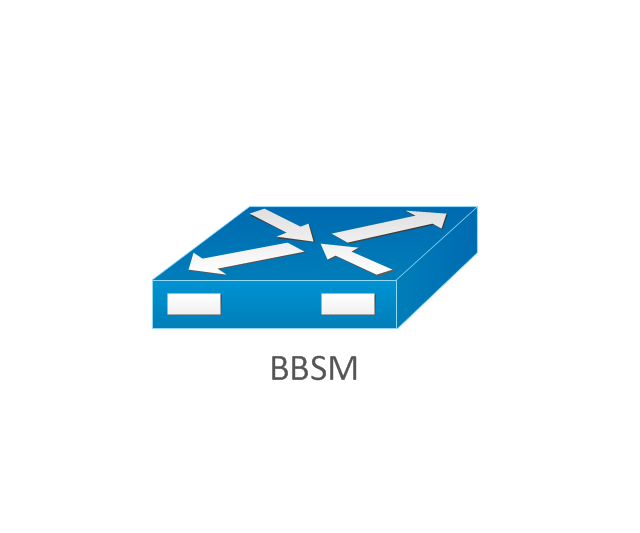
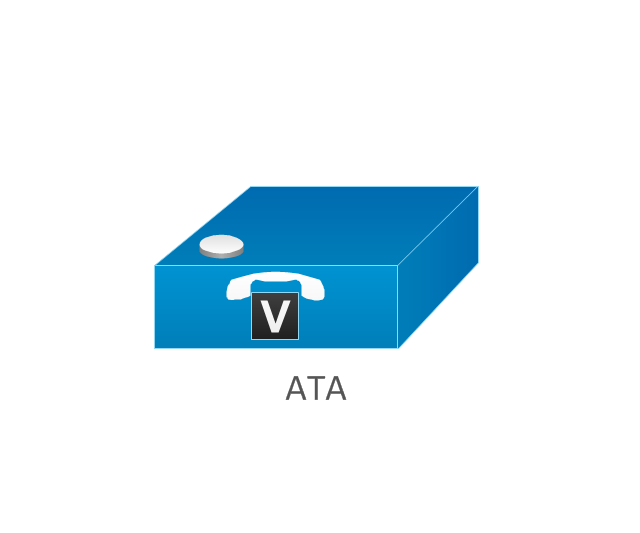
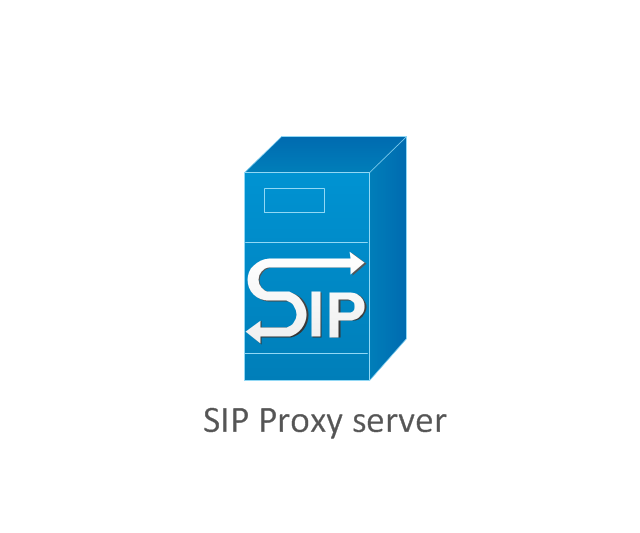
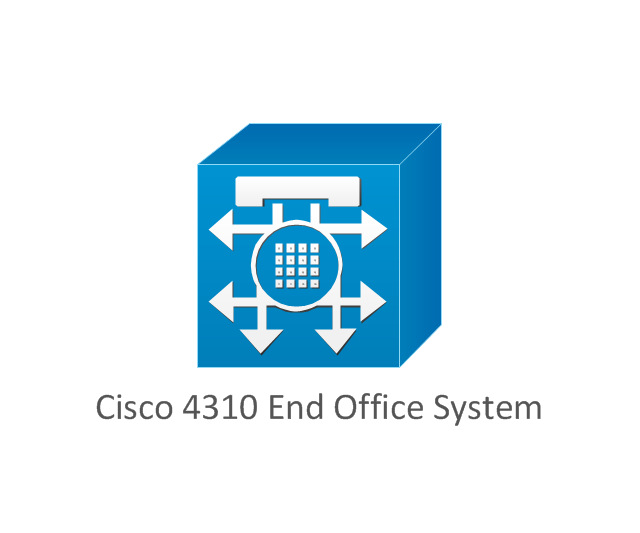
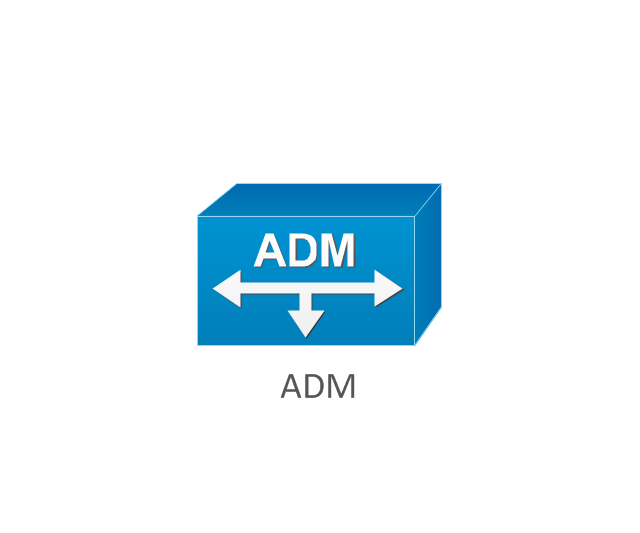
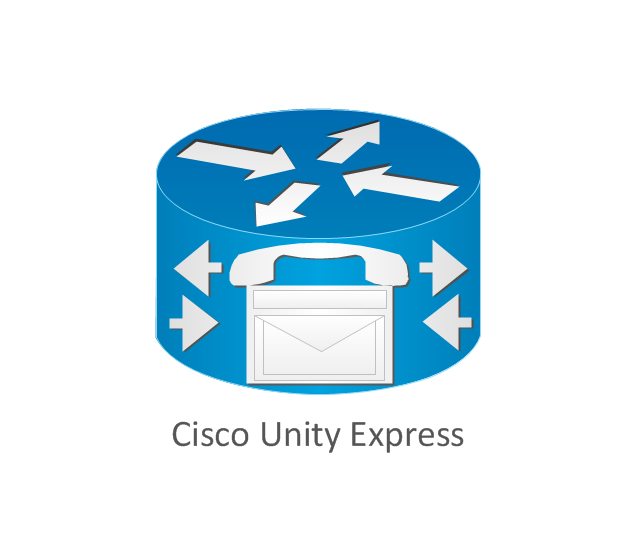
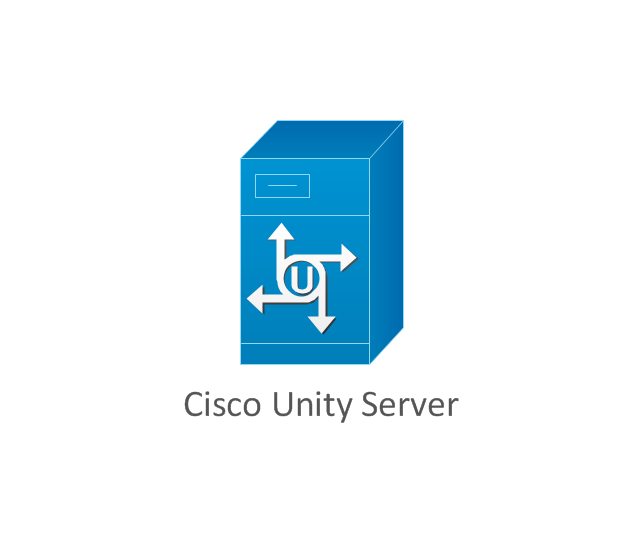
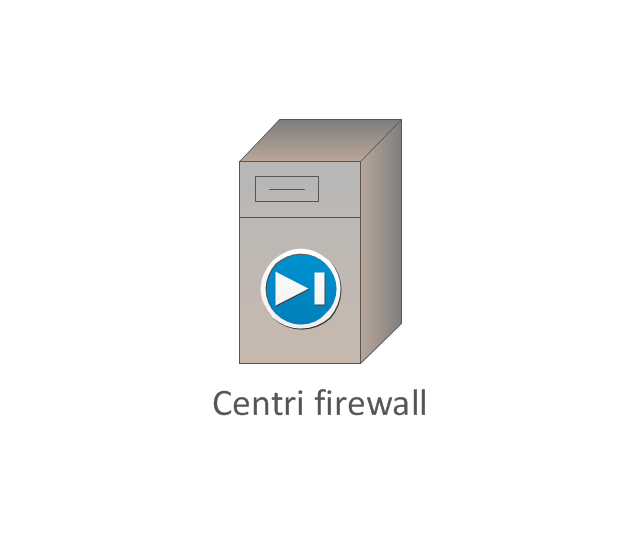
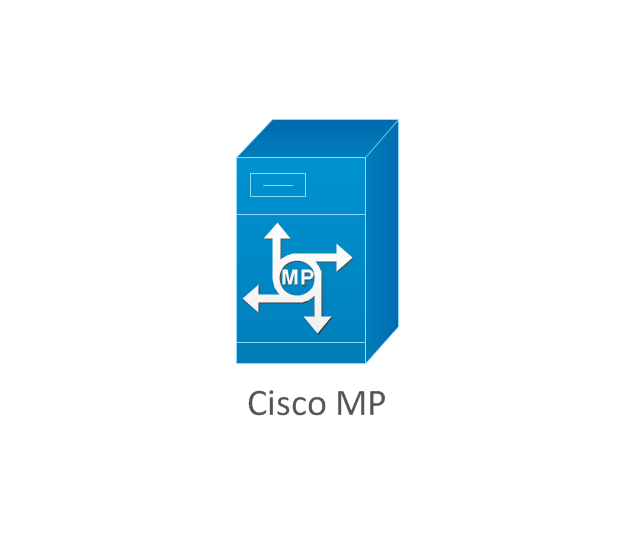
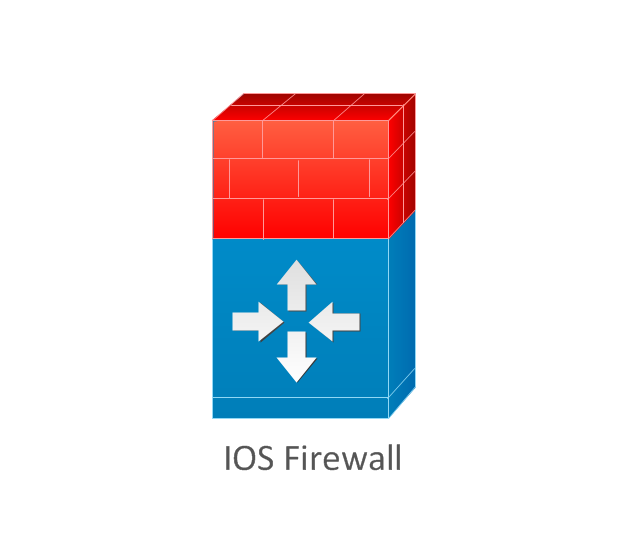
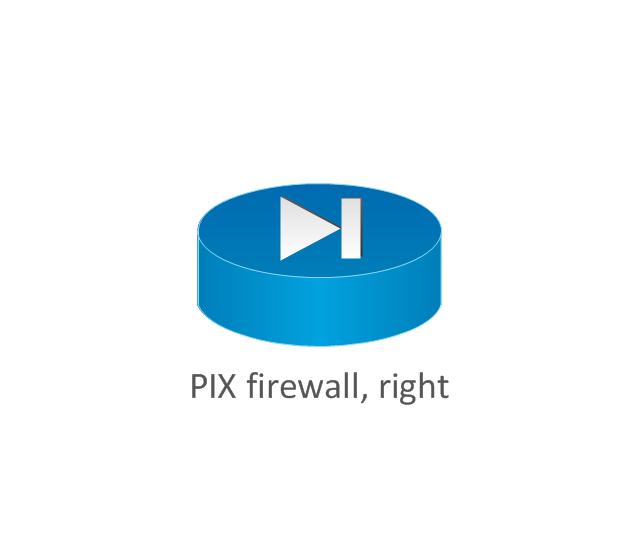
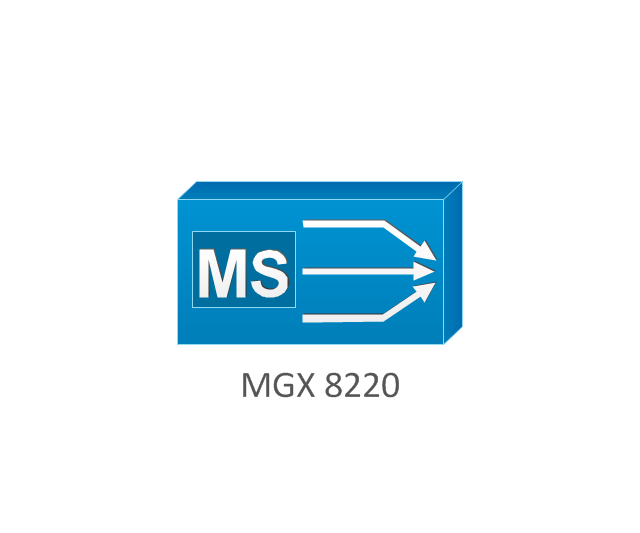
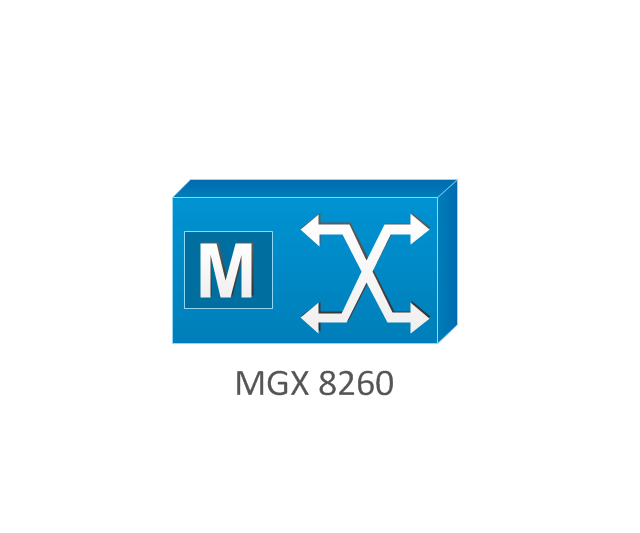
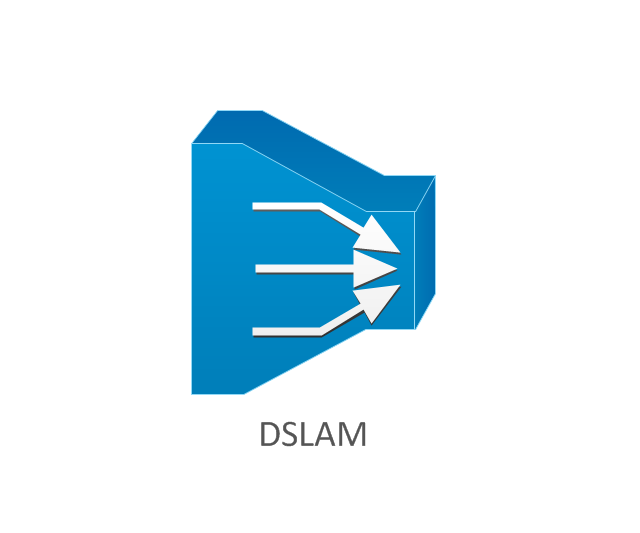
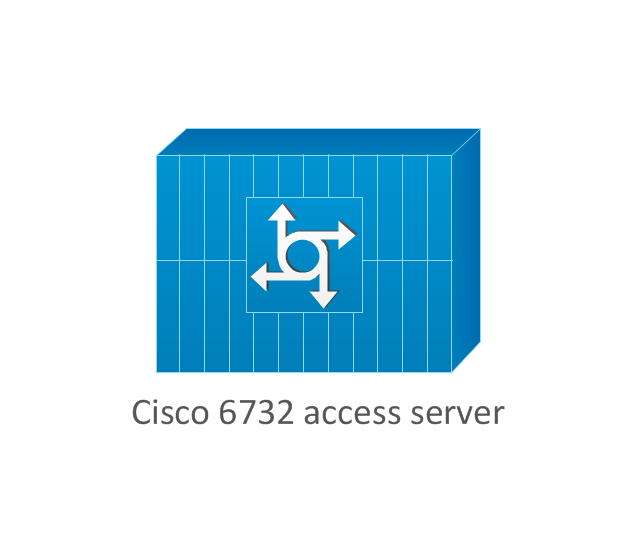
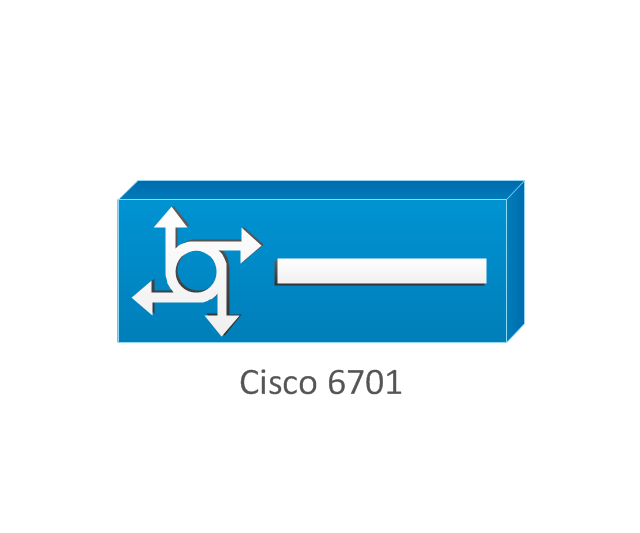
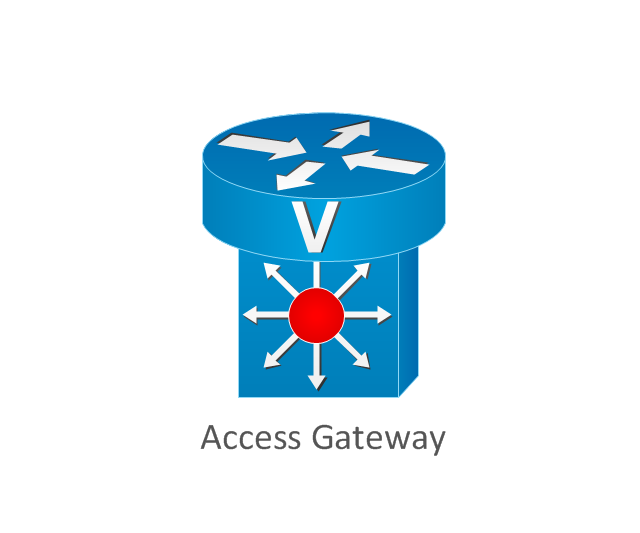
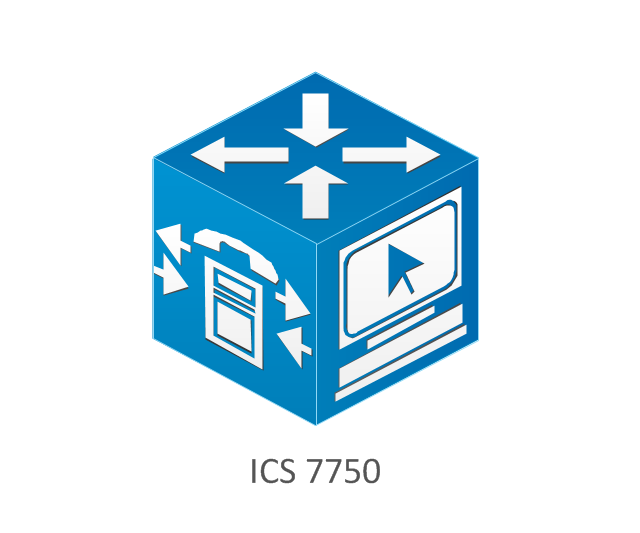
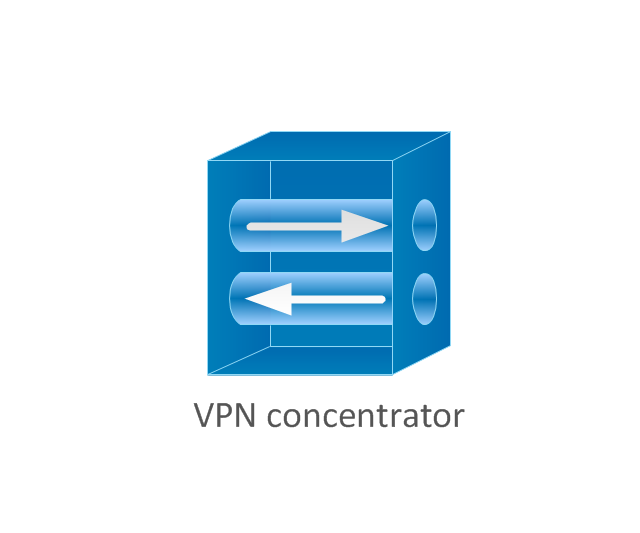
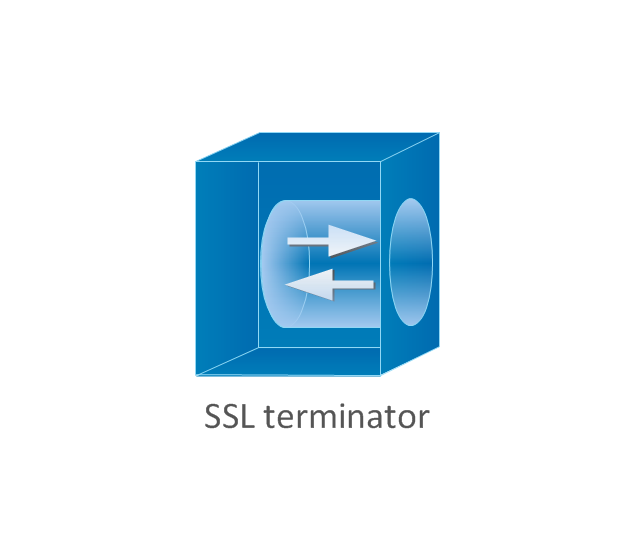
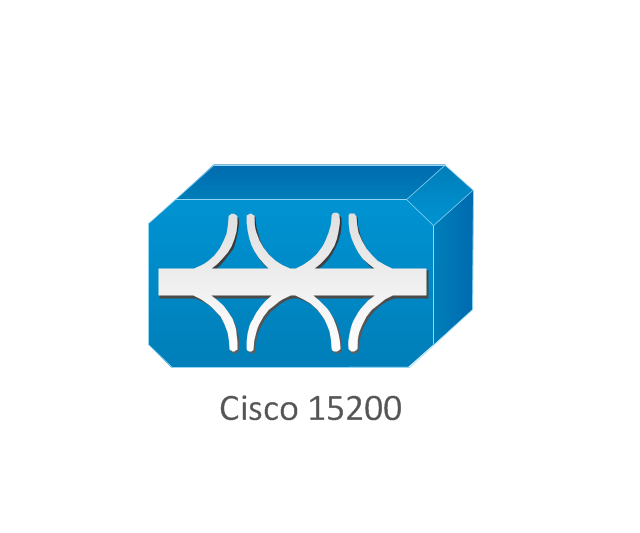
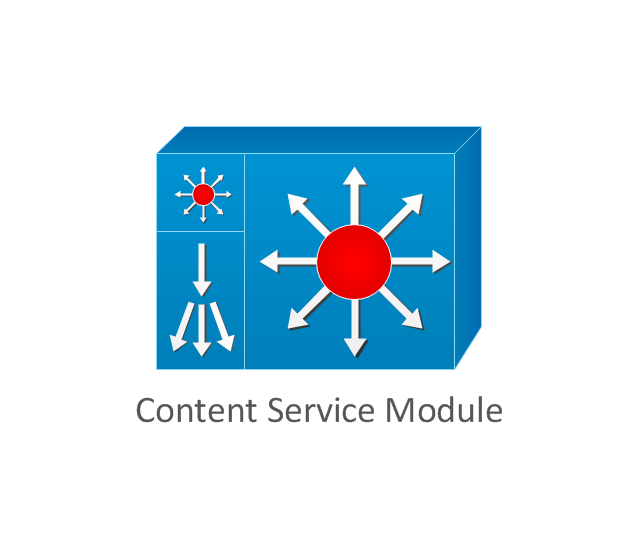
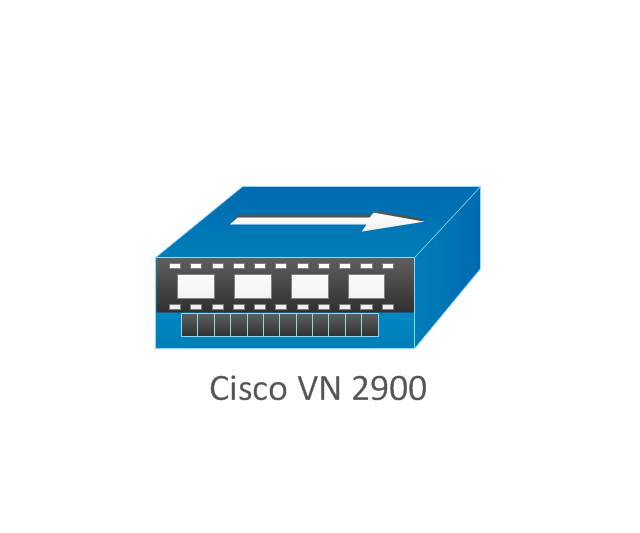
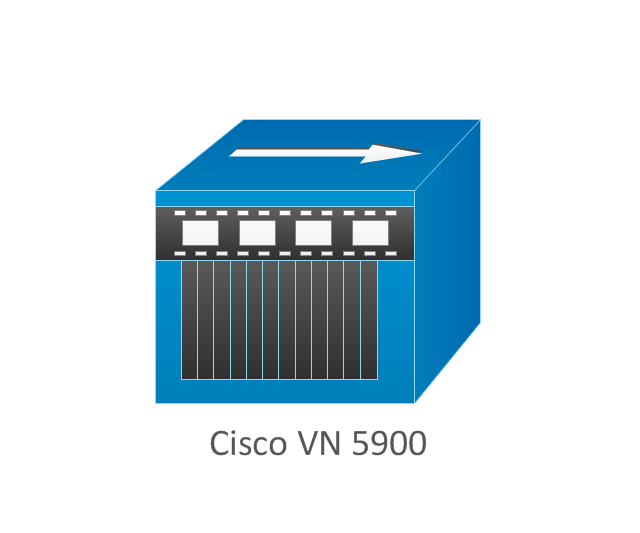
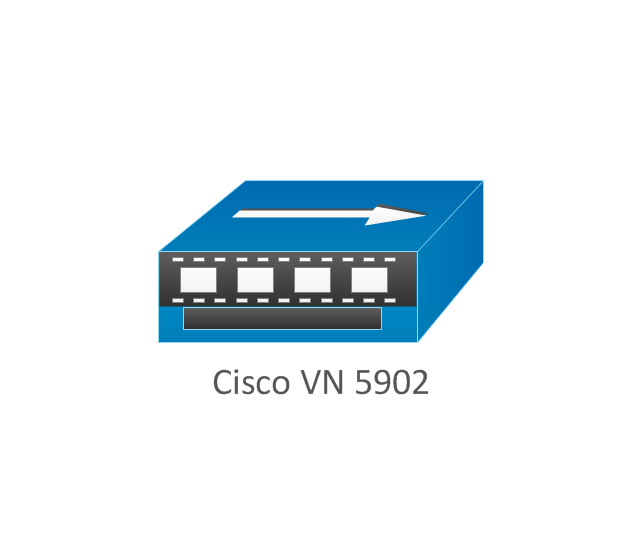
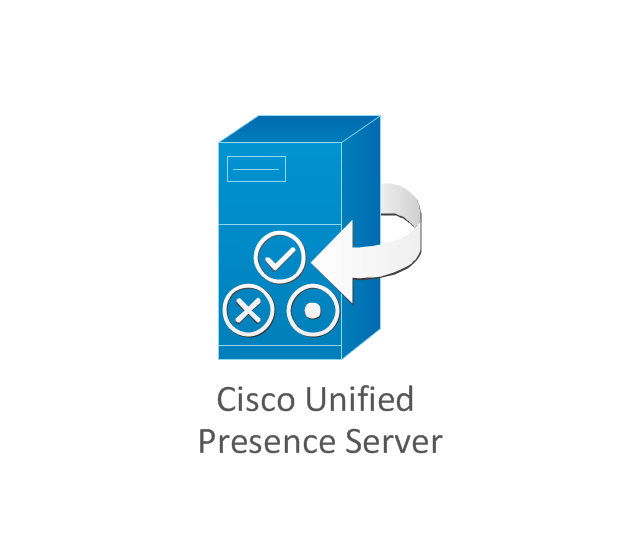
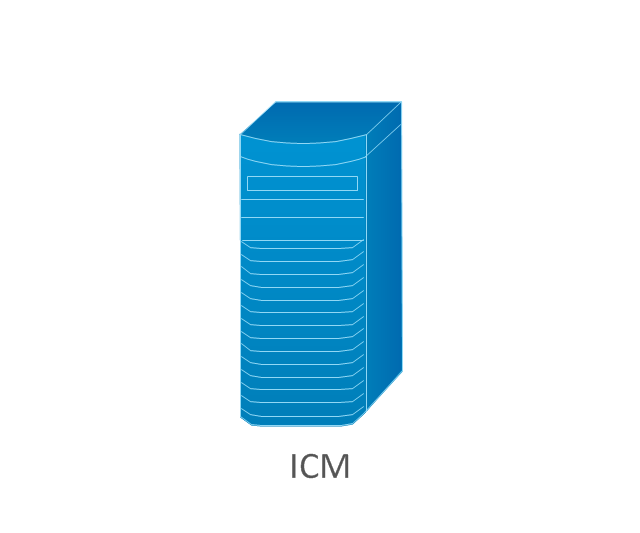
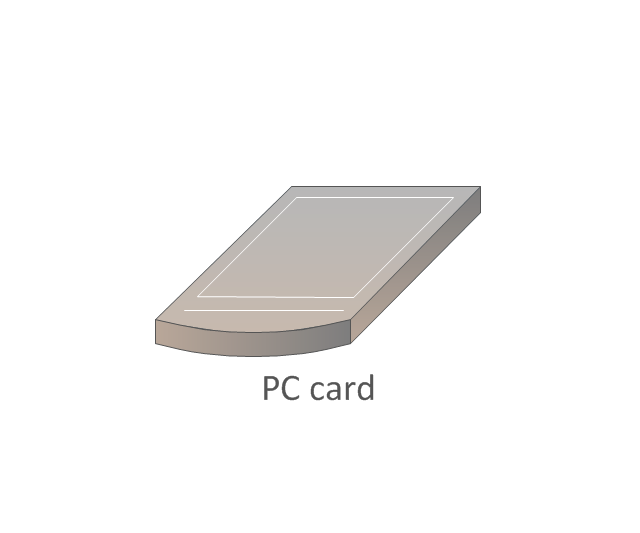
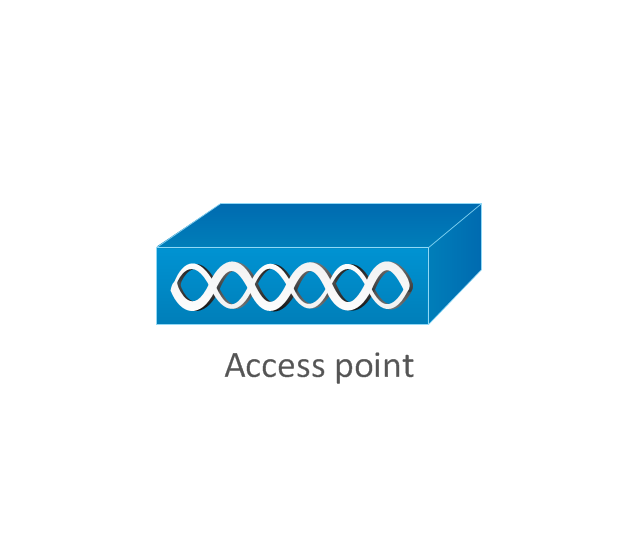
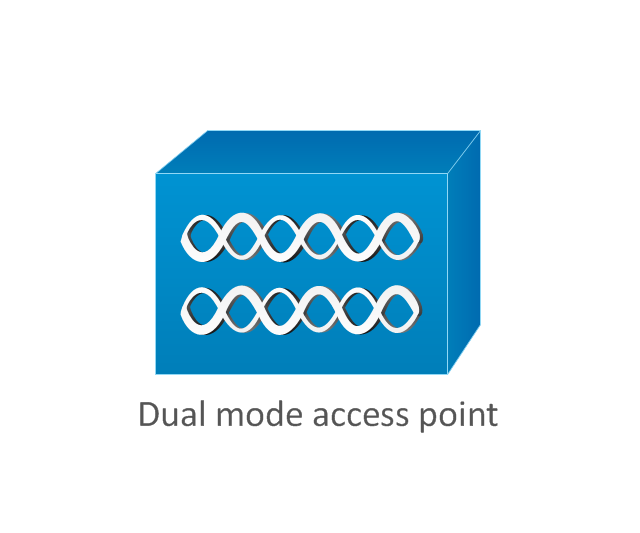
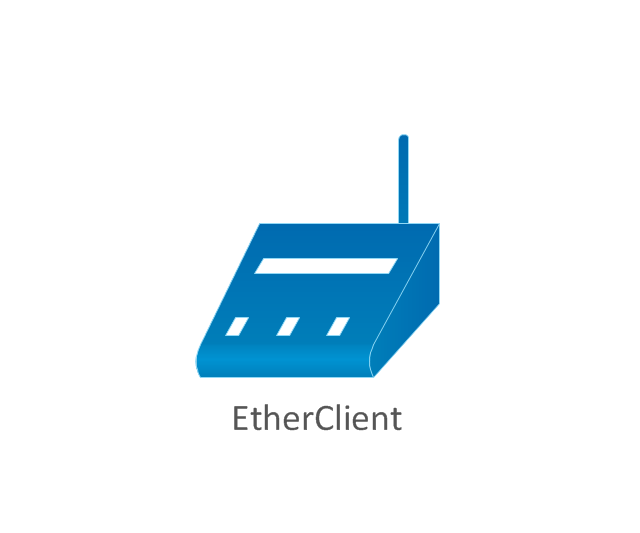
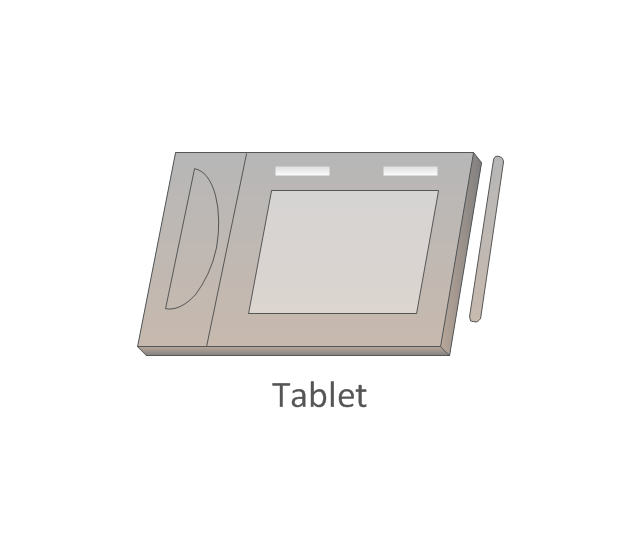
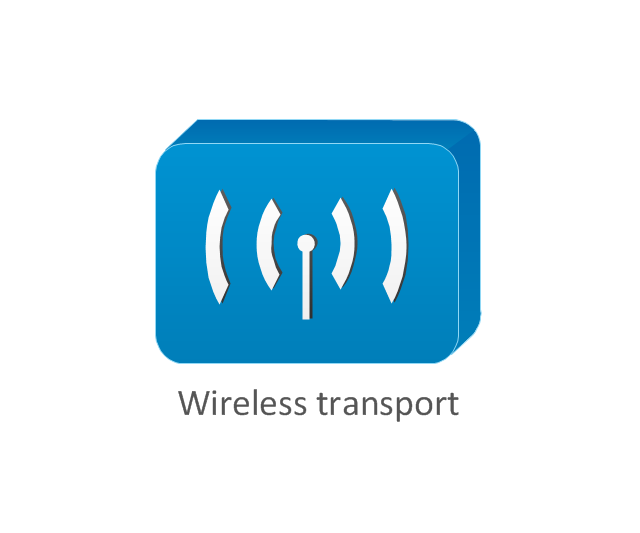
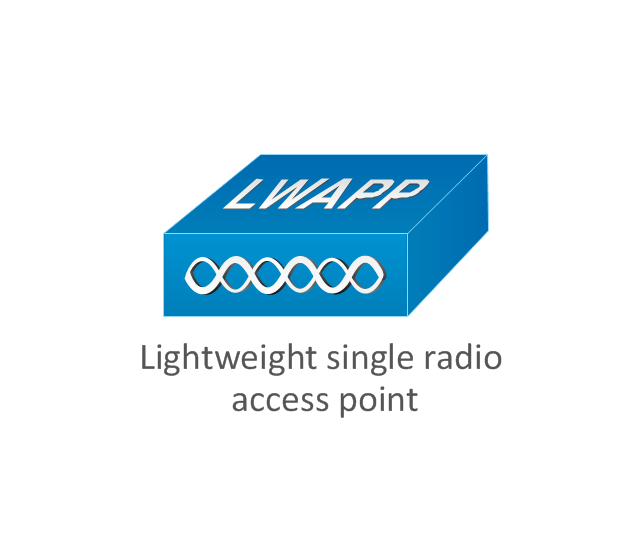
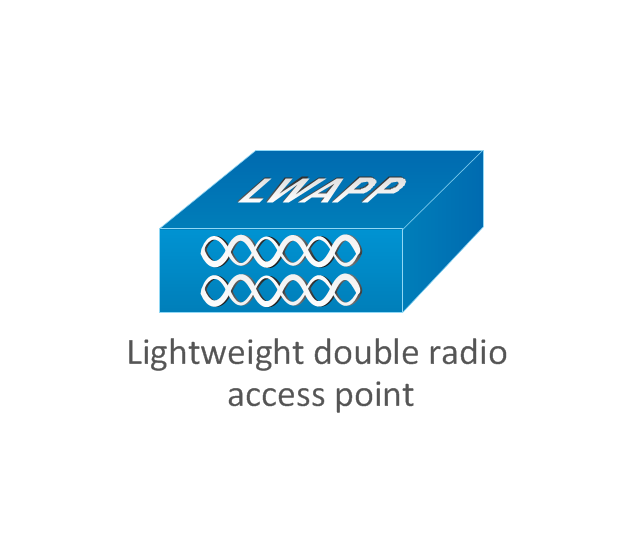
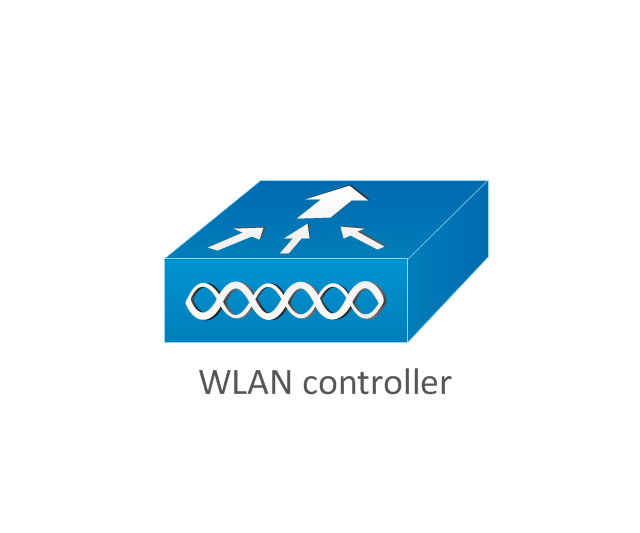
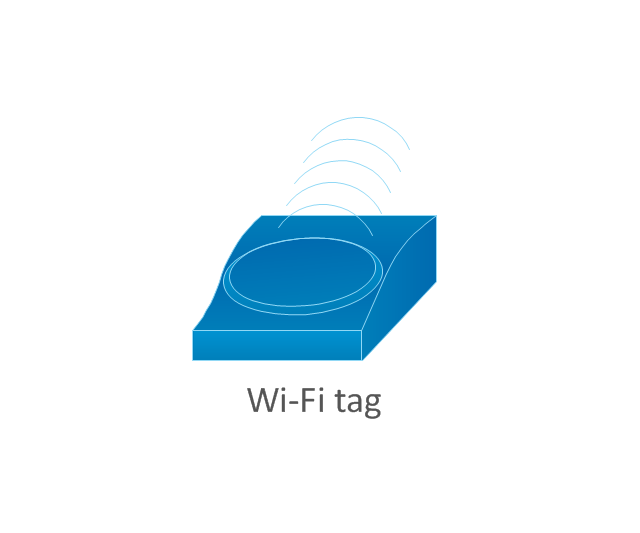
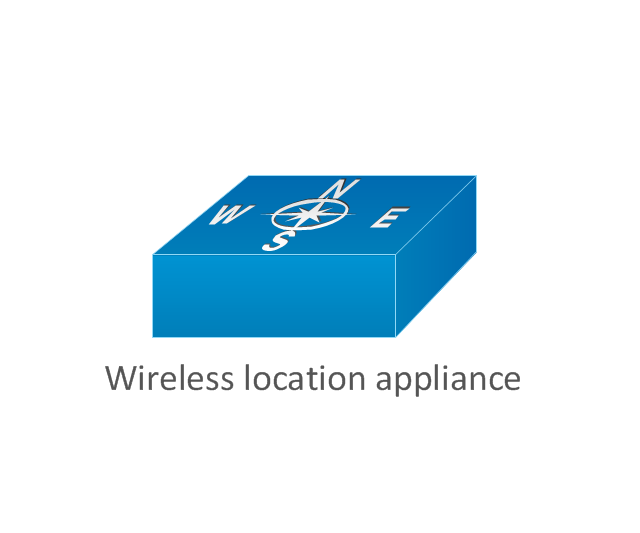
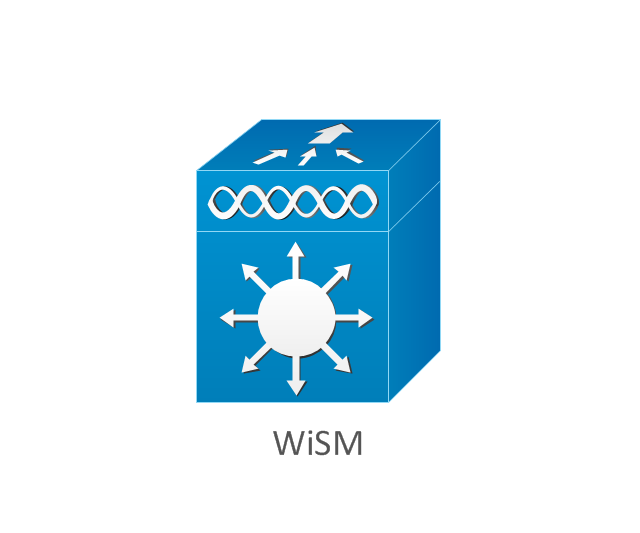
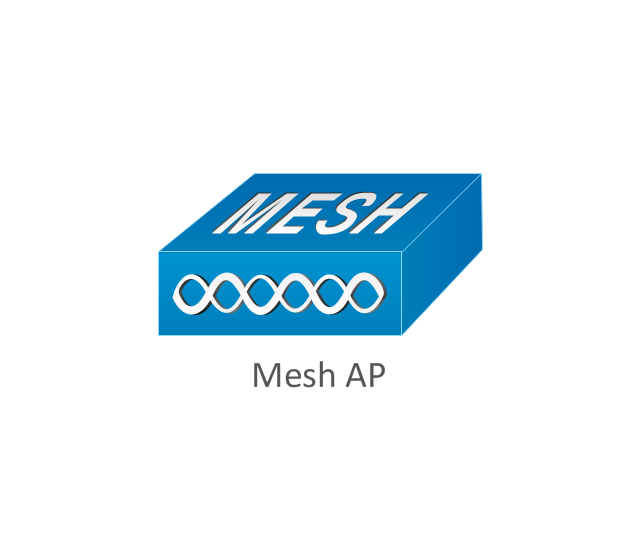
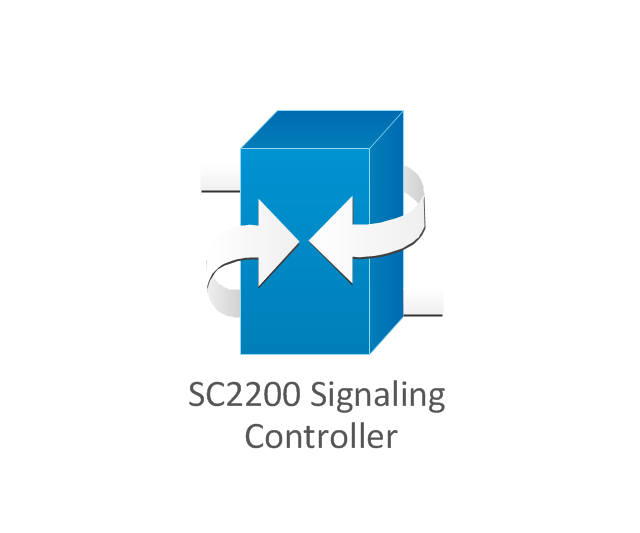
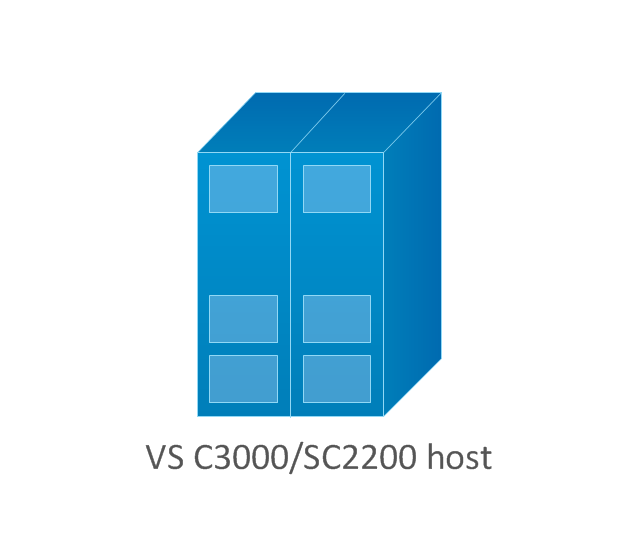
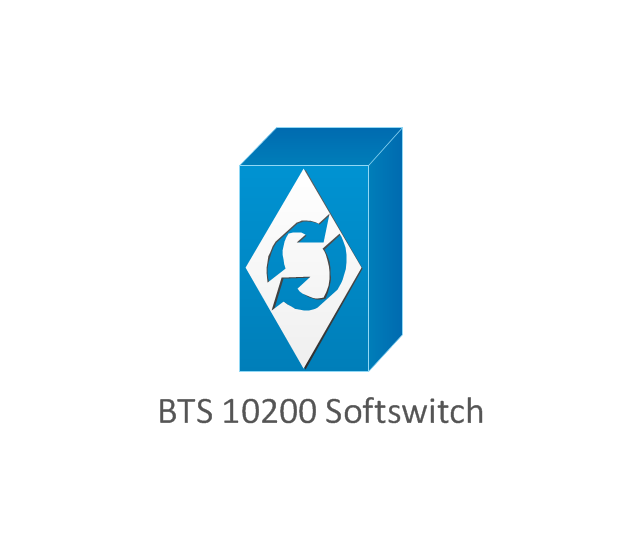
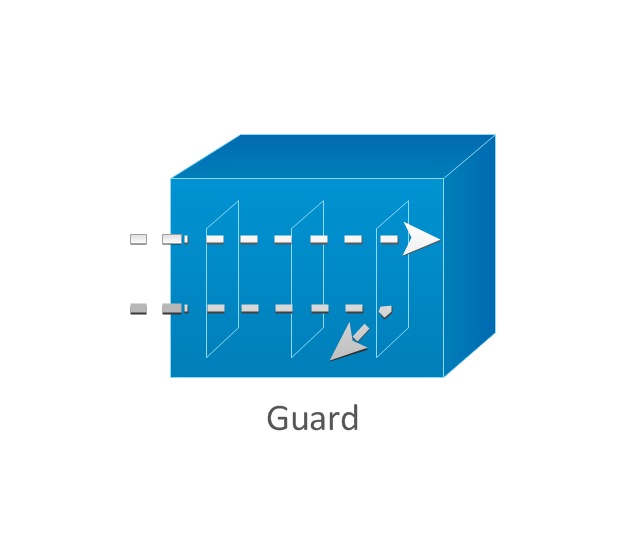
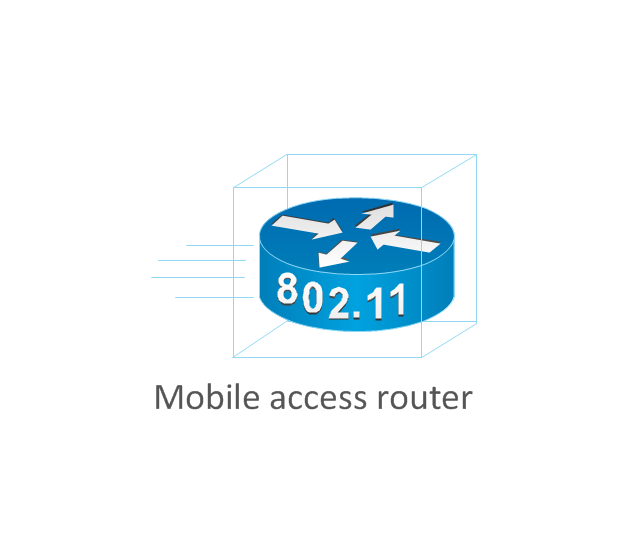
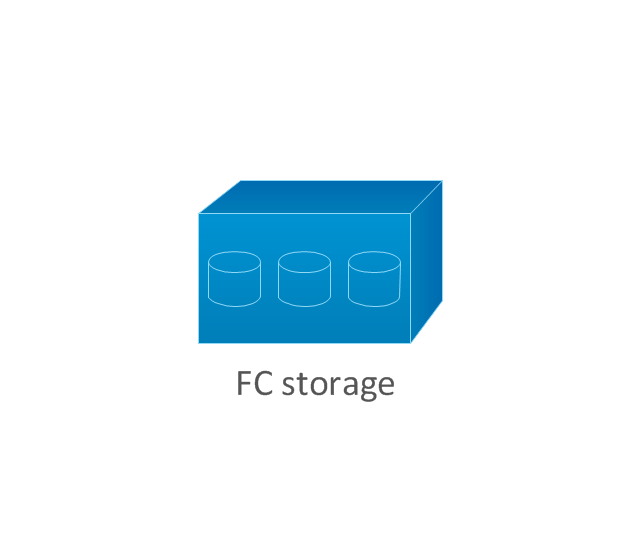
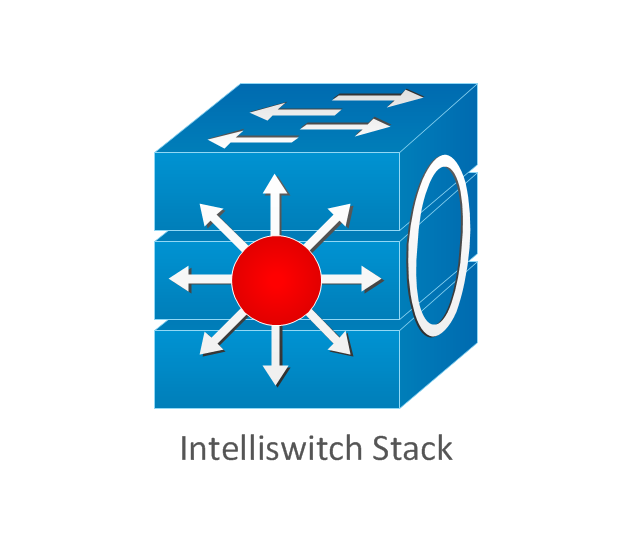
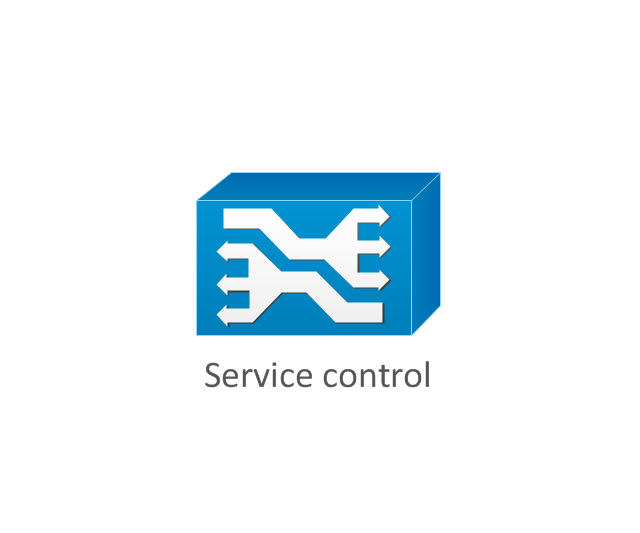
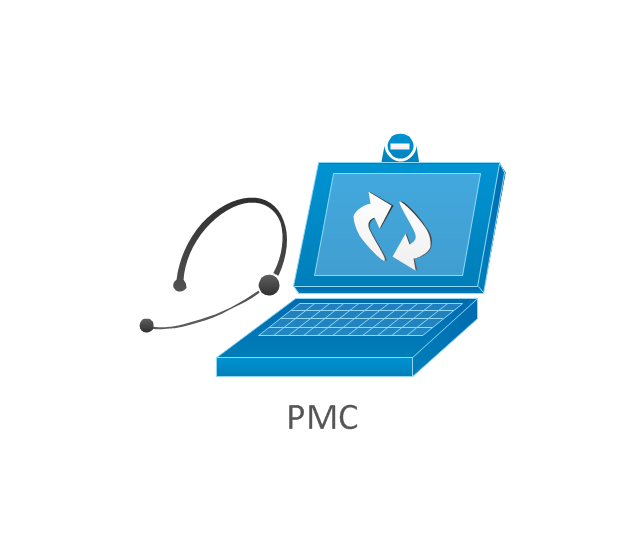
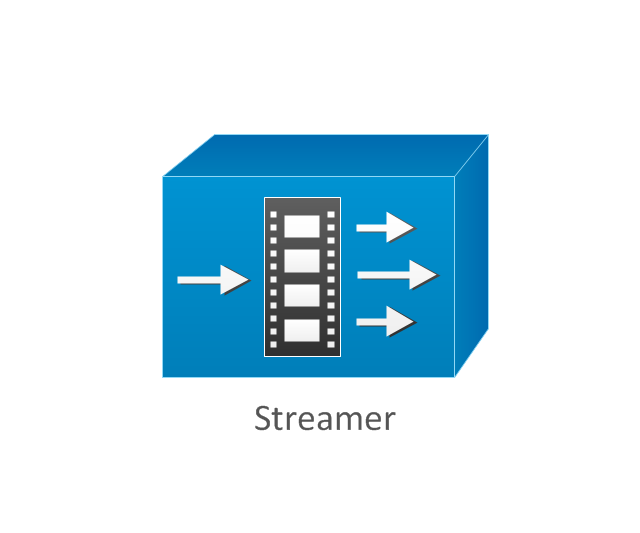
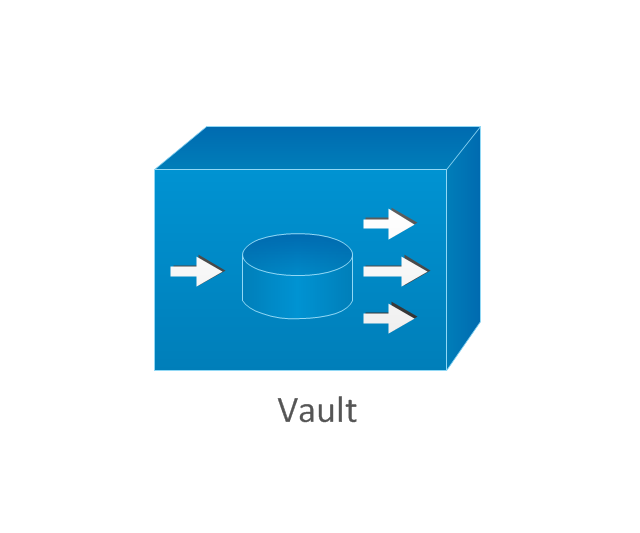
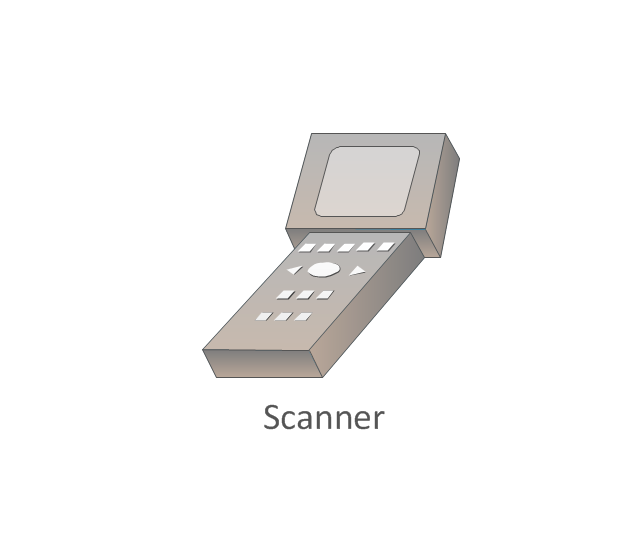
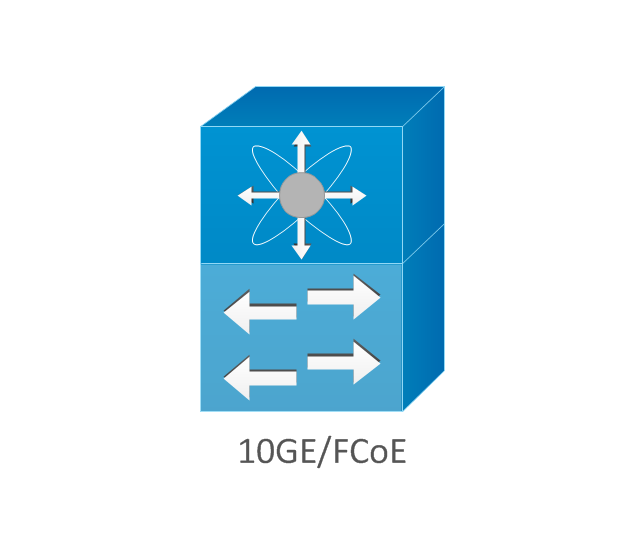
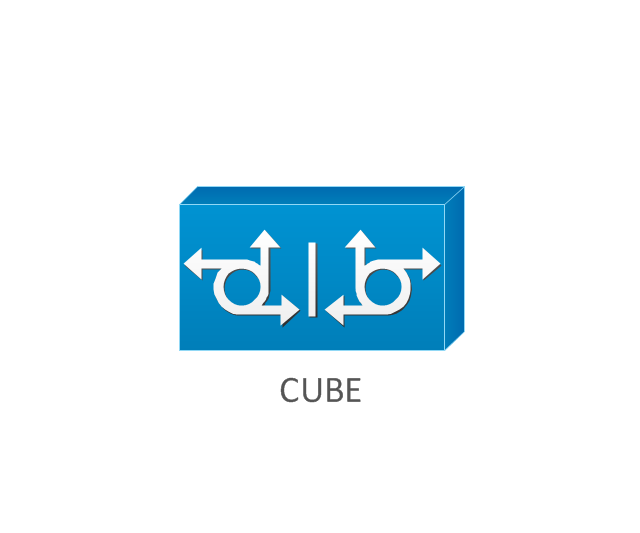
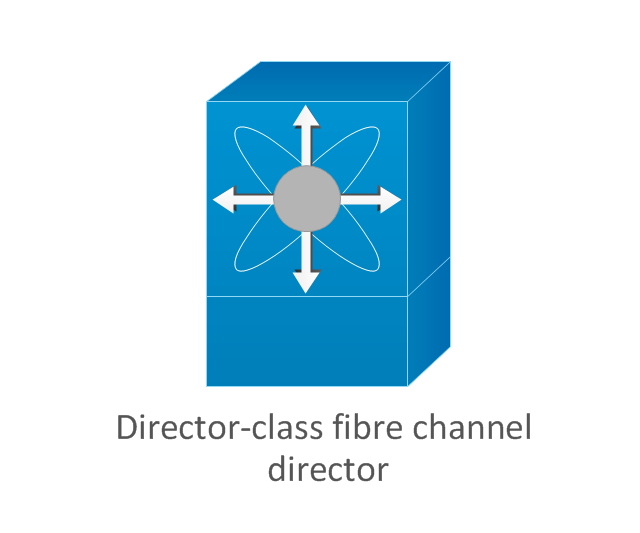
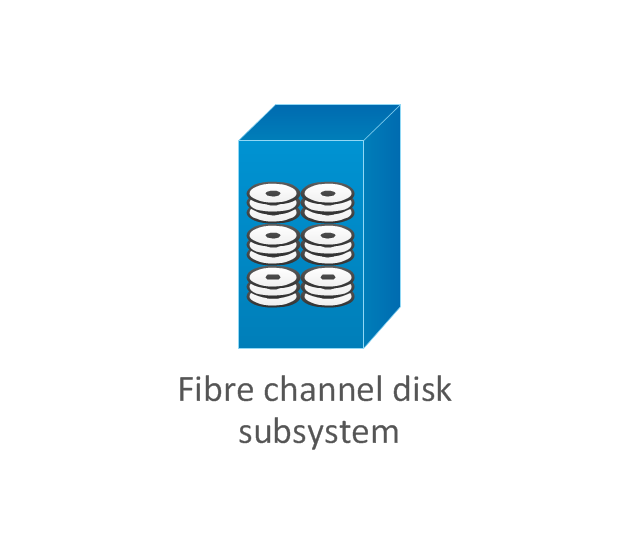
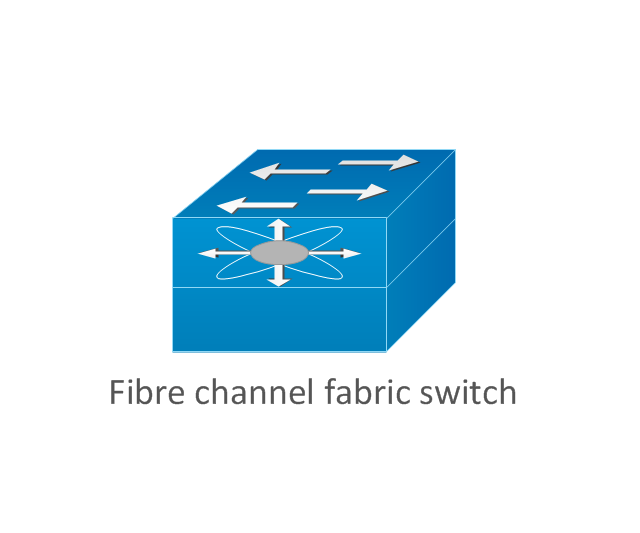
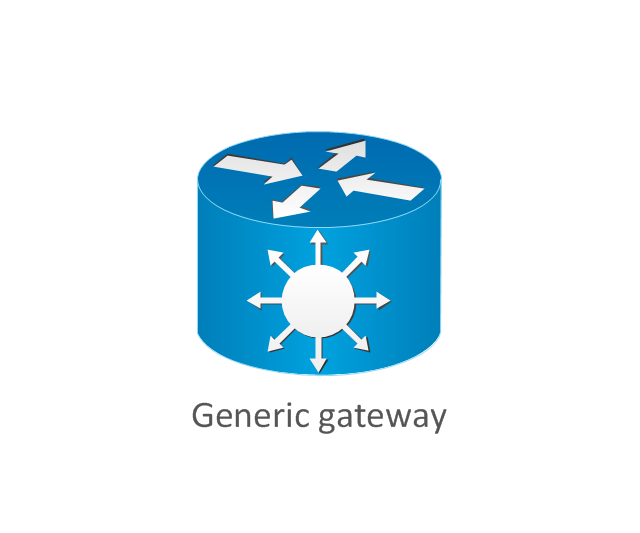
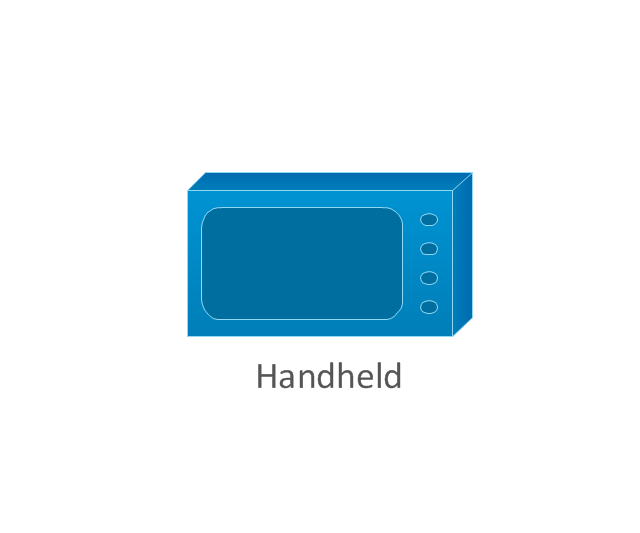
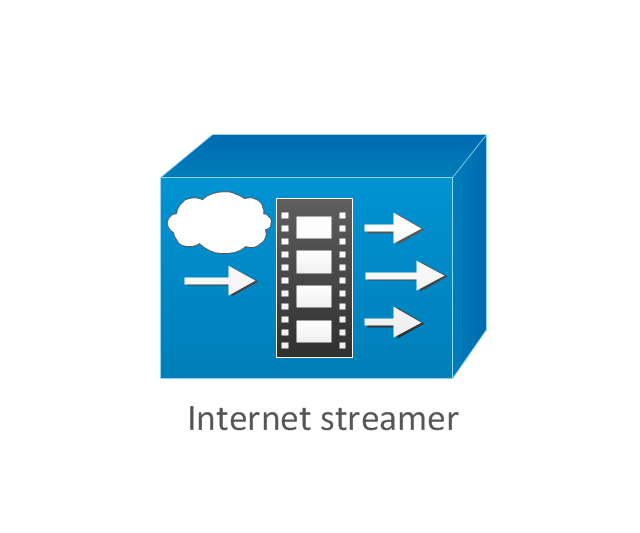
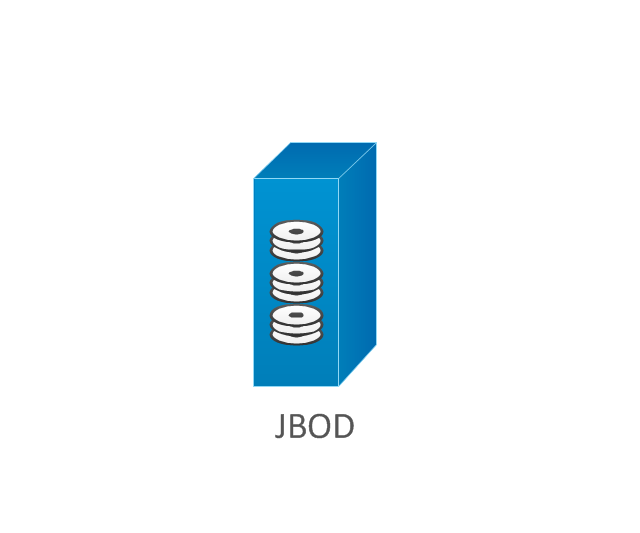
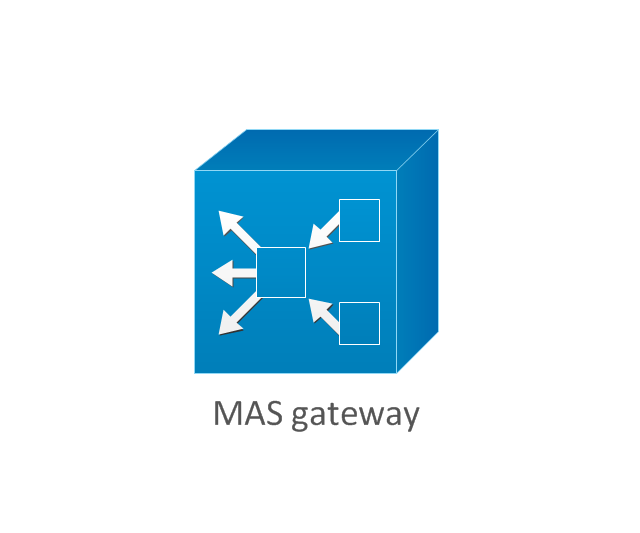
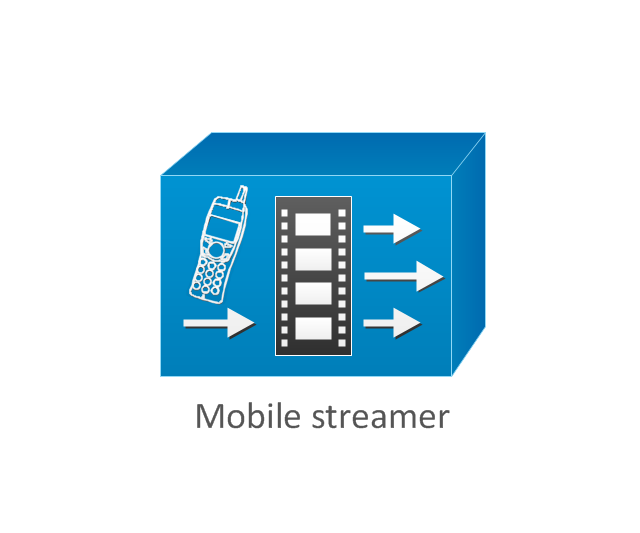
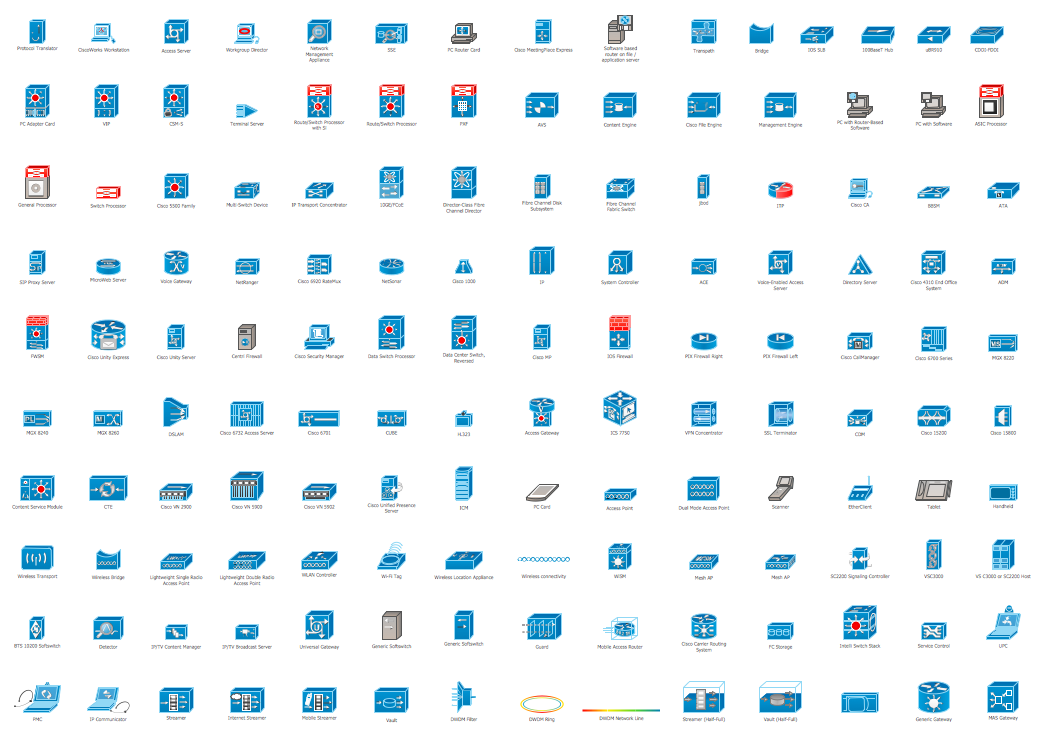
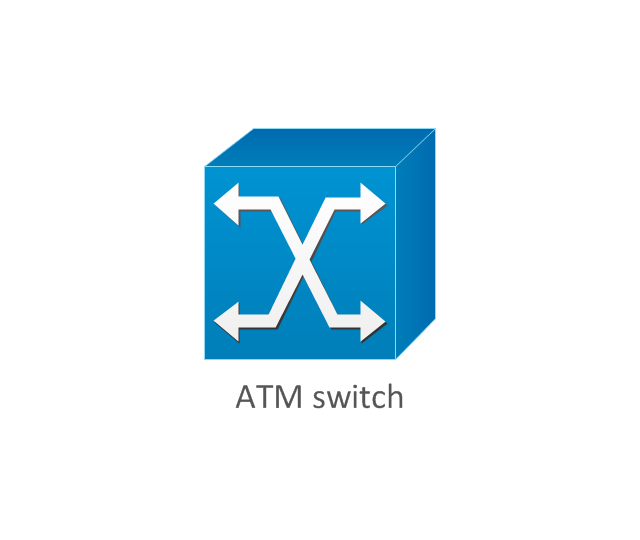
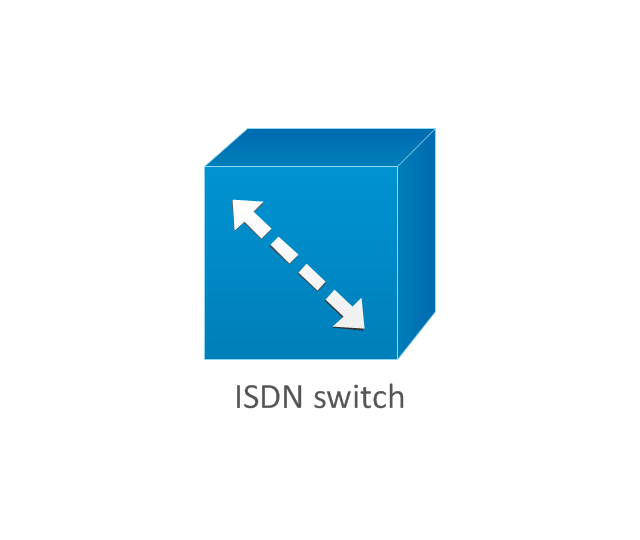
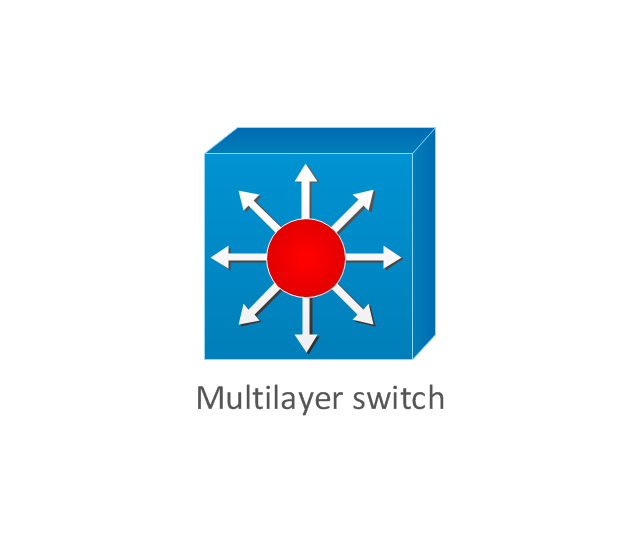
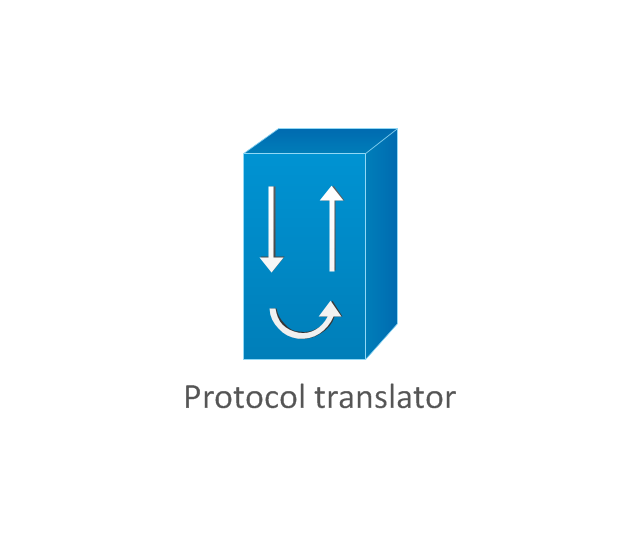
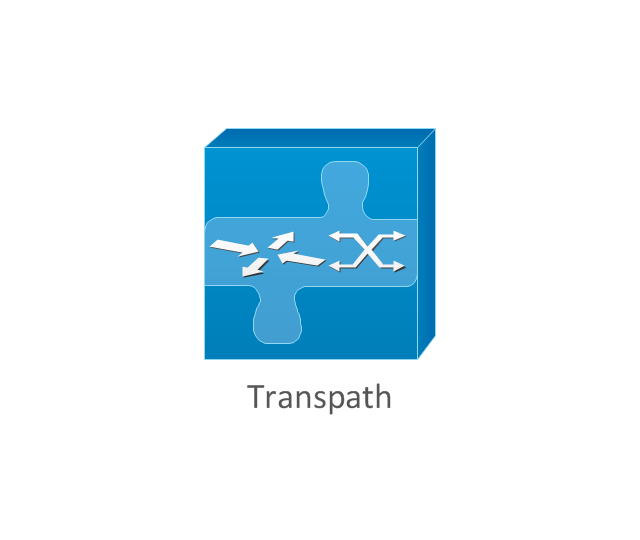
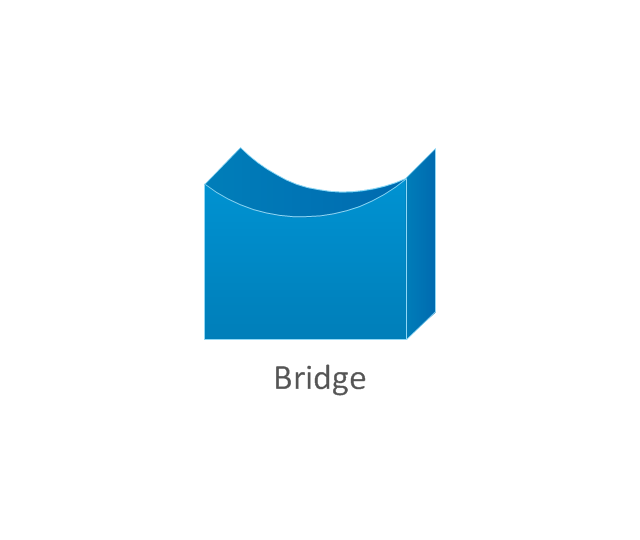
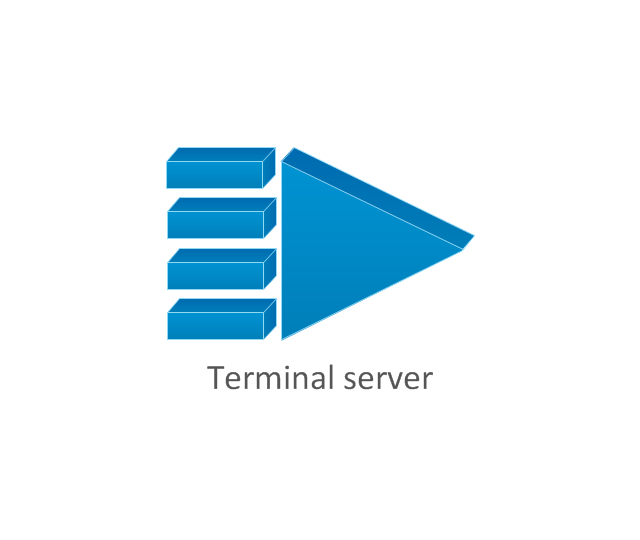
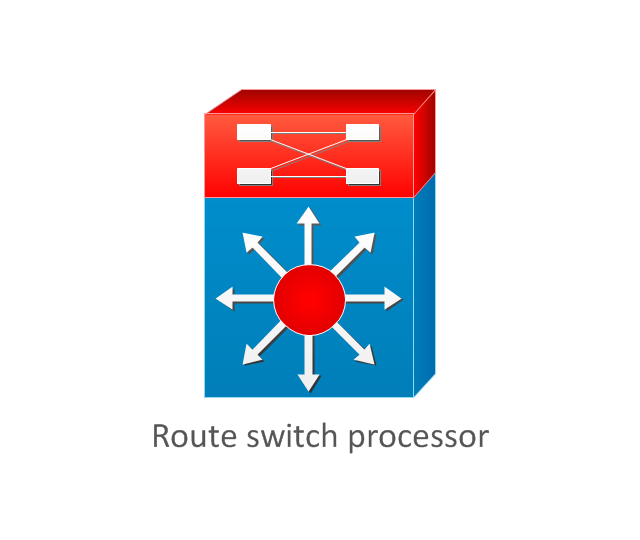
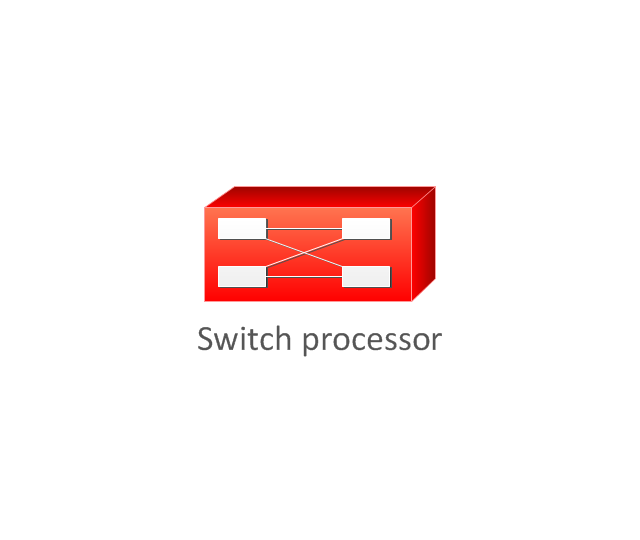
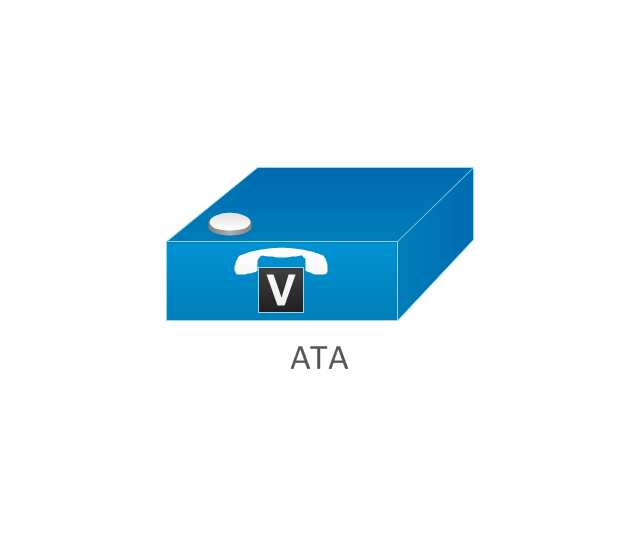
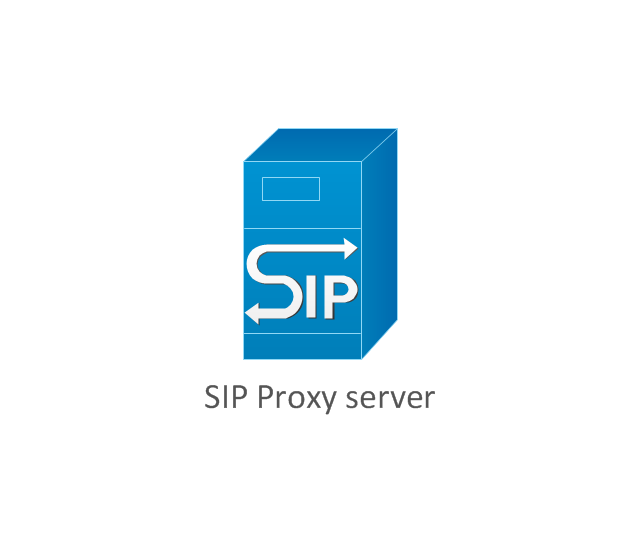
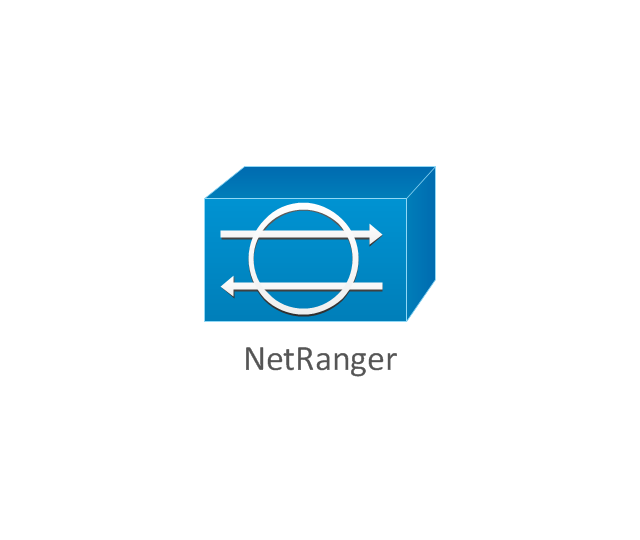
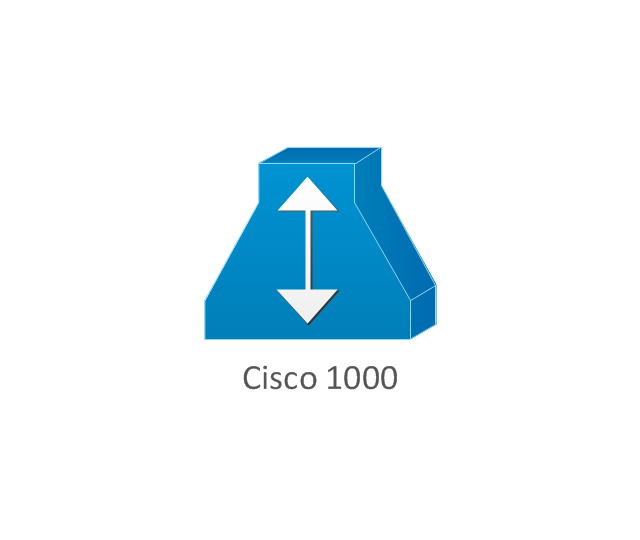
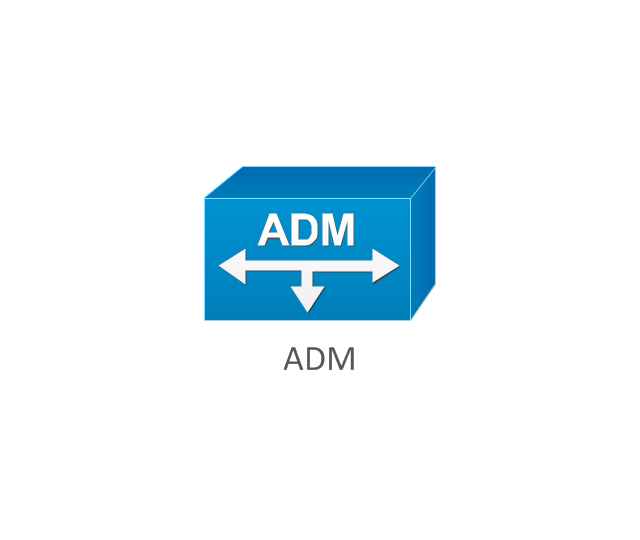
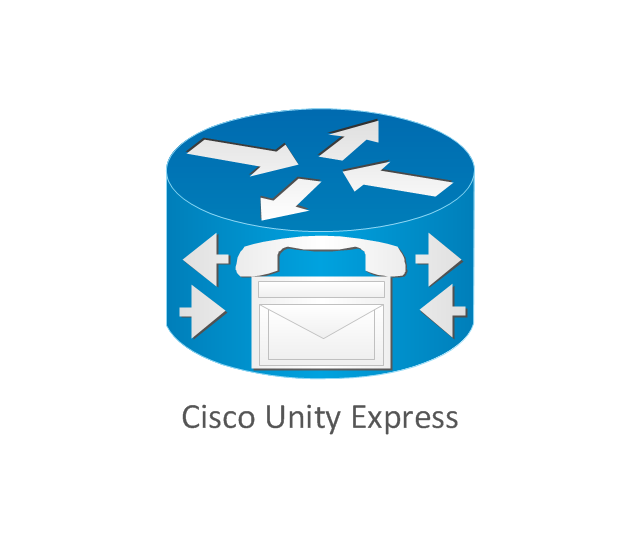
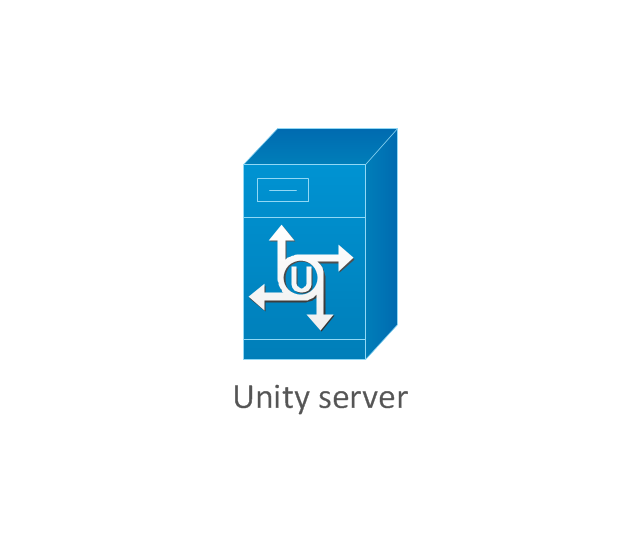
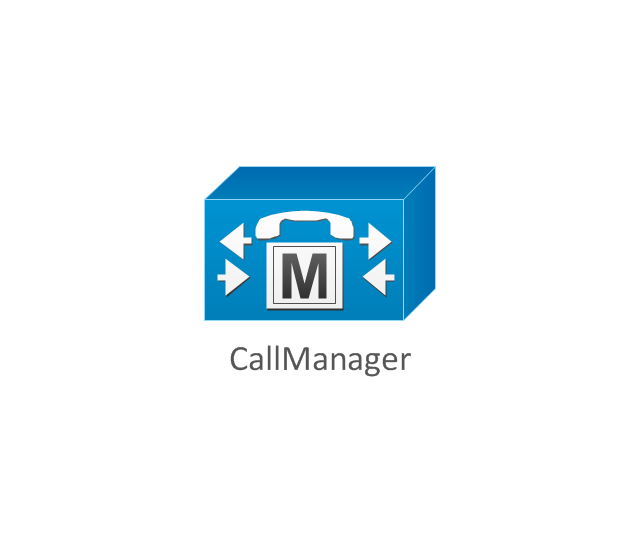
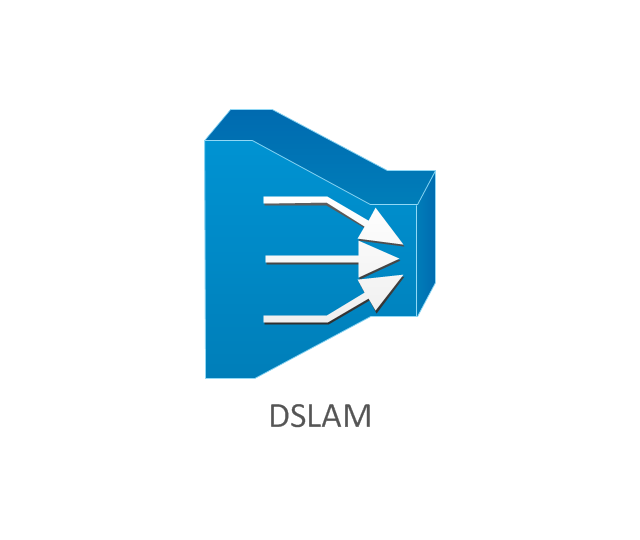
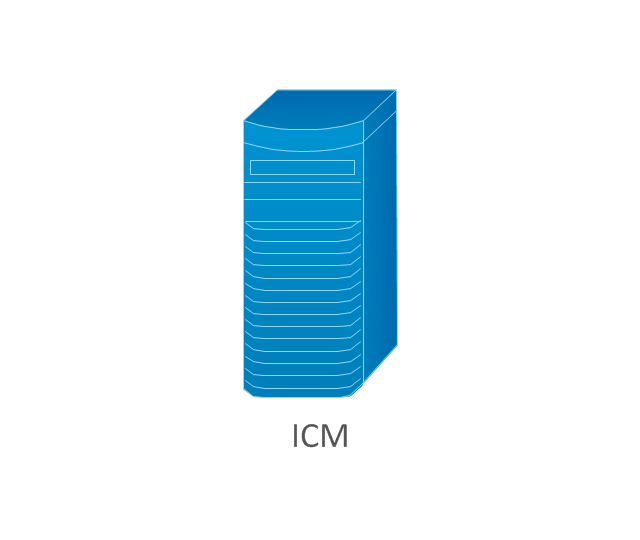
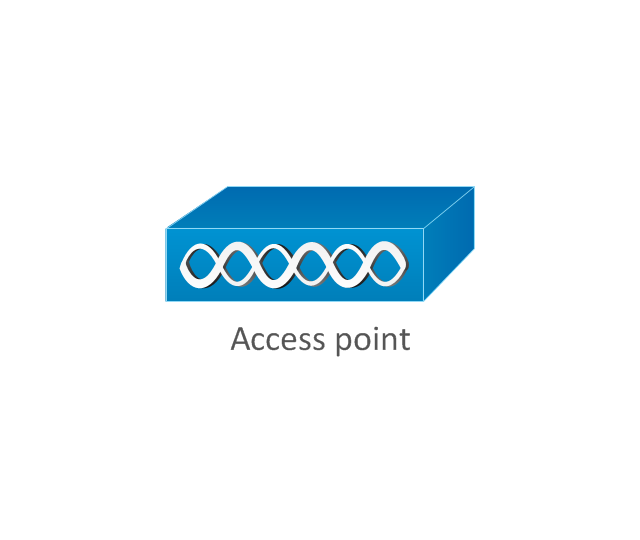
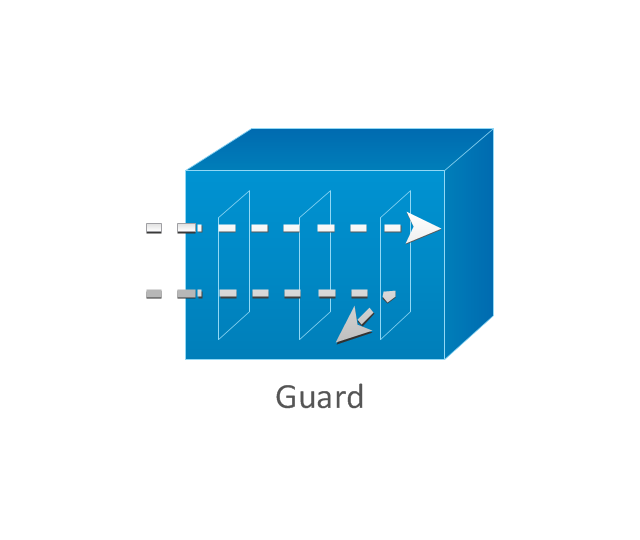
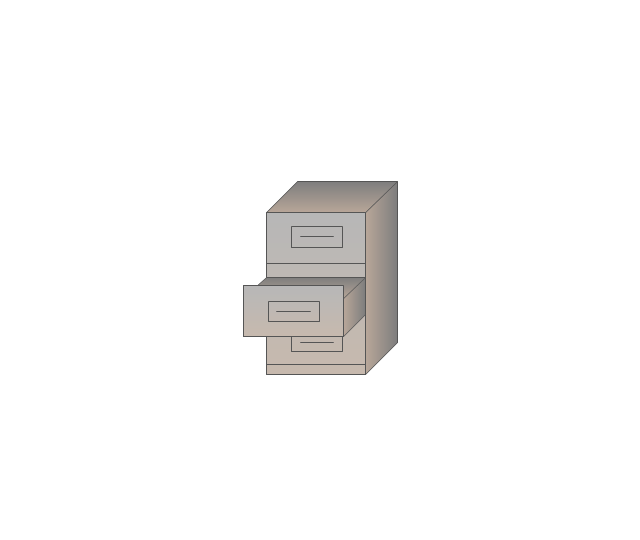
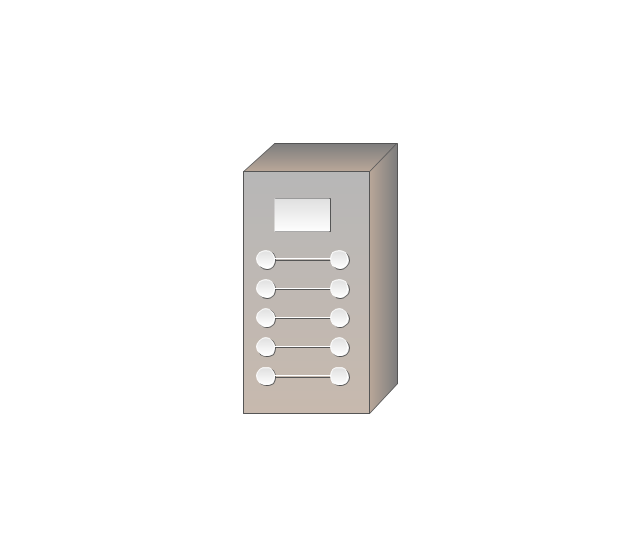
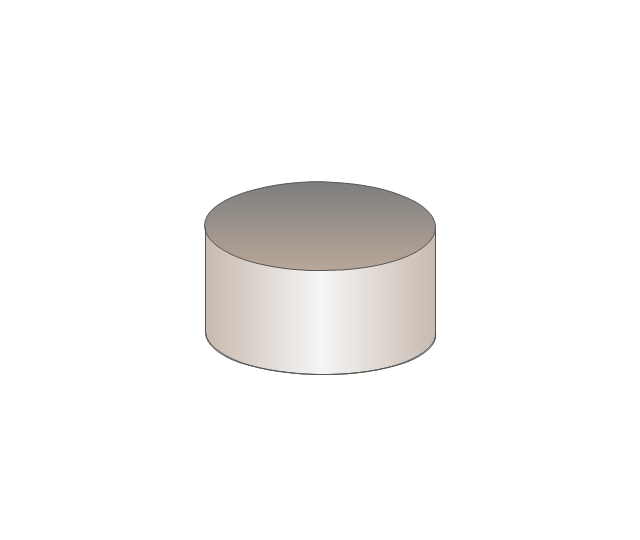
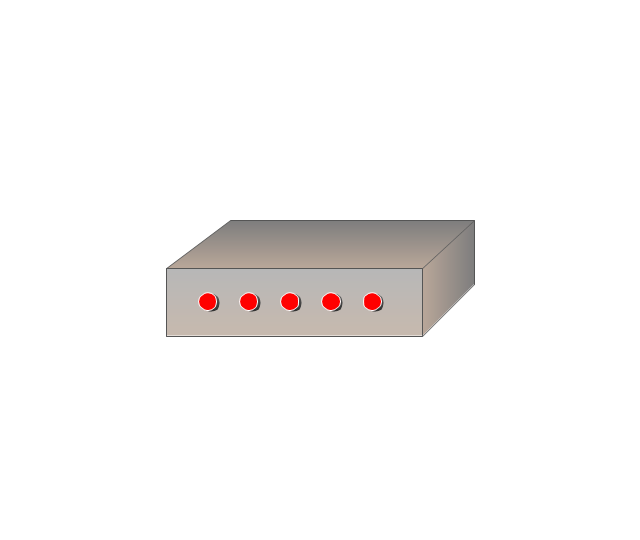
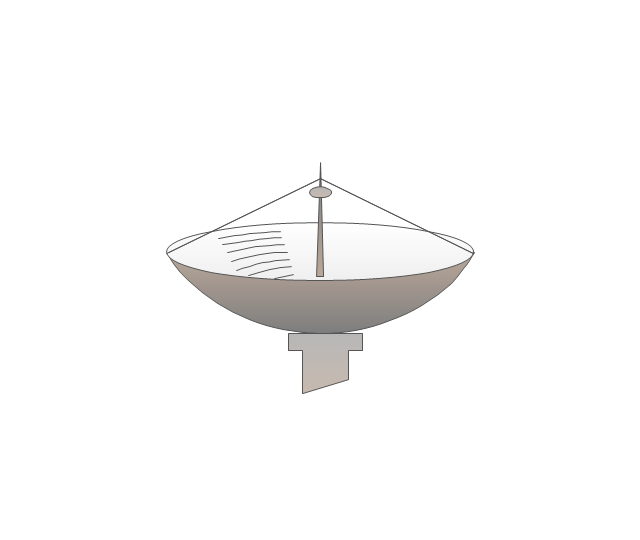
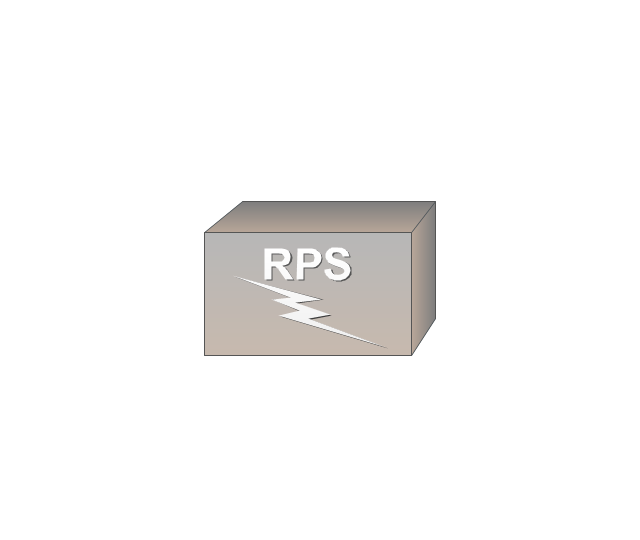
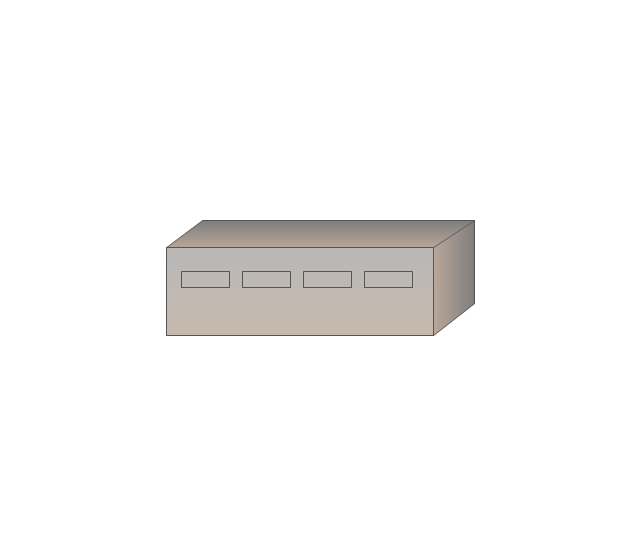
The vector stencils library "Cisco products additional" contains 141 symbols of computer network devices and equipment for drawing Cisco network diagrams.
The symbols example "Cisco products additional - Vector stencils library" was created using the ConceptDraw PRO diagramming and vector drawing software extended with the Cisco Network Diagrams solution from the Computer and Networks area of ConceptDraw Solution Park.
www.conceptdraw.com/ solution-park/ computer-networks-cisco
Cisco Products Additional. Cisco icons, shapes, stencils and symbols
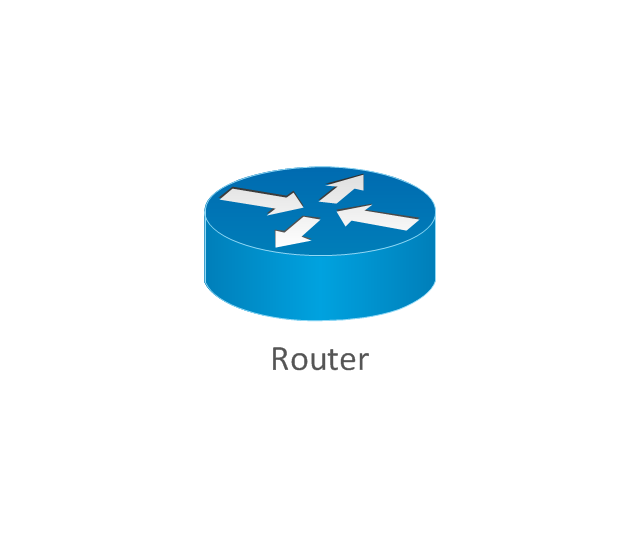
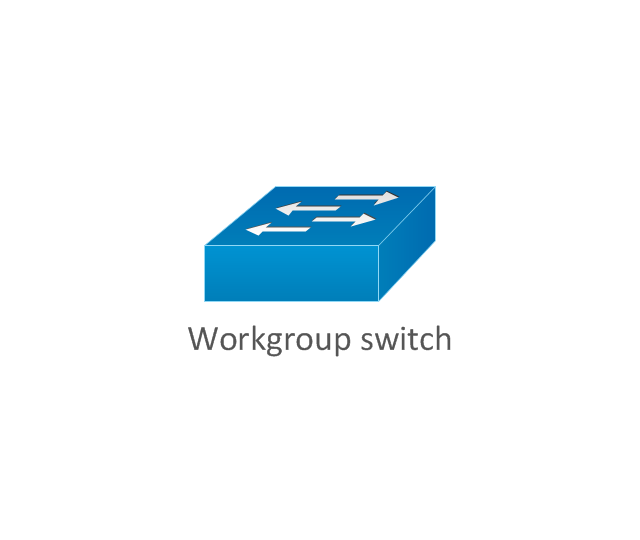
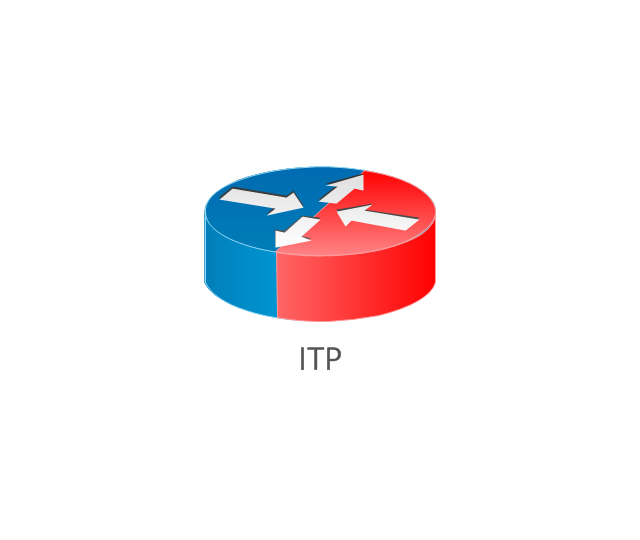
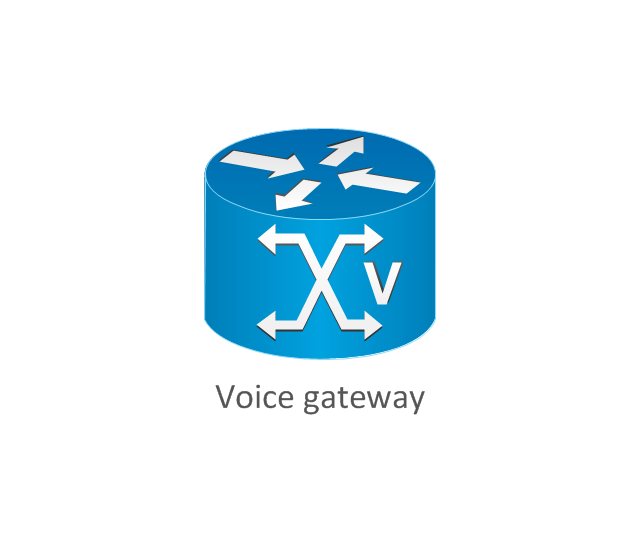
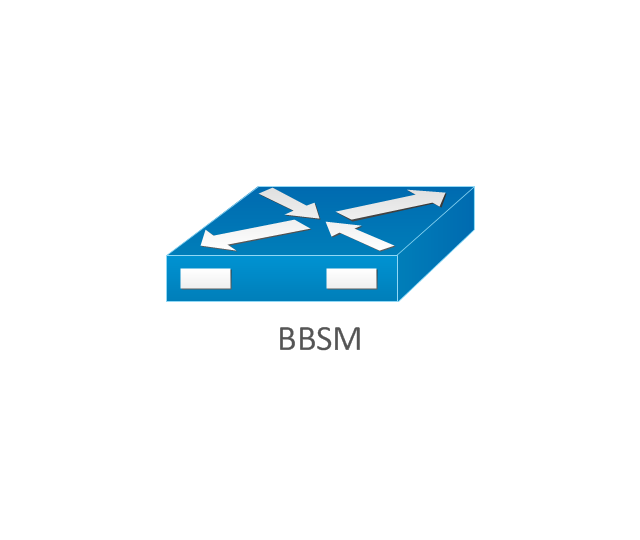
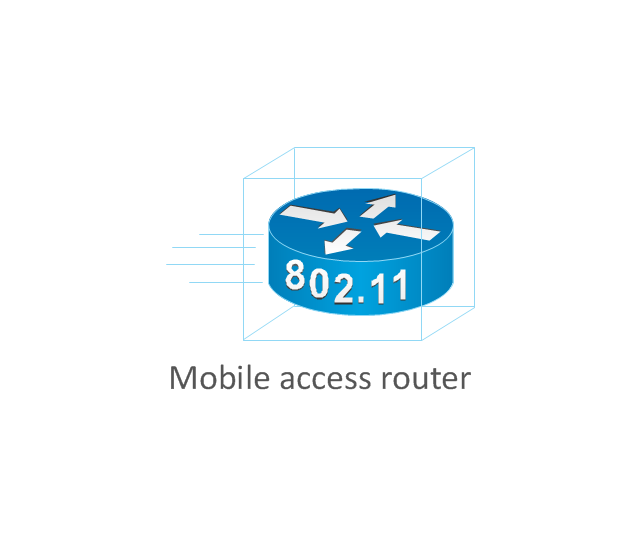
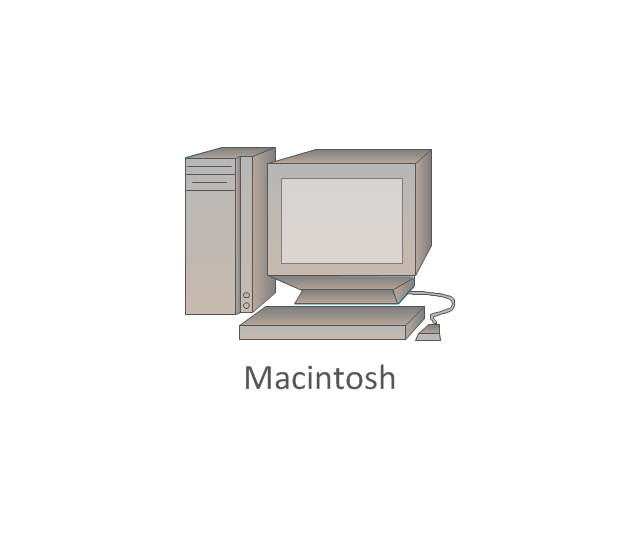
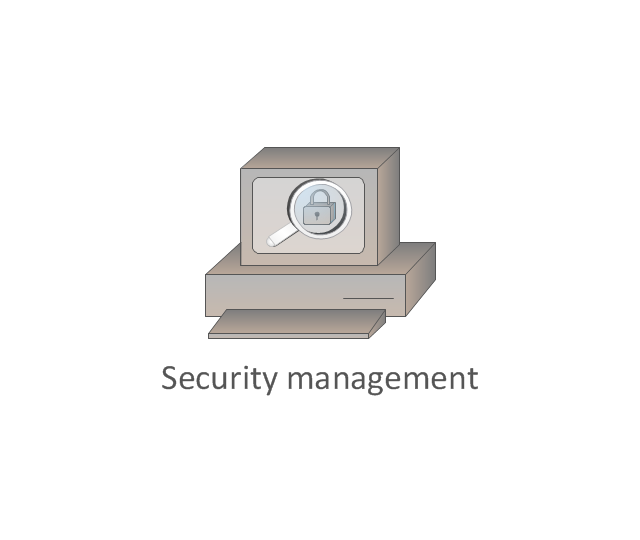
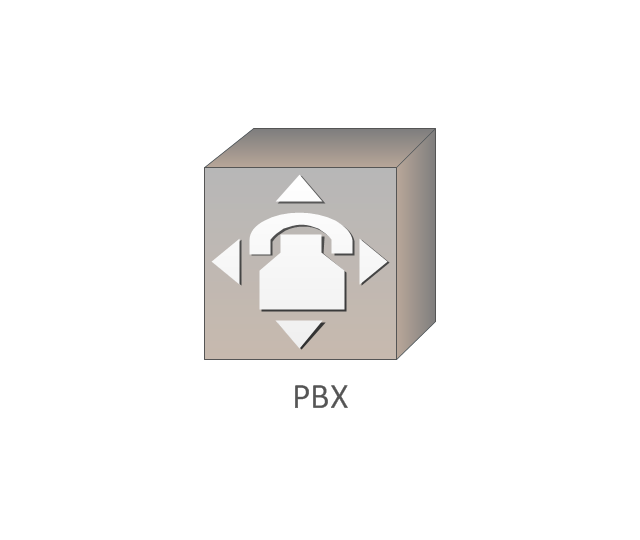
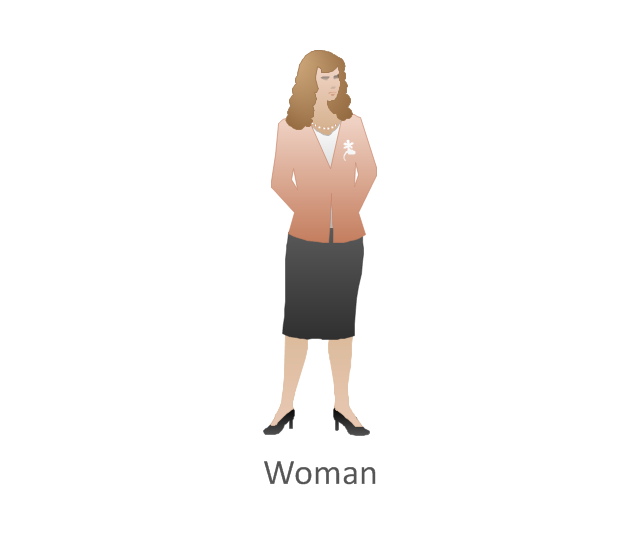
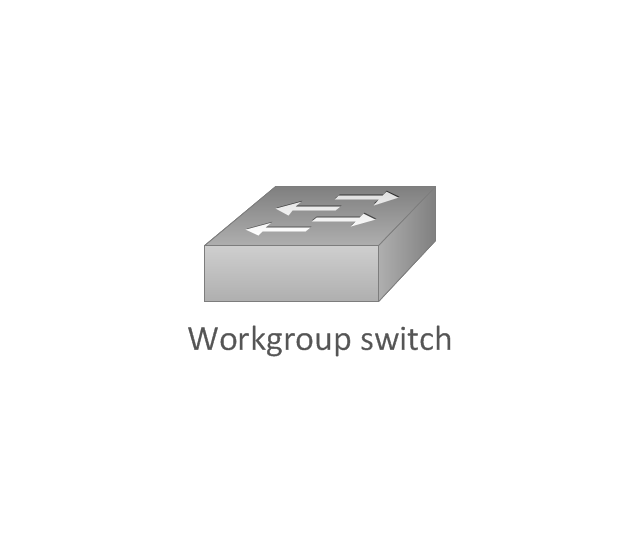
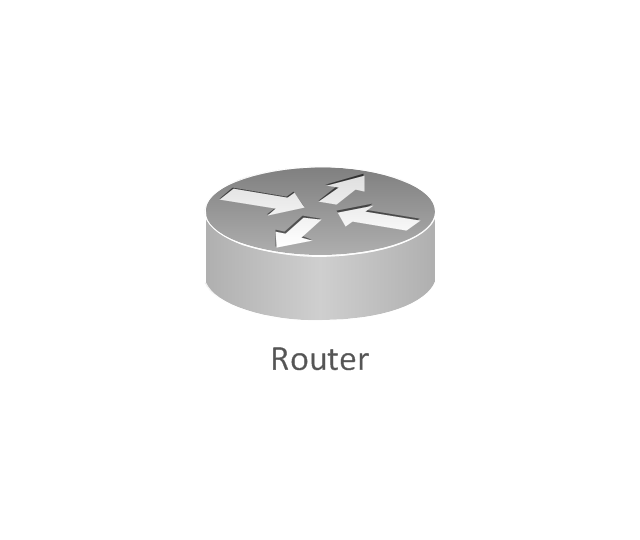
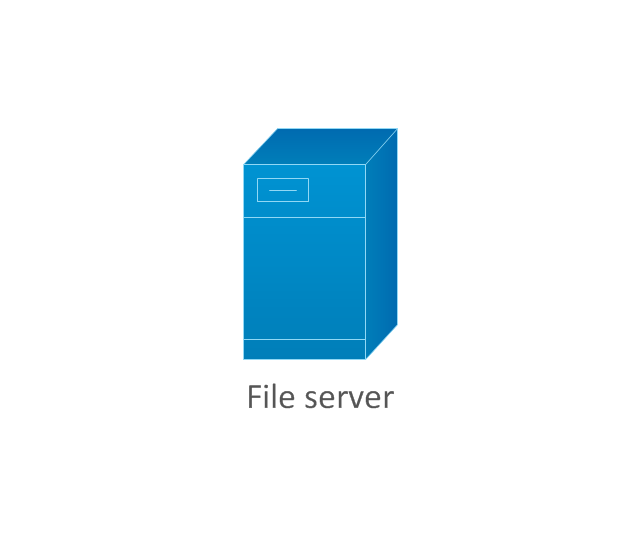
The ConceptDraw vector stencils library Cisco Products Additional contains equipment symbols for drawing the computer network diagrams.The vector stencils library "Cisco network topology" contains 89 symbols of Cisco network devices and design elements for drawing computer network topology diagrams.
"There are two basic categories of network topologies:
(1) Physical topologies,
(2) Logical topologies.
The shape of the cabling layout used to link devices is called the physical topology of the network. This refers to the layout of cabling, the locations of nodes, and the interconnections between the nodes and the cabling. The physical topology of a network is determined by the capabilities of the network access devices and media, the level of control or fault tolerance desired, and the cost associated with cabling or telecommunications circuits.
The logical topology in contrast, is the way that the signals act on the network media, or the way that the data passes through the network from one device to the next without regard to the physical interconnection of the devices." [Network topology. Wikipedia]
The symbols example "Cisco network topology - Vector stencils library" was created using the ConceptDraw PRO diagramming and vector drawing software extended with the Cisco Network Diagrams solution from the Computer and Networks area of ConceptDraw Solution Park.
www.conceptdraw.com/ solution-park/ computer-networks-cisco
Cross Functional Flowchart for Business Process Mapping
Start your business process mapping with conceptDraw PRO and its Arrows10 Technology. Creating a process map, also called a flowchart, is a major component of Six Sigma process management and improvement. Use Cross-Functional Flowchart drawing software for business process mapping (BPM). Use a variety of drawing tools, smart connectors and shape libraries to create flowcharts of complex processes, procedures and information exchange. Define and document basic work and data flows, financial, production and quality management processes to increase efficiency of you business.Basic Flowchart Examples
ConceptDraw PRO is a business flowchart software includes the wide flowchart examples package.Cross Functional Diagram
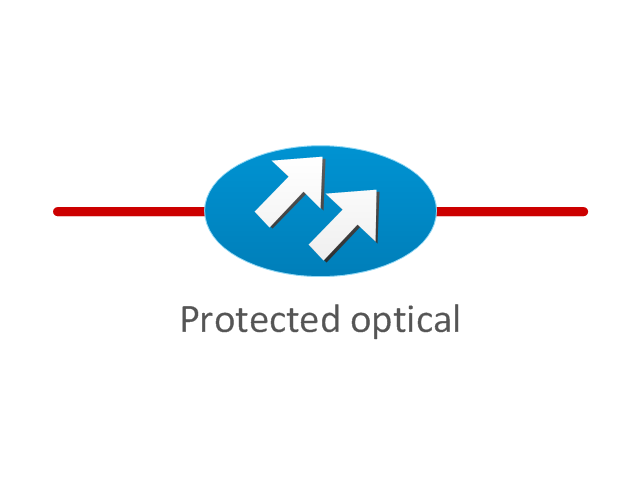
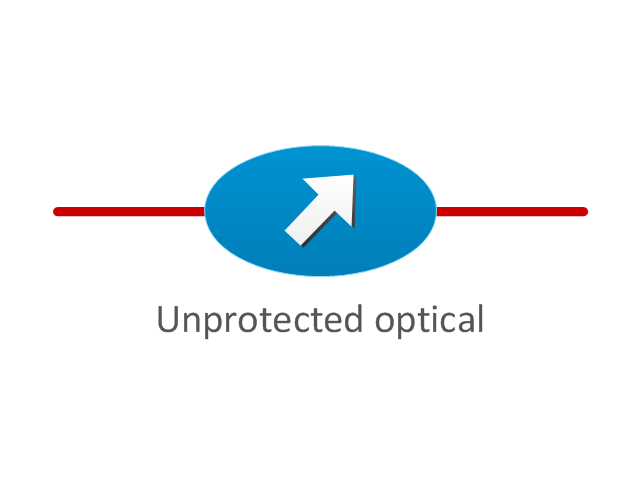
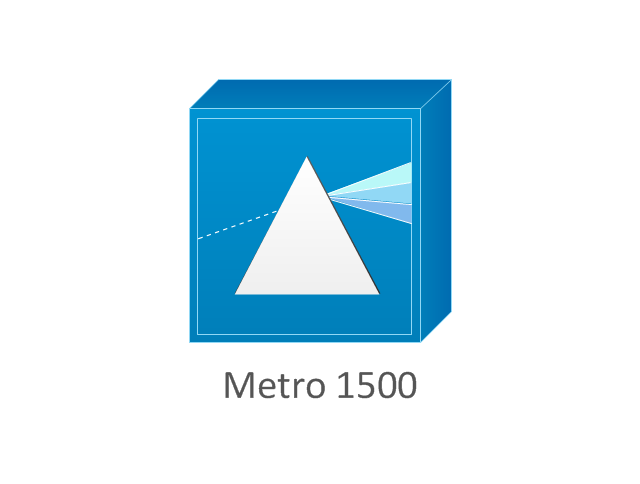
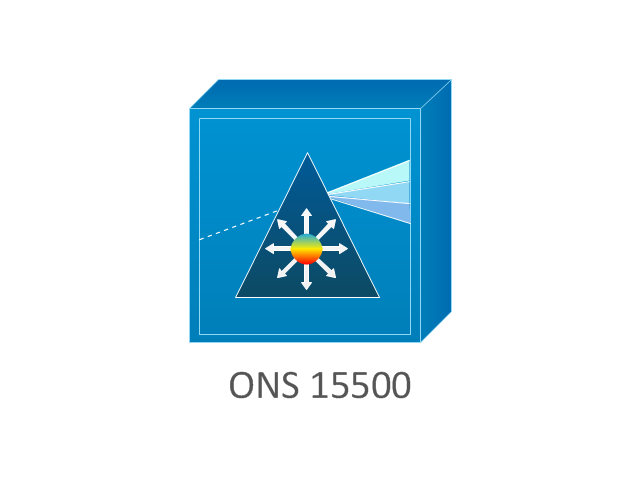
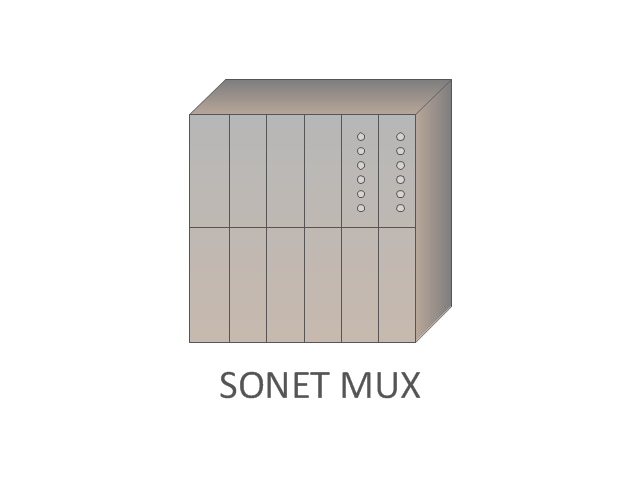
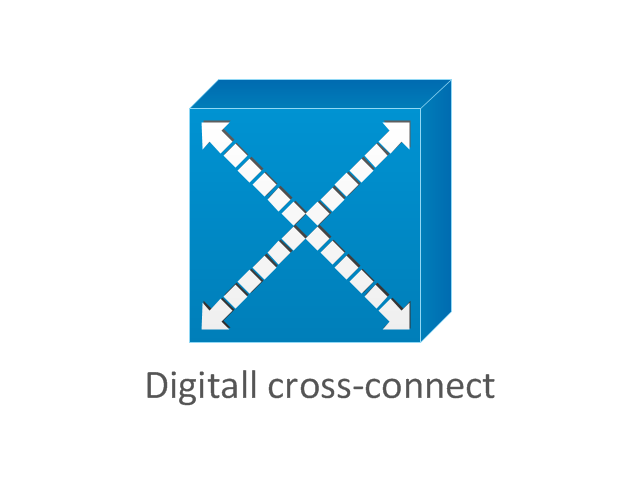
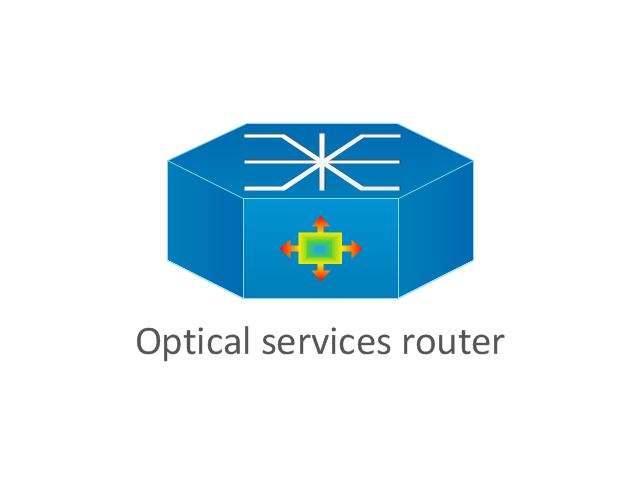
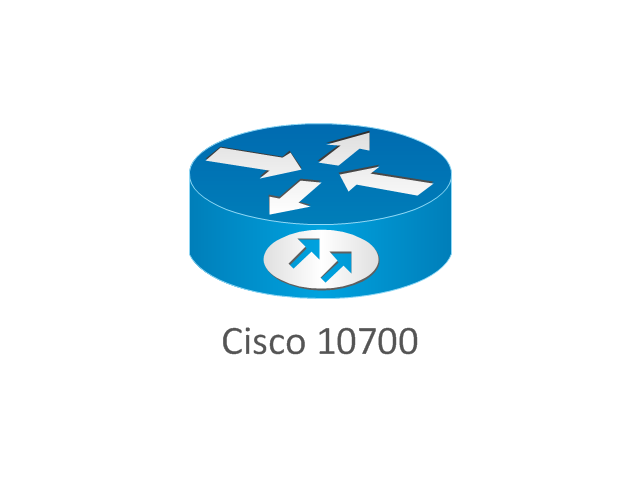
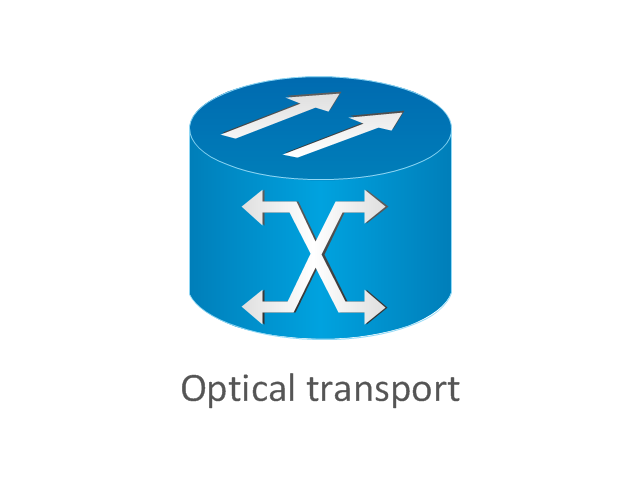
You want design the Cross Functional Diagram and need powerful software? Then ConceptDraw PRO diagramming and vector drawing software extended with Cross-Functional Flowcharts Solution is exactly what you need.The vector stencils library "Cisco optical" contains 19 symbols of optical devices for drawing Cisco computer network diagrams.
"Fiber-optic communication is a method of transmitting information from one place to another by sending pulses of light through an optical fiber. The light forms an electromagnetic carrier wave that is modulated to carry information. ... Because of its advantages over electrical transmission, optical fibers have largely replaced copper wire communications in core networks in the developed world. Optical fiber is used by many telecommunications companies to transmit telephone signals, Internet communication, and cable television signals. ...
The process of communicating using fiber-optics involves the following basic steps: Creating the optical signal involving the use of a transmitter, relaying the signal along the fiber, ensuring that the signal does not become too distorted or weak, receiving the optical signal, and converting it into an electrical signal." [Fiber-optic communication. Wikipedia]
The symbols example "Cisco optical - Vector stencils library" was created using the ConceptDraw PRO diagramming and vector drawing software extended with the Cisco Network Diagrams solution from the Computer and Networks area of ConceptDraw Solution Park.
www.conceptdraw.com/ solution-park/ computer-networks-cisco
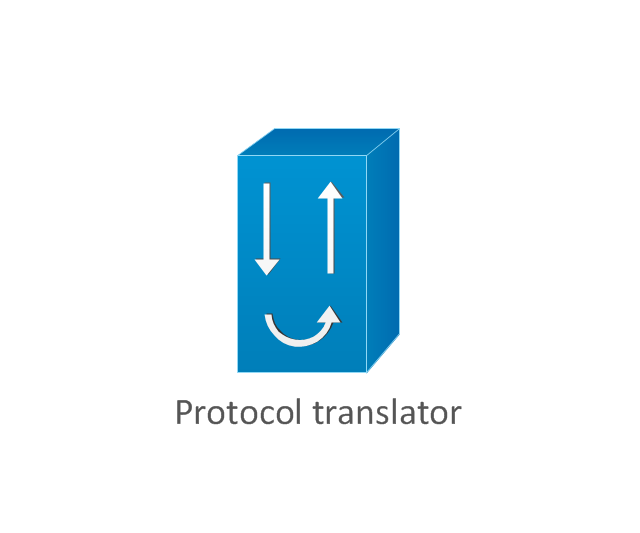
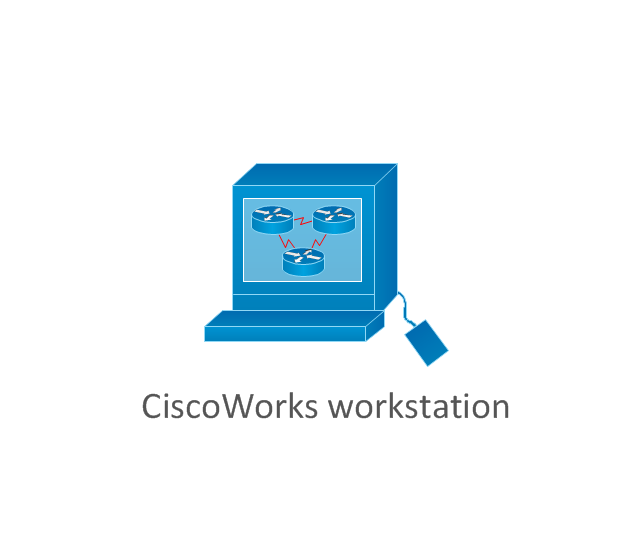
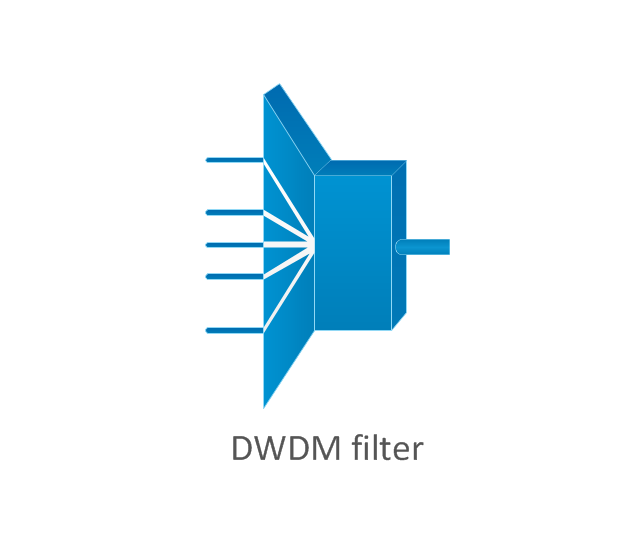
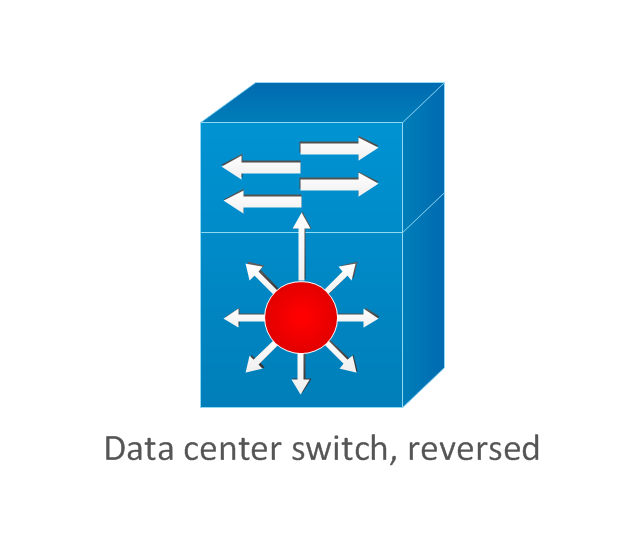
The vector stencils library "Cisco products additional" contains 141 symbols of computer network devices and equipment for drawing Cisco network diagrams.
The symbols example "Cisco products additional - Vector stencils library" was created using the ConceptDraw PRO diagramming and vector drawing software extended with the Cisco Network Diagrams solution from the Computer and Networks area of ConceptDraw Solution Park.
www.conceptdraw.com/ solution-park/ computer-networks-cisco
The symbols example "Cisco products additional - Vector stencils library" was created using the ConceptDraw PRO diagramming and vector drawing software extended with the Cisco Network Diagrams solution from the Computer and Networks area of ConceptDraw Solution Park.
www.conceptdraw.com/ solution-park/ computer-networks-cisco
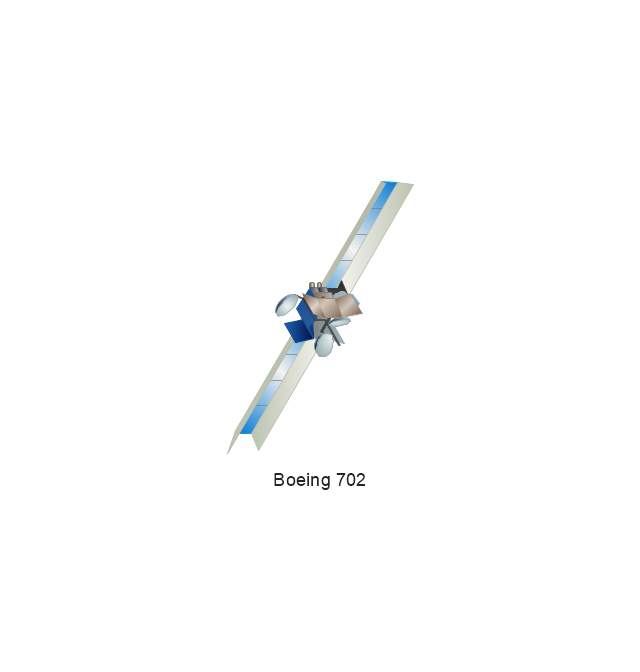
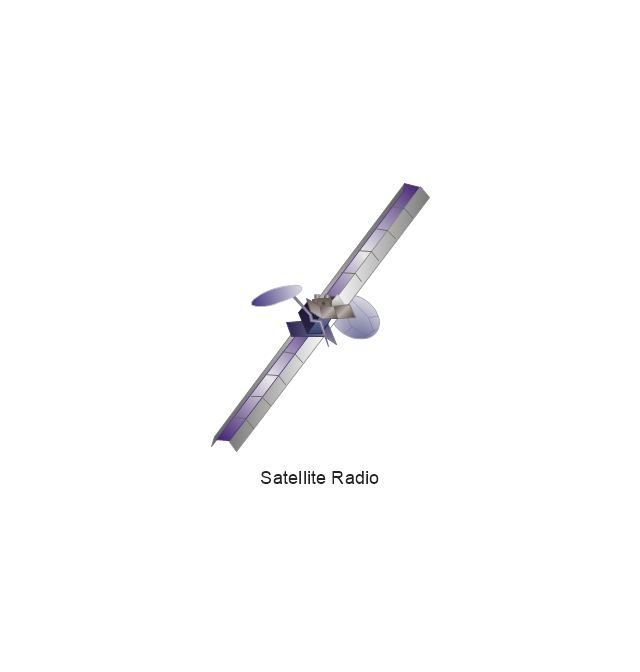
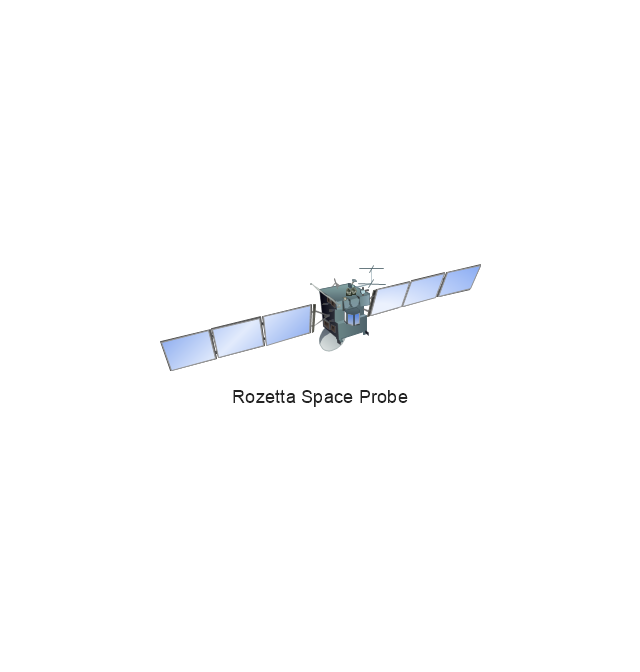
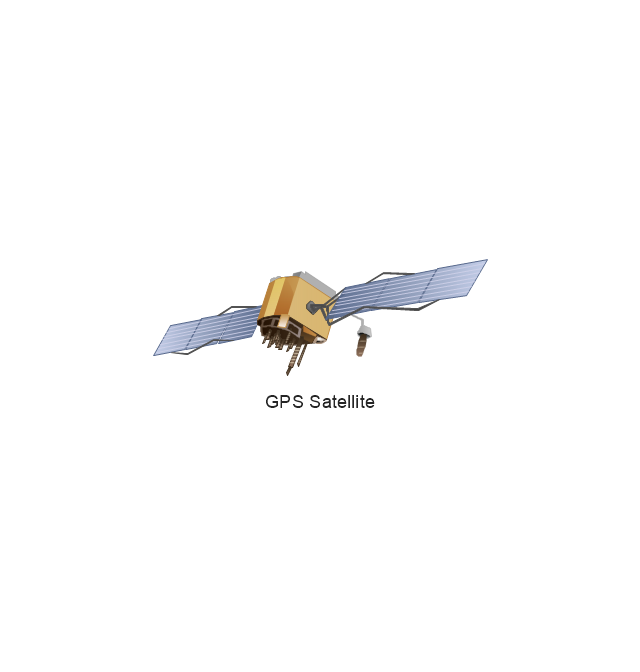
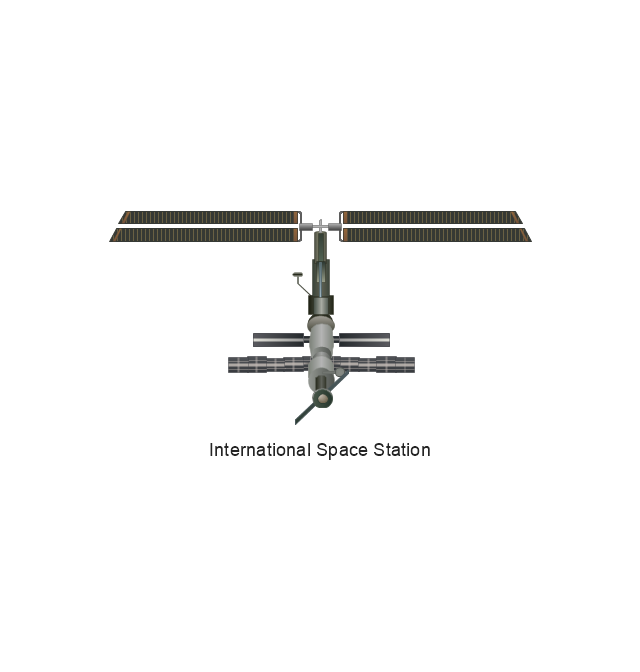
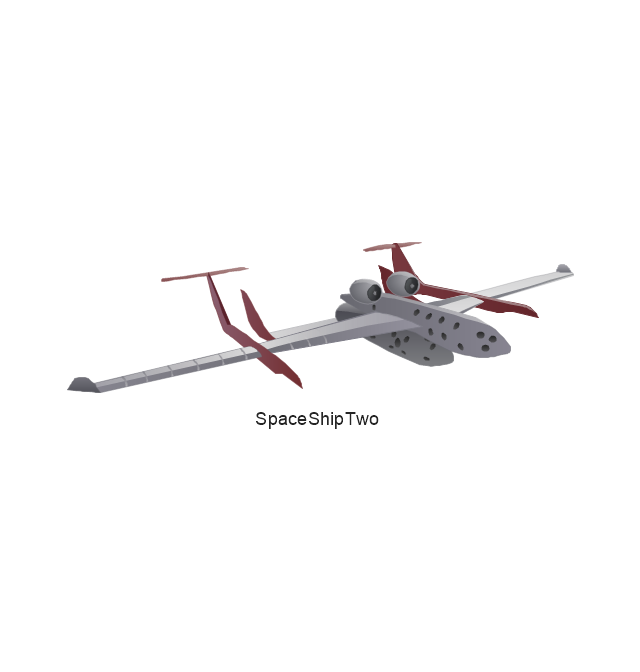
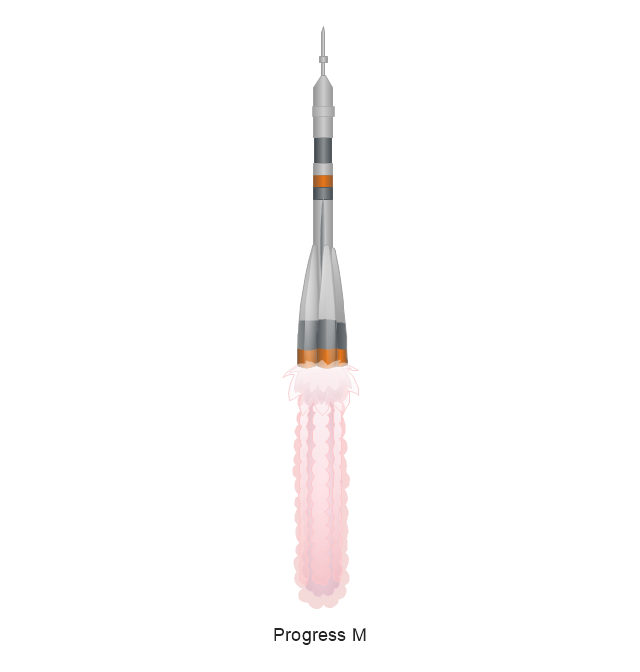
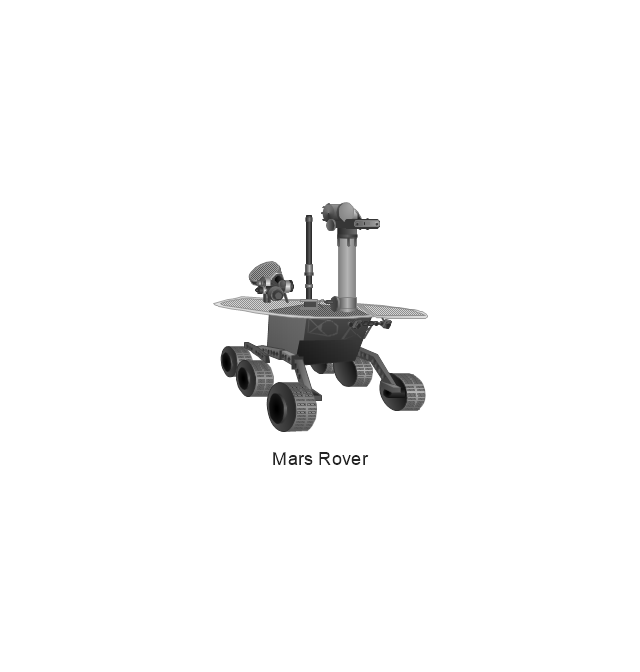
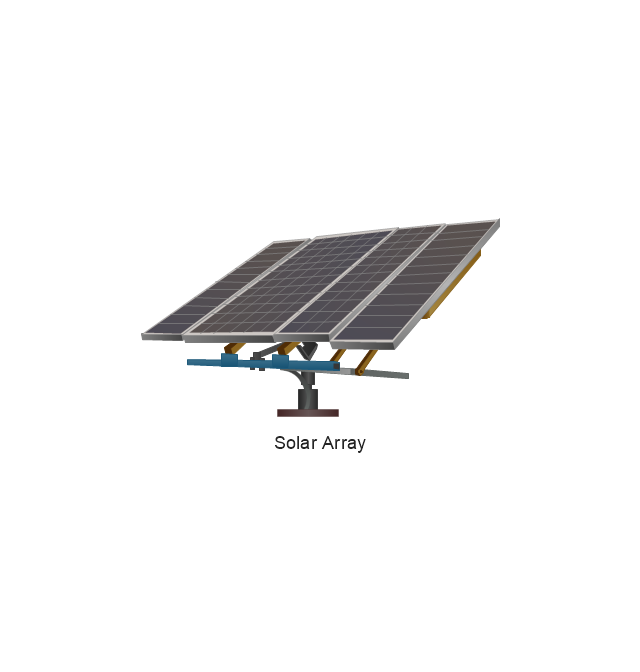
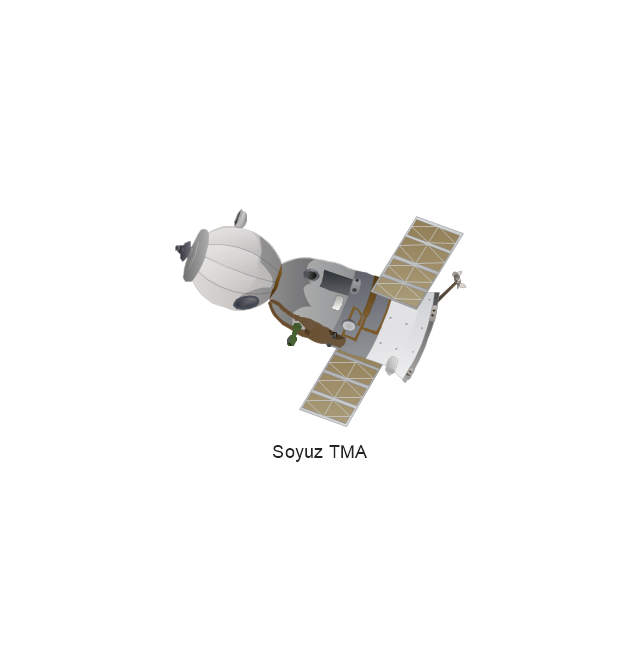
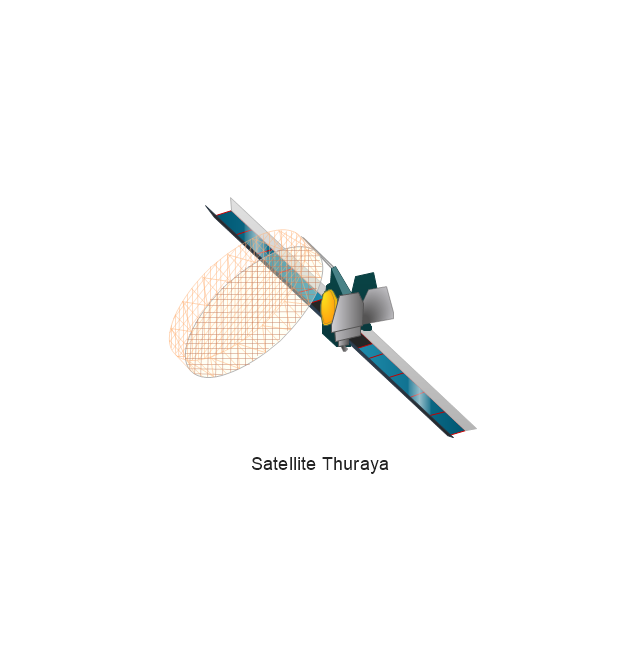
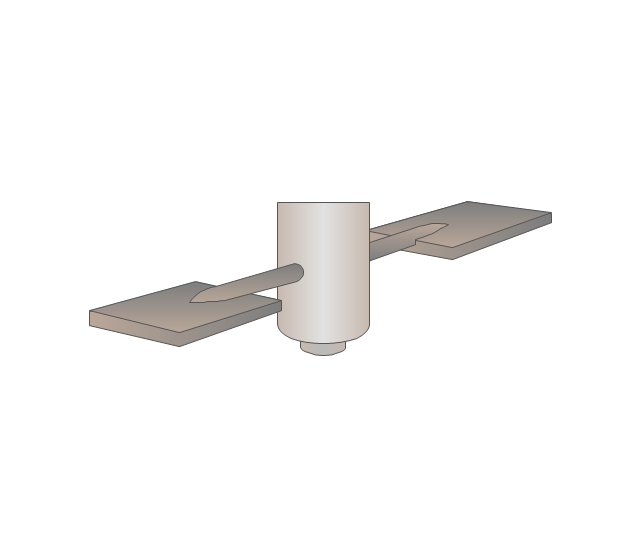
The vector stencils library "Aerospace" contains 38 clip art images for creating aerospace illustrations, presentation slides, infographics and webpages using the ConceptDraw PRO diagramming and vector drawing software.
"Aerospace describes the human effort in science, engineering and business to fly in the atmosphere of Earth (aeronautics) and surrounding space (astronautics). Aerospace organisations research, design, manufacture, operate, or maintain aircraft and/ or spacecraft. Aerospace activity is very diverse, with a multitude of commercial, industrial and military applications.
Aerospace is not the same as airspace, which is the physical air space directly above a location on the ground." [Aerospace. Wikipedia]
The vector stencils library "Aerospace" is included in the Aerospace and Transport solution from the Illustrations area of ConceptDraw Solution Park.
www.conceptdraw.com/ solution-park/ illustrations-aerospace-transport
The vector stencils library "AWS Analytics" contains 21 icons: Amazon Athena icon, Amazon CloudSearch icons, Amazon EMR icons, Amazon ES icons, Amazon Kinesis icons, Amazon QuickSight icon, Amazon Redshift icons, AWS Data Pipeline icon.
Use it to draw Amazon Web Services architecture diagrams with ConceptDraw PRO diagramming and vector drawing software.
"Amazon Elasticsearch Service is a managed service that makes it easy to deploy, operate, and scale Elasticsearch in the AWS Cloud. Elasticsearch is a popular open-source search and analytics engine for use cases such as log analytics, real-time application monitoring, and click stream analytics." [aws.amazon.com/ elasticsearch-service/ ]
"Amazon Elastic MapReduce (Amazon EMR) is a web service that makes it easy to quickly and cost-effectively process vast amounts of data." [aws.amazon.com/ elasticmapreduce/ ]
"Amazon Kinesis is a platform for streaming data on AWS, offering powerful services to make it easy to load and analyze streaming data, and also providing the ability for you to build custom streaming data applications for specialized needs." [aws.amazon.com/ kinesis/ ]
"Amazon Machine Learning is a service that makes it easy for developers of all skill levels to use machine learning technology." [aws.amazon.com/ machine-learning/ ]
"Amazon QuickSight is a very fast, cloud-powered business intelligence (BI) service that makes it easy for all employees to build visualizations, perform ad-hoc analysis, and quickly get business insights from their data." [aws.amazon.com/ quicksight/ ]
"AWS Data Pipeline is a web service that helps you reliably process and move data between different AWS compute and storage services, as well as on-premise data sources, at specified intervals." [aws.amazon.com/ datapipeline/ ]
The AWS icons example "Design elements - AWS Analytics" is included in the AWS Architecture Diagrams solution from the Computer and Networks area of ConceptDraw Solution Park.
The vector stencils library "AWS Analytics" contains 9 Amazon Web Services analytics icons: Amazon EMR, Cluster, MapR M3 engine, MapR M5 engine, MapR M7 engine, Engine, Amazon Kinesis, Kinesis-enabled app, AWS Data Pipeline. Use it to draw AWS architecture diagrams of cloud service. AWS analytics services include: Hadoop, Real-time, Machine Learning, Data Warehouse, Data Pipelines. The symbols example "AWS Analytics - Vector stencils library" was created using the ConceptDraw PRO diagramming and vector drawing software extended with the AWS Architecture Diagrams solution from the Computer and Networks area of ConceptDraw Solution Park.
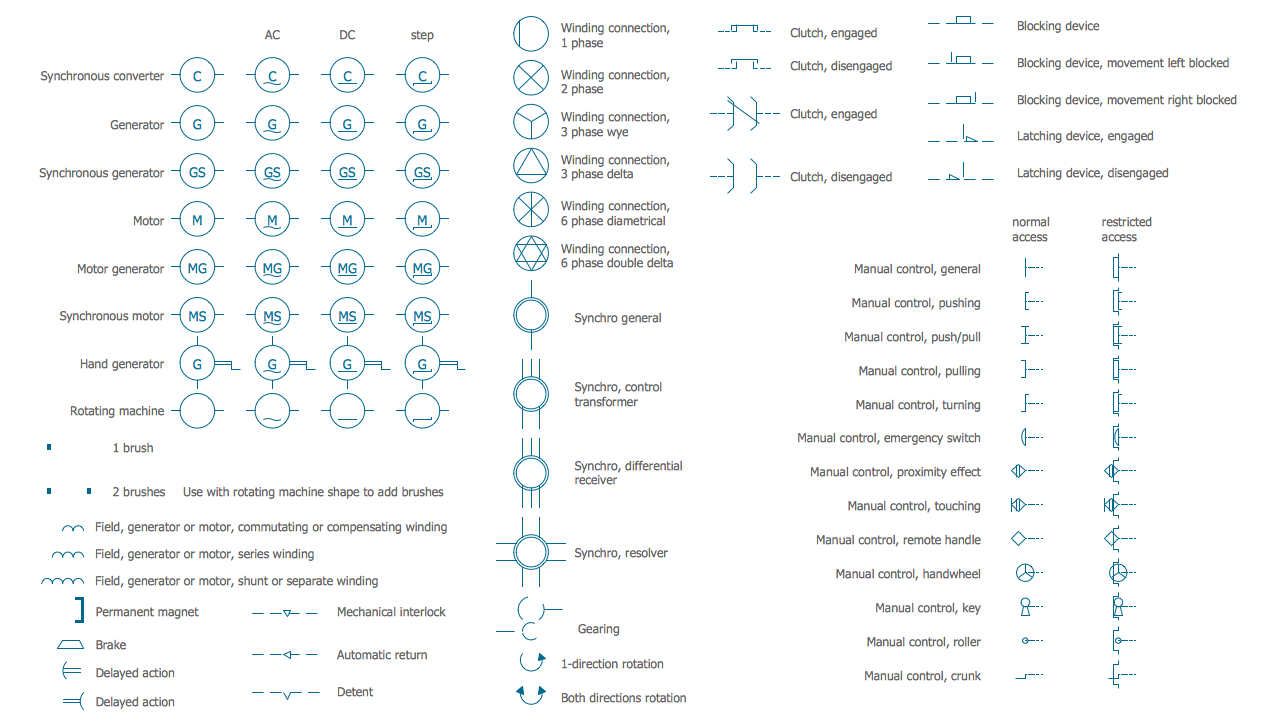
Electrical Symbols — Rotating Equipment
Electrical rotating machines, such as motors and generators, are vital assets for any power plant or large industrial company. An electric motor is an electrical machine that converts electrical energy into mechanical energy. The reverse of this would be the conversion of mechanical energy into electrical energy and is done by an electric generator. In normal motoring mode, most electric motors operate through the interaction between an electric motor's magnetic field and winding currents to generate force within the motor. In certain applications, such as in the transportation industry with traction motors, electric motors can operate in both motoring and generating or braking modes to also produce electrical energy from mechanical energy. 26 libraries of the Electrical Engineering Solution of ConceptDraw PRO make your electrical diagramming simple, efficient, and effective. You can simply and quickly drop the ready-to-use objects from libraries into your document to create the electrical diagram.
 Software Development
This solution extends ConceptDraw PRO v9.4 and helps to accelerate and simplify software development and design by allowing you to draw UML diagrams and prototype Windows and Mac OS user interfaces.
- Replacing engine oil - Opportunity flowchart | Basic Flowchart ...
- Replacing engine oil - Opportunity flowchart | Cross Functional ...
- Engine Block Diagram
- Block diagram - Automotive HVAC system | Replacing engine oil ...
- Opportunity flowchart - Template | Replacing engine oil - Opportunity ...
- Basic Flowchart Examples | Replacing engine oil - Opportunity ...
- Engine Oil Flow Process
- Cisco network topology - Vector stencils library | Car Engine Basic ...
- Replacing engine oil - Opportunity flowchart | Process flow diagram ...
- Process Flowchart | Replacing engine oil - Opportunity flowchart ...
- Modeling Workflow Engine
- Flow Chart And Block Diagram Of Engine Starting
- Replacing engine oil - Opportunity flowchart | Types of Flowcharts ...
- Open Source Workflow Engine
- Analytics Engine Architecture
- Engine Assembly Process Chart
- Replacing engine oil - Opportunity flowchart | Process Flowchart ...
- A Sketch Of An Engine Block Diagram
- Replacing engine oil - Opportunity flowchart | Activity Network ...
- Replacing engine oil - Opportunity flowchart | The Best Tool for ...











-cisco-products-additional---vector-stencils-library.png--diagram-flowchart-example.png)

-cisco-products-additional---vector-stencils-library.png--diagram-flowchart-example.png)
-cisco-products-additional---vector-stencils-library.png--diagram-flowchart-example.png)
-cisco-products-additional---vector-stencils-library.png--diagram-flowchart-example.png)

-cisco-products-additional---vector-stencils-library.png--diagram-flowchart-example.png)
-cisco-products-additional---vector-stencils-library.png--diagram-flowchart-example.png)

-cisco-products-additional---vector-stencils-library.png--diagram-flowchart-example.png)

-cisco-products-additional---vector-stencils-library.png--diagram-flowchart-example.png)

-cisco-products-additional---vector-stencils-library.png--diagram-flowchart-example.png)


-cisco-products-additional---vector-stencils-library.png--diagram-flowchart-example.png)

-cisco-products-additional---vector-stencils-library.png--diagram-flowchart-example.png)
-cisco-products-additional---vector-stencils-library.png--diagram-flowchart-example.png)
-cisco-products-additional---vector-stencils-library.png--diagram-flowchart-example.png)

-cisco-products-additional---vector-stencils-library.png--diagram-flowchart-example.png)
-cisco-products-additional---vector-stencils-library.png--diagram-flowchart-example.png)




-cisco-network-topology---vector-stencils-library.png--diagram-flowchart-example.png)
-cisco-network-topology---vector-stencils-library.png--diagram-flowchart-example.png)


-cisco-network-topology---vector-stencils-library.png--diagram-flowchart-example.png)


-cisco-network-topology---vector-stencils-library.png--diagram-flowchart-example.png)









-cisco-network-topology---vector-stencils-library.png--diagram-flowchart-example.png)






-cisco-optical---vector-stencils-library.png--diagram-flowchart-example.png)


-cisco-optical---vector-stencils-library.png--diagram-flowchart-example.png)
