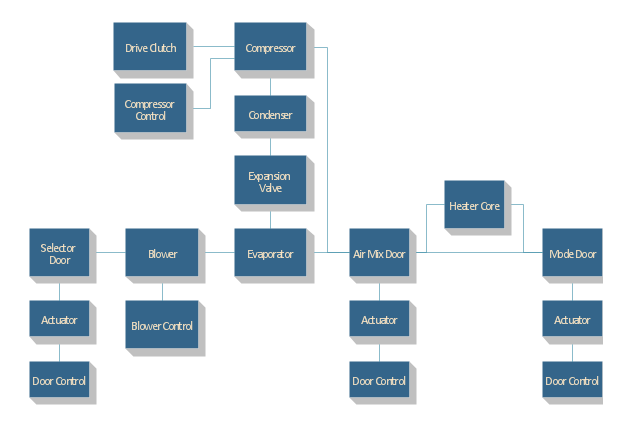
"Automobile air conditioning systems cool the occupants of a vehicle in hot weather, and have come into wide use from the late twentieth century. Air conditioners use significant power; on the other hand the drag of a car with closed windows is less than if the windows are open to cool the occupants evaporatively. There has been much debate on the effect of air conditioning on the fuel efficiency of a vehicle. Factors such as wind resistance, aerodynamics and engine power and weight have to be factored into finding the true variance between using the air conditioning system and not using it when estimating the actual fuel mileage. Other factors on the impact on the engine and an overall engine heat increase can have an impact on the cooling system of the vehicle." [Automobile air conditioning. Wikipedia]
The block diagram example "Automotive HVAC system" was created using the ConceptDraw PRO diagramming and vector drawing software extended with the Block Diagrams solution from the area "What is a Diagram" of ConceptDraw Solution Park.
The block diagram example "Automotive HVAC system" was created using the ConceptDraw PRO diagramming and vector drawing software extended with the Block Diagrams solution from the area "What is a Diagram" of ConceptDraw Solution Park.
Automotive HVAC system
Cross Functional Diagram

The Building Blocks Used in EPC Diagrams

Basic Flowchart Examples

 Engineering
This solution extends ConceptDraw DIAGRAM.4 with the ability to visualize industrial systems in electronics, electrical, chemical, process, and mechanical engineering.
Draw Company Structure with Organization Charting Software

Draw Company Structure Diagram - get the detailed information about the company structure and hierarchy - who execute what tasks and who is in charge at this company. This information shows the reasoning and success of business and is indispensable for investors and financial institutions.
 SYSML
SYSML
The SysML solution helps to present diagrams using Systems Modeling Language; a perfect tool for system engineering.
Best Diagramming Software for macOS


Business Diagram Software


Elements of an Event-Driven Process Chain
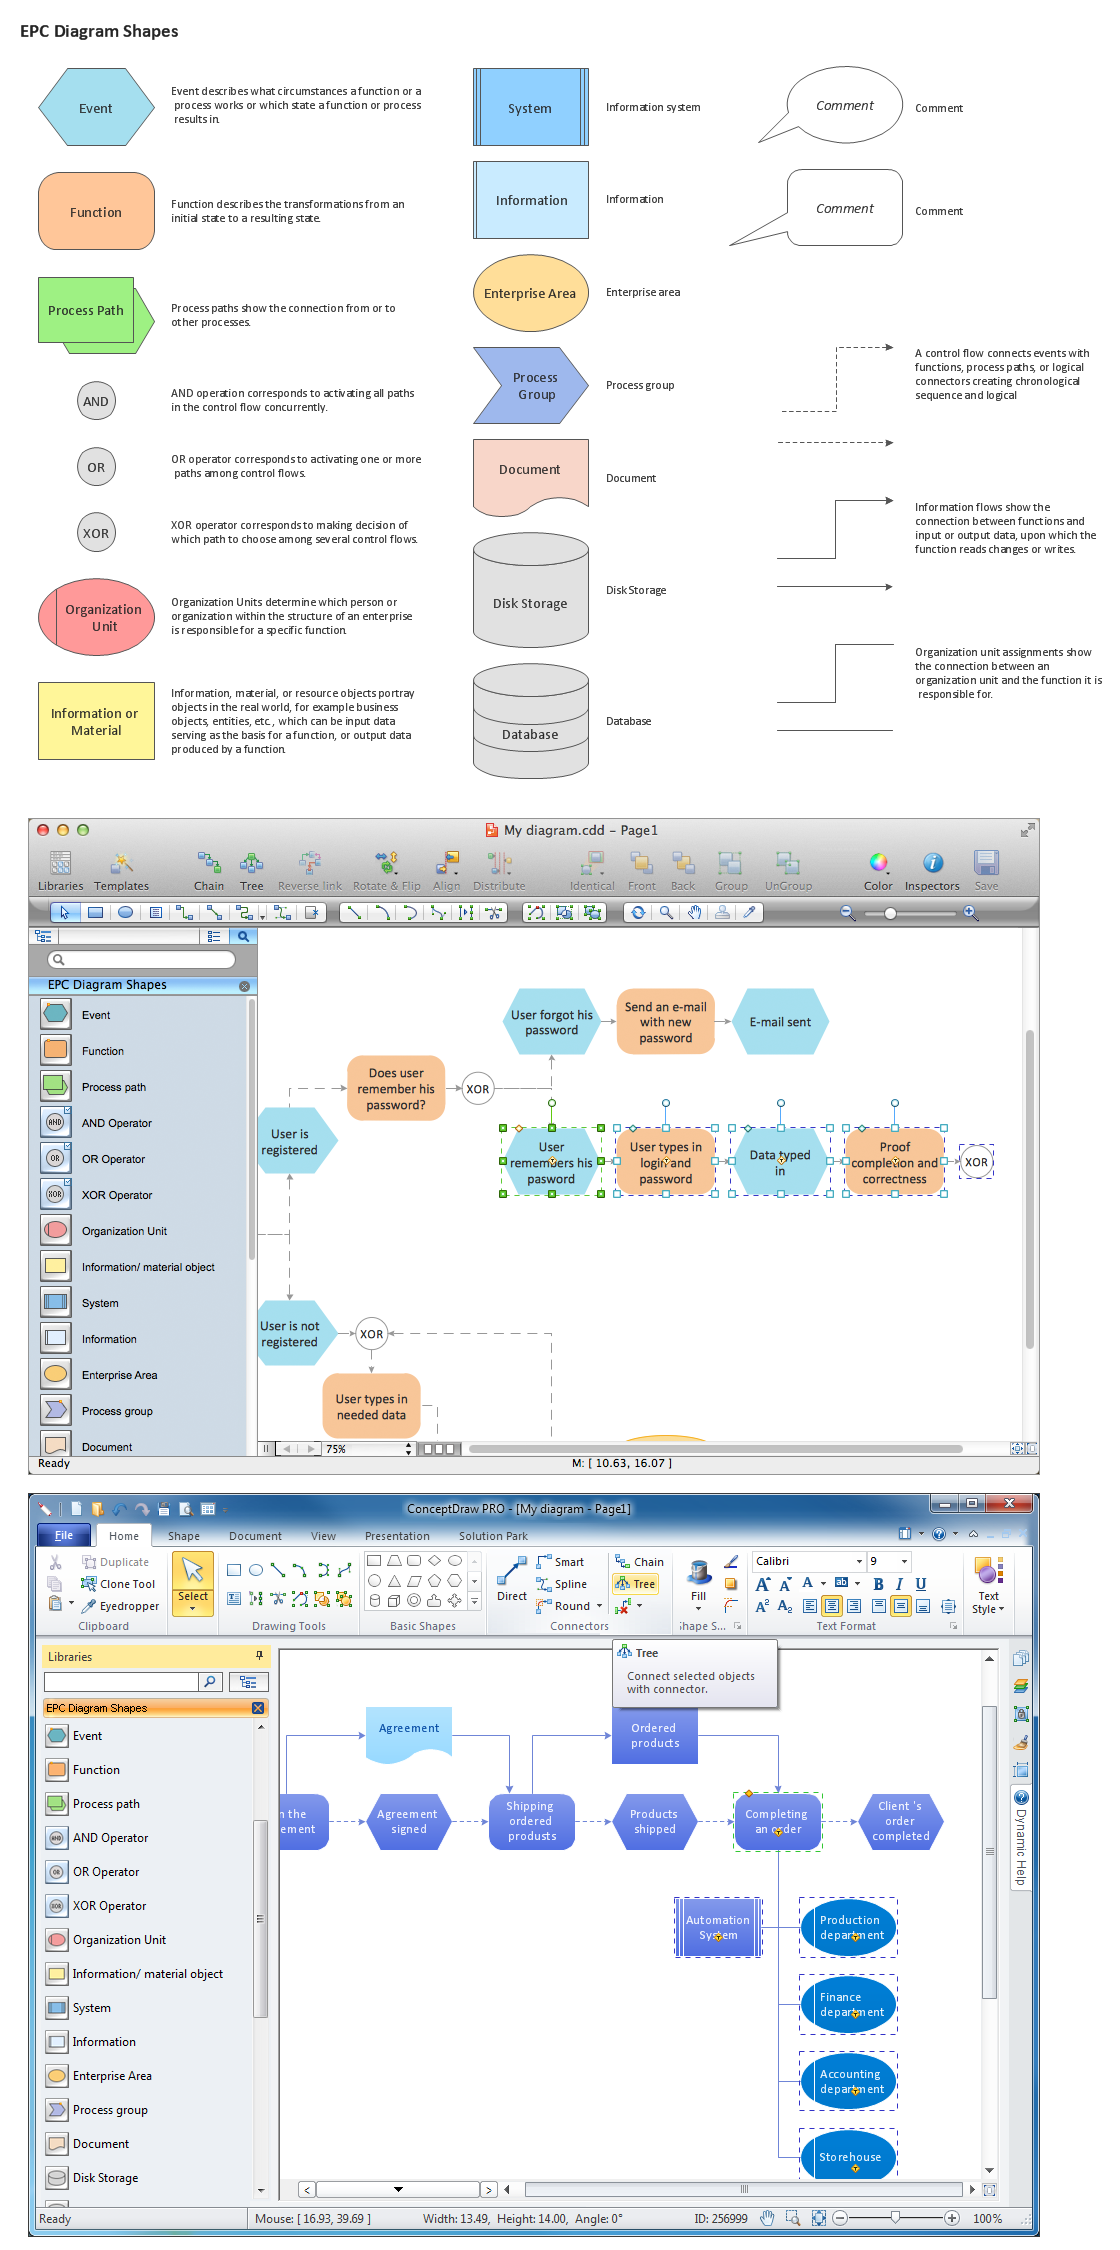
Graphical Symbols to use in EPC diagrams

Basic Diagramming

Best Diagramming

Best Vector Drawing Application for Mac OS X

 Cross-Functional Flowcharts
Cross-functional flowcharts are powerful and useful tool for visualizing and analyzing complex business processes which requires involvement of multiple people, teams or even departments. They let clearly represent a sequence of the process steps, the order of operations, relationships between processes and responsible functional units (such as departments or positions).
- A Sketch Of An Engine Block Diagram
- Engine Block Diagram
- Diagram Of Engine Block
- Car Engine Basic Diagram And Block Diagram
- Car Engine Block Diagram With Air Conditioning System
- Simple Block Diagram Of Air Engine
- Block Diagram Of Car Engine
- Block Diagrams | UML Block Diagram | Functional Block Diagram ...
- How to Draw a Block Diagram in ConceptDraw PRO | The Building ...
- Diagram Of An Engine Block
- Block diagram - Automotive HVAC system | Replacing engine oil ...
- Basic Diagramming | The Building Blocks Used in EPC Diagrams ...
- Cross Functional Diagram | How to Draw a Block Diagram in ...
- Block Diagram Of Engine
- Diagram Of Block Engine Of A Car
- How to Create an ERD Diagram | Block diagram - Automotive HVAC ...
- Flow Chart And Block Diagram Of Engine Starting
- Engine Management System Block Diagram
- Diagram Of A Block Engine