 Enterprise Architecture Diagrams
Enterprise Architecture Diagrams solution extends ConceptDraw DIAGRAM software with templates, samples and library of vector stencils for drawing the diagrams of enterprise architecture models.
HelpDesk
How to Create an Enterprise Architecture Diagram
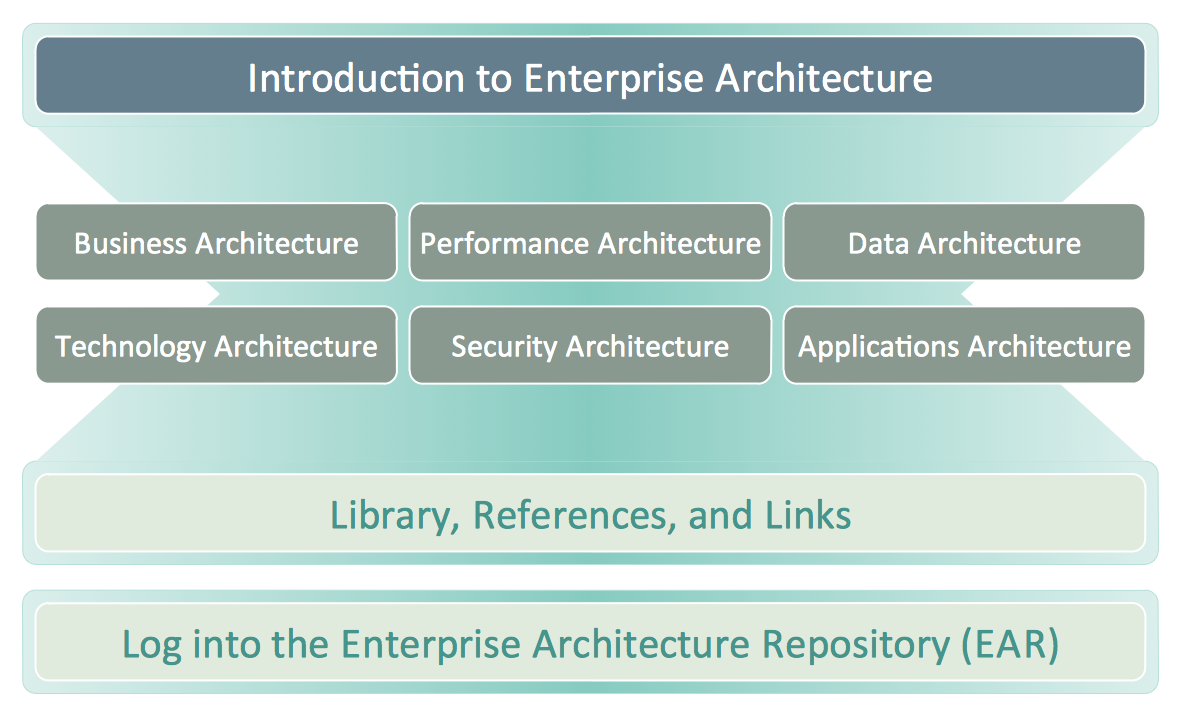
An Enterprise Architecture (EA) diagram is used to display the structure and operations of an organization. It is used to analyze and document an organization and its business functions, along with the applications and systems on which they are implemented. The aim of an enterprise architecture diagram is to determine how an organization can effectively achieve its current and future objectives. The Enterprise Architecture often uses diagrams to support the decision-making process. ConceptDraw DIAGRAM allows you to design Enterprise Architecture diagrams of any complexity.The Lean Enterprise Value Stream Mapping
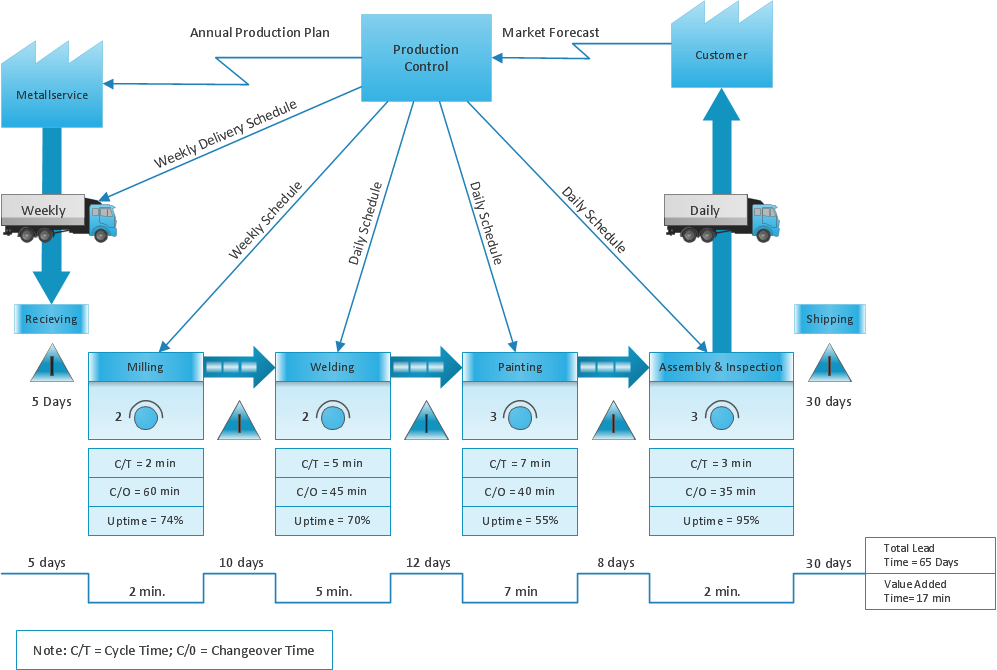
Create value stream maps - for value stream analysis and value stream management, material and information flow mapping, using our quick start templates included with ConceptDraw.MindMap of Baden-Württemberg Districts
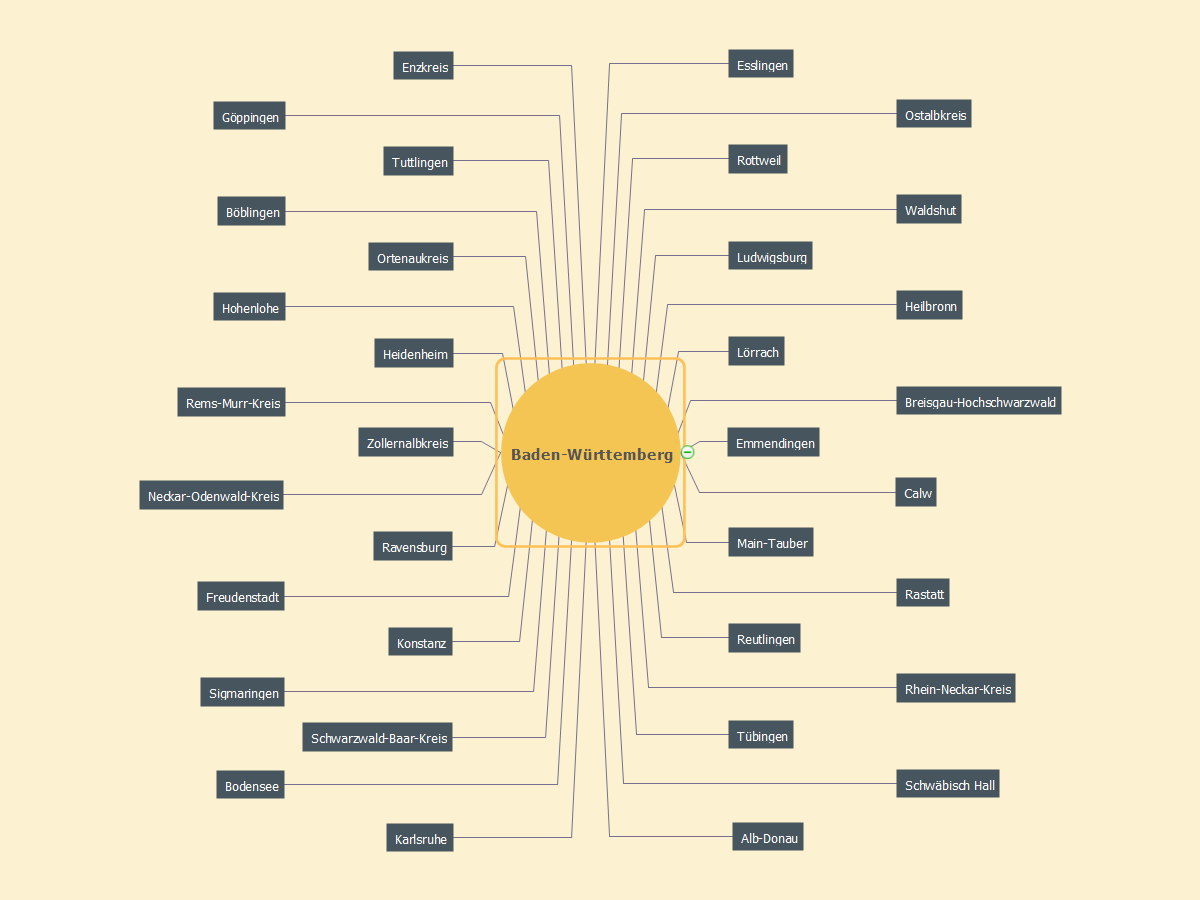
ConceptDraw MINDMAP software is ideal for designing various Mind Maps, for representing characteristics of different cities, regions, countries and continents. The Germany is not exception, the ConceptDraw MINDMAP assists in designing different Germany related Mind Maps. A given Mind Map is also created in ConceptDraw MINDMAP and illustrates the districts of Baden-Württemberg that is the Germany's state situated in the southwest and east of the Upper Rhine. Baden-Württemberg state is the third largest in Germany by size and population, Stuttgart is its capital. The list of districts contains Alb-Donau, Biberach, Bodensee, Böblingen, Breisgau-Hochschwarzwald, Calw, Enzkreis, Emmendingen, Esslingen, Freudenstadt, Göppingen, Heidenheim, Hohenlohe, Heilbronn, Karlsruhe, Konstanz (Constance), Ludwigsburg, Lörrach, Main-Tauber, Neckar-Odenwald-Kreis, Ostalbkreis, Ortenaukreis, Rastatt, Reutlingen, Ravensburg, Rems-Murr-Kreis, Rhein-Neckar-Kreis, Rottweil, Sigmaringen, Schwäbisch Hall, Schwarzwald-Baar-Kreis, Tuttlingen, Tübingen, Waldshut, Zollernalbkreis.Network Diagram Software Enterprise Private Network
ConceptDraw - Perfect Network Diagramming Software with abundant examples and templates. ConceptDraw Network Diagram is ideal for network engineers and network designers who need to draw Enterprise Private Network diagrams.
How To Use Enterprise Collaboration Software
Enterprise collaboration software helps to facilitate action-oriented teams working together over geographic distances by providing tools that aids on communication, collaboration process and problem solving.
EPC for Configuring an Enterprise Resource Planning
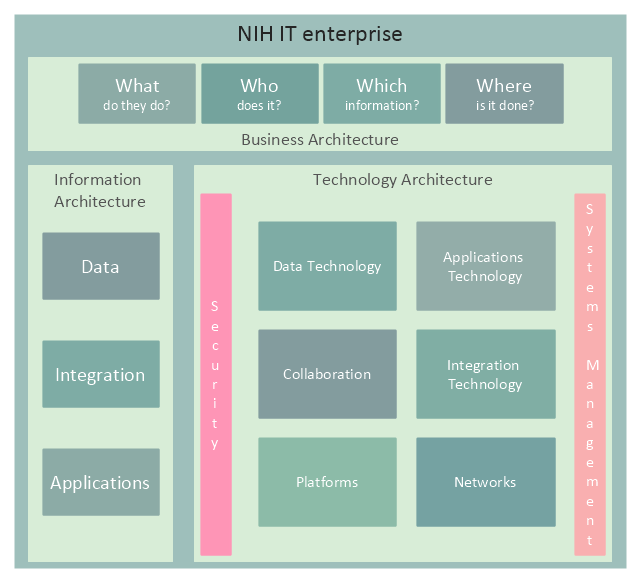
Event-Driven Process Chain Diagrams for improvement throughout an organisation. ConceptDraw DIAGRAM - software that reduces the time needed to create a business process model.This enterprise architecture diagram sample was redesigned from the illustration of the NIH Enterprise Architecture website. [enterprisearchitecture.nih.gov/ Pages/ Framework.aspx]
"Enterprise architecture is a comprehensive framework used to manage and align an organization's Information Technology (IT) assets, people, operations, and projects with its operational characteristics. In other words, the enterprise architecture defines how information and technology will support the business operations and provide benefit for the business.
It illustrates the organization’s core mission, each component critical to performing that mission, and how each of these components is interrelated. These components include:
(1) Guiding principles,
(2) Organization structure,
(3) Business processes,
(4) People or stakeholders,
(5) Applications, data, and infrastructure,
(6) Technologies upon which networks, applications and systems are built.
Guiding principles, organization structure, business processes, and people don’t sound very technical. That’s because enterprise architecture is about more than technology. It is about the entire organization (or enterprise) and identifying all of the bits and pieces that make the organization work." [enterprisearchitecture.nih.gov/ Pages/ what.aspx]
The example "NIH IT enterprise architecture framework" was created using the ConceptDraw PRO diagramming and vector drawing software extended with the Enterprise Architecture Diagrams solution from the Management area of ConceptDraw Solution Park.
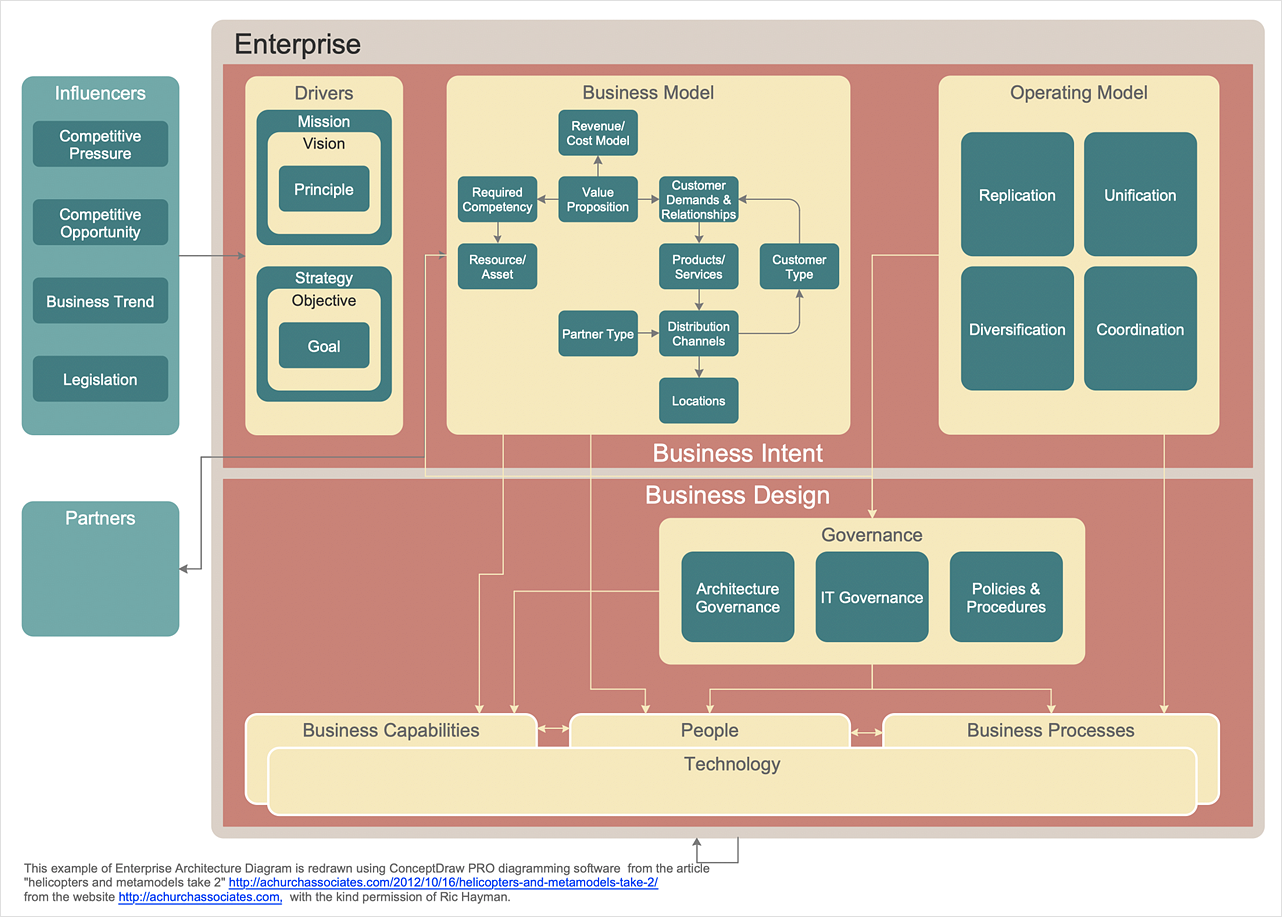
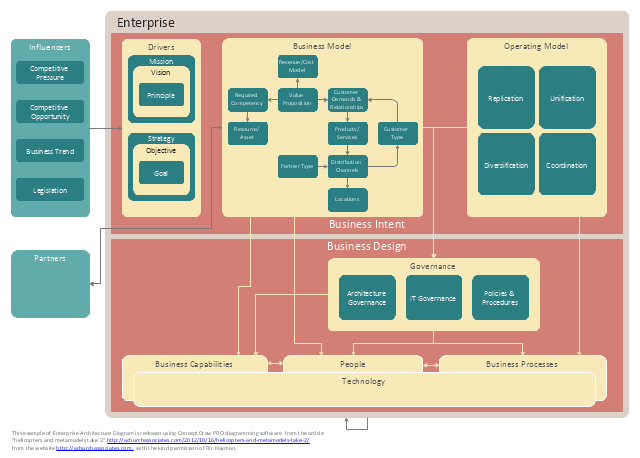
This enterprise architecture (EA) metamodel diagram example was redesigned from the illustration of article " helicopters and metamodels take 2".
"This is a “helicopter” level view – meant as a consulting and conversation guide for senior managers to help them place enterprise architecture appropriately in their strategic thinking."
www.achurchassociates.com/ 2012/ 10/ 16/ helicopters-and-metamodels-take-2/
from the website www.achurchassociates.com , with the kind permission of Ric Hayman.
The example "Enterprise architecture diagram" was created using the ConceptDraw PRO diagramming and vector drawing software extended with the Enterprise Architecture Diagrams solution from the Management area of ConceptDraw Solution Park.
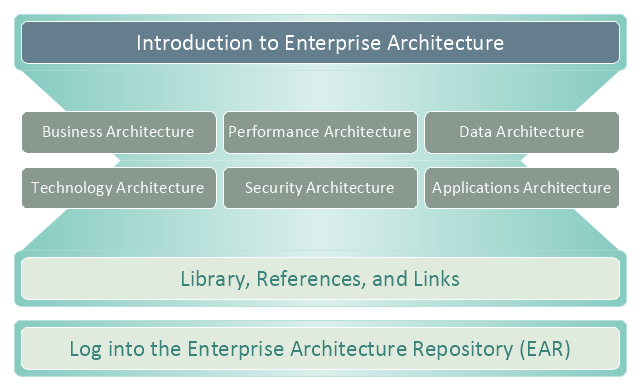
This enterprise architecture diagram sample was drawn on the base of the figure illustrating the webpage "Enterprise Architecture" from the United States Department of Agriculture (USDA) website.
"The USDA's Enterprise Architecture program strategically partners with all agencies to provide value to USDA's mission areas, business processes, and Information Technology (IT) capabilities.
Introduction.
The USDA Enterprise Architecture (EA) helps make sure information technology investments align with the mission and goals of the Department. It defines how information and technology should support USDA’s strategic goals and benefit the business.
Purpose.
The intent of the USDA Enterprise Architecture is to help make the information technology (IT) expenditures more effectively serve the mission and goals of the organization. Enterprise architecture defines how information and technology support USDA’s strategic planning to benefit our business. There are many ways to organize the information and diagrams that make up the architecture."
[ocio.usda.gov/ about-ocio/ governance-and-strategic-investment-gsi/ enterprise-architecture]
The enterprise architecture diagram example "USDA's Enterprise Architecture" was created using the ConceptDraw PRO diagramming and vector drawing software extended with the Enterprise Architecture Diagrams solution from the Management area of ConceptDraw Solution Park.
This enterprise architecture diagram sample was redesigned from the Wikimedia Commons file: Enterprise Architecture Domains Subdomains.jpg.
[commons.wikimedia.org/ wiki/ File:Enterprise_ Architecture_ Domains_ Subdomains.jpg]
An enterprise architecture’s landscape is usually divided into various domains based on the attributes of the environment and the logical grouping based on Industry EA Frameworks.
Enterprise Architecture consists of 5 domains: Business, Application, Information, and Technical (Infrastructure and Telecom).
The example "Enterprise architecture domains" was created using the ConceptDraw PRO diagramming and vector drawing software extended with the Enterprise Architecture Diagrams solution from the Management area of ConceptDraw Solution Park.
This library of vector stencils "Enterprise architecture diagrams" contains 16 shapes for visualizing the enterprise architecture (EA) models using the ConceptDraw PRO diagramming and vector drawing software.
"Enterprise architecture (EA) is "a well-defined practice for conducting enterprise analysis, design, planning, and implementation, using a holistic approach at all times, for the successful development and execution of strategy. Enterprise Architecture applies architecture principles and practices to guide organizations through the business, information, process, and technology changes necessary to execute their strategies. These practices utilize the various aspects of an enterprise to identify, motivate, and achieve these changes."
Practitioners of EA call themselves enterprise architects. An enterprise architect is a person responsible for performing this complex analysis of business structure and processes and is often called upon to draw conclusions from the information collected. By producing this understanding, architects are attempting to address the goals of Enterprise Architecture: Effectiveness, Efficiency, Agility, and Durability." [Enterprise architecture. Wikipedia]
The example "Design elements - Enterprise architecture diagram" is included in the Enterprise Architecture Diagrams solution from the Management area of ConceptDraw Solution Park.
The vector stencils library "Azure architecture - Enterprise" contains 98 Microsoft Azure architecture symbols.
Use this enterprise cloud icon set to design your cloud computing architecture diagrams.
"Enterprise cloud computing is the special case of utilizing cloud computing for competitive advantage through breakout opportunities both for cost savings and, more importantly, for business innovation in terms of unprecedented speed and agility with vastly improved collaboration among business partners and customers." [whatis.techtarget.com/ definition/ Enterprise-Cloud-Computing-FAQ]
The symbols example "Design elements - Azure architecture - Enterprise" is included in the Azure Architecture solution from the Computer and Networks area of ConceptDraw Solution Park.
This financila dashboard example was drawn on the base of the Enterprise dashboard from the Mecklenburg County Government website.
[charmeck.org/ mecklenburg/ county/ CountyManagersOffice/ OMB/ dashboards/ Pages/ Enterprise.aspx]
"In management information systems, a dashboard is "an easy to read, often single page, real-time user interface, showing a graphical presentation of the current status (snapshot) and historical trends of an organization’s key performance indicators to enable instantaneous and informed decisions to be made at a glance."
For example, a manufacturing dashboard may show key performance indicators related to productivity such as number of parts manufactured, or number of failed quality inspections per hour. Similarly, a human resources dashboard may show KPIs related to staff recruitment, retention and composition, for example number of open positions, or average days or cost per recruitment.
Types of dashboards.
Dashboard of Sustainability screen shot illustrating example dashboard layout.
Digital dashboards may be laid out to track the flows inherent in the business processes that they monitor. Graphically, users may see the high-level processes and then drill down into low level data. This level of detail is often buried deep within the corporate enterprise and otherwise unavailable to the senior executives.
Three main types of digital dashboard dominate the market today: stand alone software applications, web-browser based applications, and desktop applications also known as desktop widgets. The last are driven by a widget engine.
Specialized dashboards may track all corporate functions. Examples include human resources, recruiting, sales, operations, security, information technology, project management, customer relationship management and many more departmental dashboards.
Digital dashboard projects involve business units as the driver and the information technology department as the enabler. The success of digital dashboard projects often depends on the metrics that were chosen for monitoring. Key performance indicators, balanced scorecards, and sales performance figures are some of the content appropriate on business dashboards." [Dashboard (management information systems). Wikipedia]
The example "Enterprise dashboard" was created using the ConceptDraw PRO diagramming and vector drawing software extended with the Composition Dashboard solution from the area "What is a Dashboard" of ConceptDraw Solution Park.
The vector stencils library "Business" contains 24 business icons.
Use it to design your business and finance illustrations and infographics with ConceptDraw PRO diagramming and vector drawing software.
"A business, also known as an enterprise, or a firm, is an entity involved in the provision of goods and/ or services to consumers. Businesses are prevalent in capitalist economies, where most of them are privately owned and provide goods and services to customers in exchange for other goods, services, or money. Businesses may also be social non-profit enterprises or state-owned public enterprises targeted for specific social and economic objectives. A business owned by multiple individuals may be formed as an incorporated company or jointly organised as a partnership. Countries have different laws that may ascribe different rights to the various business entities." [Business. Wikipedia]
The icon set example "Design elements - Business" is included in the Business and Finance solution from Illustration area of ConceptDraw Solution Park.
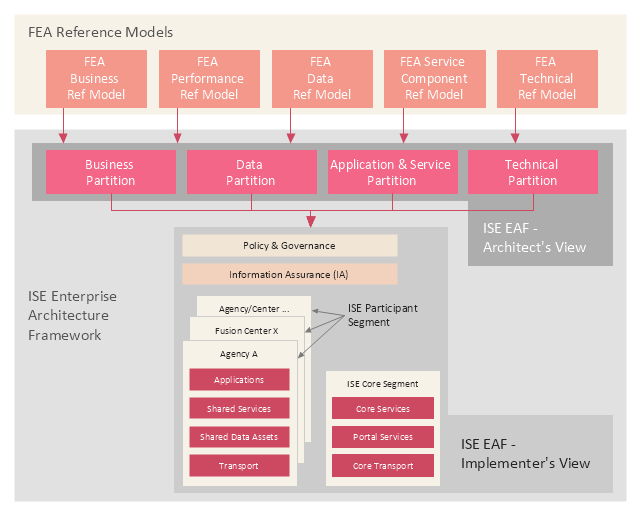
This enterprise architecture diagram example was drawn on the base of the figure illustrating the webpage "ISE Enterprise Architecture Framework 2007" from the Semantic Community website. "The ISE Enterprise Architecture Framework.
As Figure ... depicts, the Federal Enterprise Architecture (FEA) Reference Models (RMs) provide the basis for the ISE EAF. All elements of the ISE EAF are mapped back to elements of the FEA RMs with the FEA management processes applied by the OMB leveraged in support of implementing the ISE. The four ISE EAF partitions are mapped to the five FEA RMs to enable tracking the development of the ISE EAF across agencies using standardized OMB policies and processes that structure EA development and budgeting processes. The ISE EAF also provides an overarching mapping of the ISE into not only Federal civil systems, but also national security systems. ...
Two primary views are used to describe the ISE EAF: 1) the Architect’s View and 2) the Implementer’s View. While the term “view” is typically used to refer to different aspects of an architecture, the OMB suggested the term “partition” rather than the more common terms “architecture” or “view” to differentiate the ISE approach as a framework from the approach typically used in departmental and agency EAs. The Architect’s View comprises four partitions:
1) Business,
2) Data,
3) Application and Service, and
4) Technical.
The Architect’s View is used to provide structural alignment of the ISE architectural components into the FEA structure to ensure strategies, business processes, investments, data, systems, and technologies within the ISE are integrated and compatible with those across the Federal government."
[semanticommunity.info/ Information_ Sharing_ Environment/ ISE_ Enterprise_ Architecture_ Framework_ 2007#Figure_ ES-2._ The_ ISE_ Enterprise_ Architecture_ Framework_ Is_ Defined_ by_ Two_ Views_ and_ Four_ Partitions]
The diagram example "The ISE Enterprise Architecture Framework" was created using the ConceptDraw PRO diagramming and vector drawing software extended with the Enterprise Architecture Diagrams solution from the Management area of ConceptDraw Solution Park.
Data Flow Diagram Model
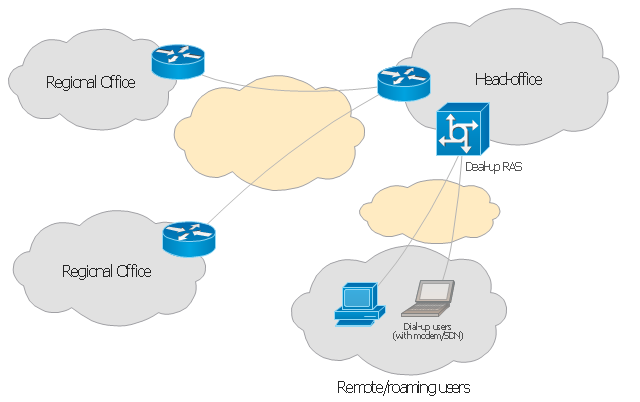
Data Flow Diagram (DFD) is a technique of graphical structural analysis, describing the sources external to the system, recipients of data, also logical functions, data flows and data stores that are accessed. The DFD's goal is to show how each process converts its inputs into the outputs and to identify relationships between these processes, at this make the system's description clear and understandable at every level of detail. Historically happened that for describing Data Flow Diagrams are used two notations - Yourdon and Gane-Sarson that differ each from other by graphical representation of symbols. The DFD model, like most other structural models is a hierarchical model. Each process can be subjected to decomposition on the structural components, the relationships between which in the same notation can be shown on a separate diagram. Typically, several DFD models are built when modeling the system. ConceptDraw DIAGRAM software enhanced with Data Flow Diagrams solution ideally suits for creation DFD models and professional drawing Data Flow Diagrams.This Cisco network diagram example was redesigned from the Wikimedia Commons file: EPN Frame-Relay and Dial-up Network.svg.
[commons.wikimedia.org/ wiki/ File:EPN_ Frame-Relay_ and_ Dial-up_ Network.svg]
This file is licensed under the Creative Commons Attribution-Share Alike 3.0 Unported license. [creativecommons.org/ licenses/ by-sa/ 3.0/ deed.en]
This diagram depicts enterprise private network (EPN) using frame-relay and dial-up.
"An enterprise private network is a computer network built by a business to interconnect its various company sites (such as production sites, offices and shops) in order to share computer resources." [Enterprise private network. Wikipedia]
"Dial-up Internet access is a form of Internet access that uses the facilities of the public switched telephone network (PSTN) to establish a dialed connection to an Internet service provider (ISP) via telephone lines. The user's computer or router uses an attached modem to encode and decode Internet Protocol packets and control information into and from analogue audio frequency signals, respectively. Dial-up internet is sometimes used where Broadband internet access is not available; primarily in rural or remote areas." [Dial-up Internet access. Wikipedia]
The example "Enterprise private network" was created using the ConceptDraw PRO diagramming and vector drawing software extended with the Cisco Network Diagrams solution from the Computer and Networks area of ConceptDraw Solution Park.
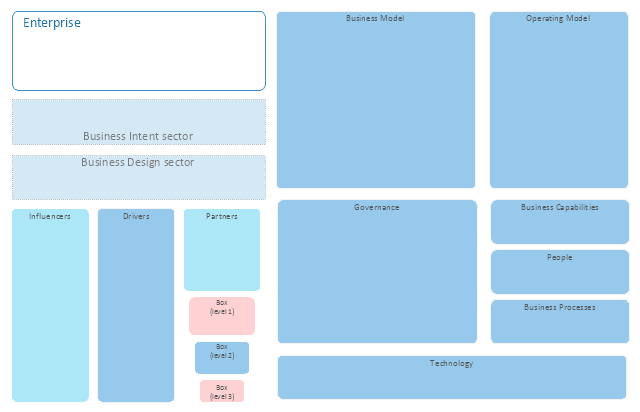
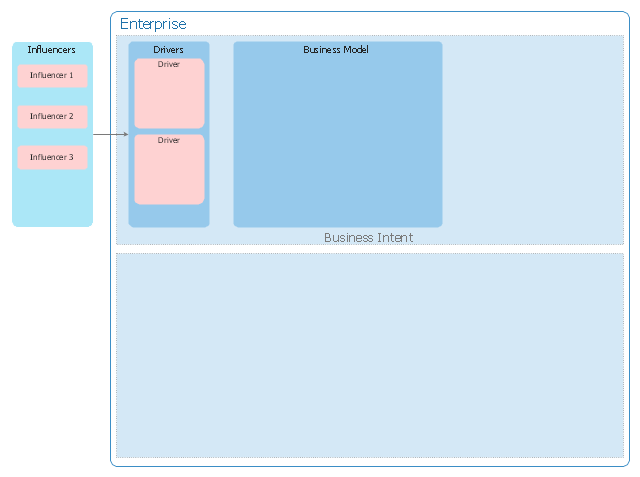
This template of enterprise architecture diagram was created according the article "helicopters and metamodels take 2" www.achurchassociates.com/ 2012/ 10/ 16/ helicopters-and-metamodels-take-2/ from the website www.achurchassociates.com, with the kind permission of Ric Hayman.
The enterprise architecture diagram template for the ConceptDraw PRO diagramming and vector drawing software is included in the Enterprise Architecture Diagrams solution from the Management area of ConceptDraw Solution Park.
The enterprise architecture diagram template for the ConceptDraw PRO diagramming and vector drawing software is included in the Enterprise Architecture Diagrams solution from the Management area of ConceptDraw Solution Park.
Business Architecture
ConceptDraw DIAGRAM is a powerful diagramming and vector drawing software. Supplied with Enterprise Architecture Diagrams Solution from the Management Area, ConceptDraw DIAGRAM is ideal for construction the Business Architecture Diagrams.- Enterprise private network | Using Remote Networking Diagrams ...
- Enterprise Architecture Diagrams | Business Architecture | IDEF ...
- Enterprise Architecture Diagrams | Data Flow Diagrams (DFD) | Data ...
- Enterprise Architect Network Topology Diagram
- Enterprise Architecture Diagrams | Azure Architecture | Visio ...
- Enterprise architecture diagram
- USDA's Enterprise Architecture
- Design elements - Azure architecture - Enterprise
- NIH IT enterprise architecture framework
- Enterprise architecture diagram template
- Network Diagram Software Enterprise Private Network | Virtual ...
- Enterprise Architecture Diagrams | Fishbone Diagrams | Fishbone ...
- Enterprise Architecture Diagrams | How to Create an Enterprise ...
- Enterprise private network
- Cara Membuat Diagram Erd Dengan Enterprise Architect
- Enterprise Architecture Diagrams | Information Technology ...
- Corporation Branch Icon
- DFD - Model of small traditional production enterprise
- Enterprise Data Architecture Diagram
