 Computer Network Diagrams
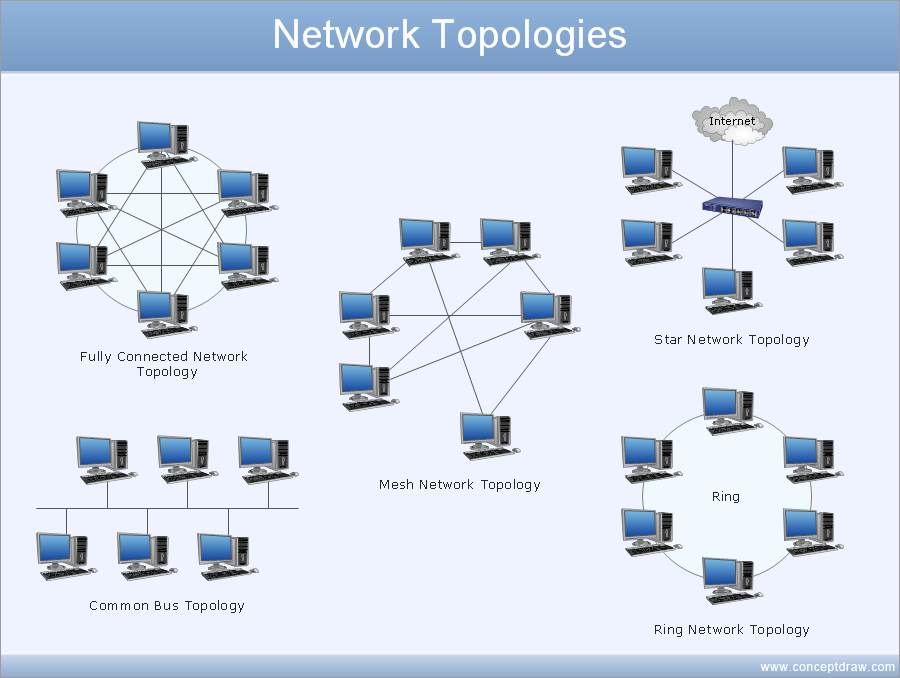
Computer Network Diagrams solution extends ConceptDraw DIAGRAM software with samples, templates and libraries of vector icons and objects of computer network devices and network components to help you create professional-looking Computer Network Diagrams, to plan simple home networks and complex computer network configurations for large buildings, to represent their schemes in a comprehensible graphical view, to document computer networks configurations, to depict the interactions between network's components, the used protocols and topologies, to represent physical and logical network structures, to compare visually different topologies and to depict their combinations, to represent in details the network structure with help of schemes, to study and analyze the network configurations, to communicate effectively to engineers, stakeholders and end-users, to track network working and troubleshoot, if necessary.
SWOT matrix template
SWOT matrix templates is part of SWOT Analysis solution from ConceptDraw Solution Park.SWOT Sample in Computers
SWOT analysis is an effective method of making the plan for evaluation the Strengths, Weaknesses, Opportunities, and Threats that are involved in a project. It is actively applied in business sphere and helps define the objective of the project. It lets detect and represent the external and internal causes for the accomplishing the project goals and business purposes, and also plays important role in formation successful and perspective business. ConceptDraw DIAGRAM is a perfect diagramming software which nicely suits for SWOT analysis and representation its results in the form of SWOT diagrams of different complexity and design, thanks to the included SWOT and TOWS Matrix Diagrams solution from Management area of ConceptDraw Solution Park. This solution contains a lot of specially designed SWOT templates, SWOT matrix samples (SWOT analysis sample, SWOT sample in computers, SWOT matrix for business sphere, SWOT matrix educational, and many others), and also ready SWOT matrix objects that allow users create their own SWOT diagrams in minutes.CCTV Network Diagram Software
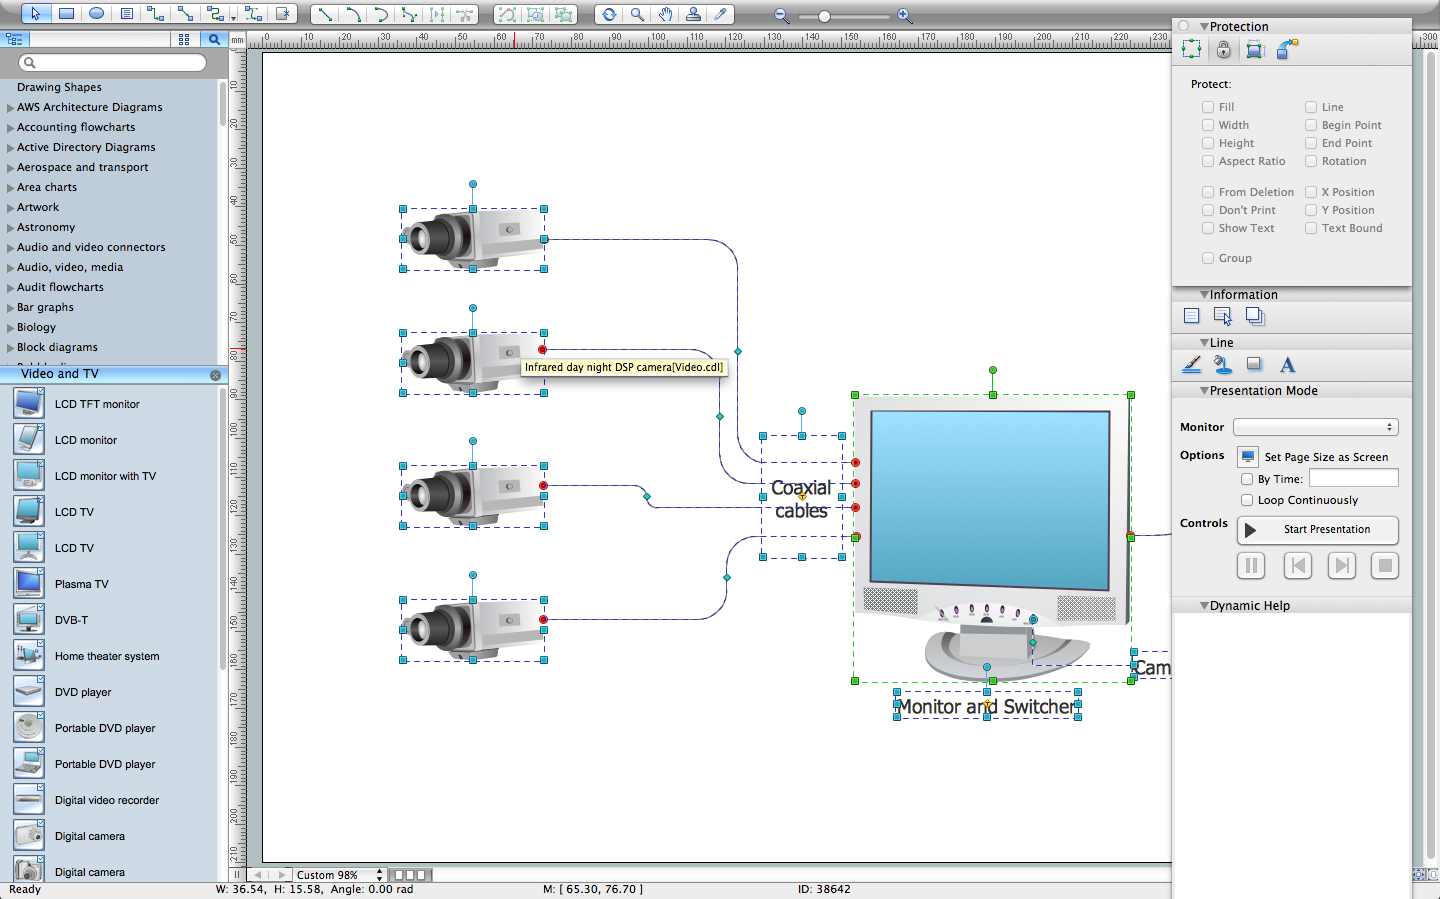
The CCTV is the process that carried out using the video cameras for transmitting the signal to the specific location, on the limited set of monitors. We are talking about the video cameras that are used for monitoring on such guarded objects as airports, banks, stores, military objects, etc. CCTV equipment is also used in the industrial installations, for surveillance in the public places, for recording the video on the digital video recorders.How to Create a PowerPoint Presentation from a SWOT Analysis Mindmap
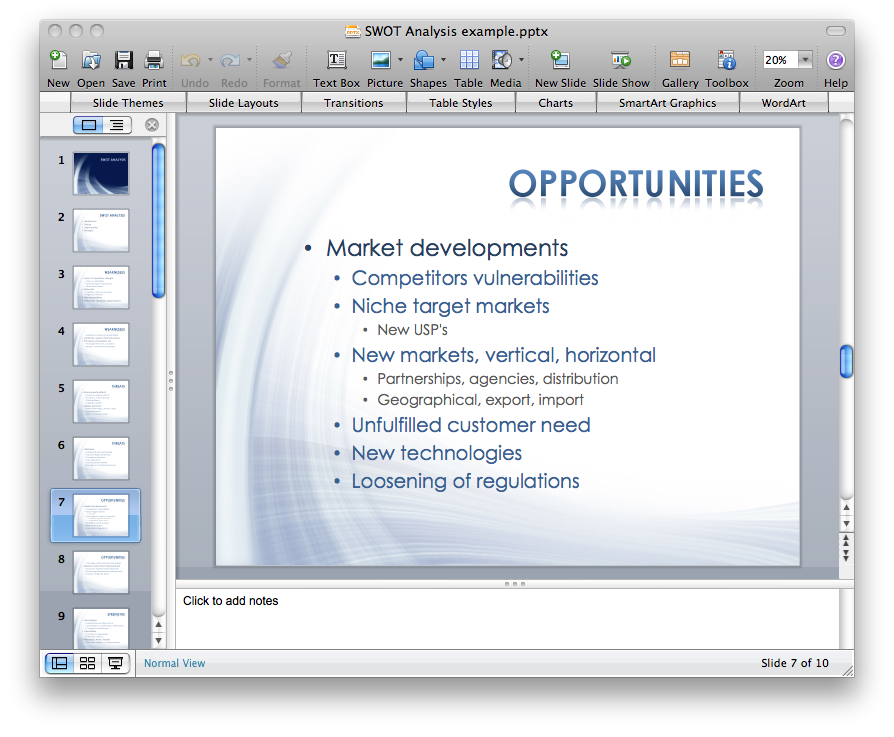
You can use SWOT analysis PowerPoint presentation to represent strengths, weakness, opportunities, and threats involved in your SWOT matrix.Fishbone Diagram Template
A causal model is an abstract concept, that describes the causal mechanisms of a system, by noting certain variables and their influence on each other, in an effort to discover the cause of a certain problem or flaw. This model is presented in diagram form by using a fishbone diagram. ConceptDraw DIAGRAM diagramming and vector drawing software enhanced with Fishbone Diagrams solution helps you create business productivity diagrams from Fishbone diagram templates and examples, that provide to start using of the graphic method for the analysis of problem causes. Each predesigned Fishbone Diagram template is ready to use and useful for instantly drawing your own Fishbone Diagram."A piping and instrumentation diagram/ drawing (P&ID) is a diagram in the process industry which shows the piping of the process flow together with the installed equipment and instrumentation. ...
P&IDs play a significant role in the maintenance and modification of the process that it describes. It is critical to demonstrate the physical sequence of equipment and systems, as well as how these systems connect. During the design stage, the diagram also provides the basis for the development of system control schemes, allowing for further safety and operational investigations, such as a Hazard Analysis and Operability Study...
For processing facilities, it is a pictorial representation of:
Key piping and instrument details,
Control and shutdown schemes,
Safety and regulatory requirements,
Basic start up and operational information." [Piping and instrumentation diagram. Wikipedia]
The piping and instrumentation diagram template for the ConceptDraw PRO diagramming and vector drawing software is included in the Chemical and Process Engineering solution from the Engineering area of ConceptDraw Solution Park.
Local area network (LAN). Computer and Network Examples
Local Area Network (LAN) is a network which consists of computers and peripheral devices connected each other and to the local domain server, and covers a little territory or small number of buildings, such as home, school, laboratory, office, etc. LAN serves for few hundreds of users. It includes many cables and wires, and demands to design previously a Network diagram. All local area network devices can use the shared printers and disk storage. ConceptDraw DIAGRAM is a perfect network diagramming software with examples of LAN Diagrams, templates and predesigned vector objects. ConceptDraw DIAGRAM is the ideal choice for network engineers and network designers who need to draw fast and easy Local Area Network Diagrams, for IT specialists, developers and other IT professionals which need to visualize the communication schemes of LAN and visually document the LAN's physical structure and arrangement in houses, offices and other buildings. Ready-to-use vector objects from Computer Network Diagrams solution will help you design LAN diagrams in minutes.
Process Flow Chart
A Process Flow Chart is a type of flowchart which is mostly used in industrial, chemical and process engineering for illustrating high-level processes, major plant processes and not shows minor details. ConceptDraw DIAGRAM diagramming and vector drawing software extended with Flowcharts Solution from the "Diagrams" Area of ConceptDraw Solution Park is the best way to create Process Flow Chart and other types of flowcharts.Cisco Security. Cisco icons, shapes, stencils and symbols
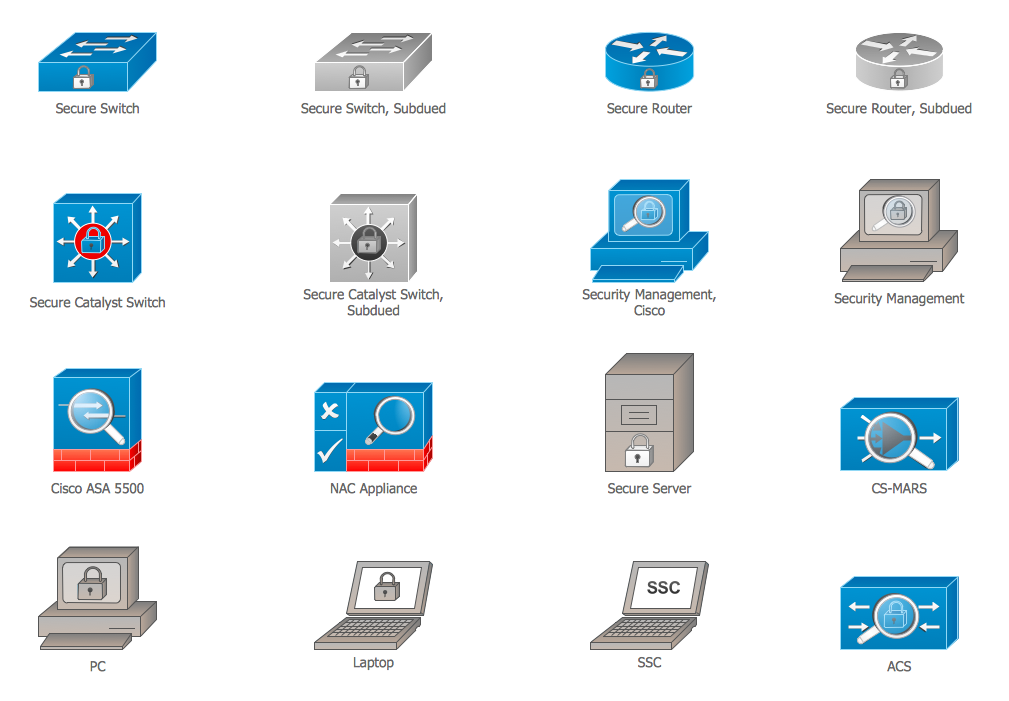
The ConceptDraw vector stencils library "Cisco Security" contains 16 symbols of security devices and equipment for drawing the computer network diagrams using the ConceptDraw DIAGRAM diagramming and vector drawing software.SWOT Analysis Tool for Small Business
SWOT analysis is effective method of making the plan to evaluate the Strengths, Weaknesses, Opportunities, and Threats involved in a project. SWOT analysis includes the specifying project objectives and attentive identifying the internal and external causes for accomplishing the main project goals. It is actively used in large and small business project management for effective and clear identifying the critical factors. SWOT and TOWS Matrix Diagrams solution is included to ConceptDraw Solution Park and contains the high-quality analysis tools. This graphical solution turns the ConceptDraw DIAGRAM software in an excellent marketing management and advertising agency software, the best SWOT analysis tool for small business or large, as you like and need. Included graphic tools, visual and project planning components make it the best marketing project management software for marketing project planning and for making marketing presentations. Use the ConceptDraw DIAGRAM to create professional and well-designed SWOT matrices in minutes.Fault Tree Analysis Example
Designing the Fault Tree Analysis (FTA) Diagrams first of all it is important to have a powerful software. ConceptDraw DIAGRAM diagramming and vector drawing software extended with Fault Tree Analysis Diagrams Solution from the Industrial Engineering Area is exactly what you need. It is also convenient to have professional looking Fault Tree Analysis example before the eyes, and it is excellent that this solution includes large collection of such examples.SWOT Analysis Solution - Strategy Tools
The condition and successful development of the company depends on how efficiently it is able to react on different outside influences. Analysis and interrelated consideration of external factors and the company's capabilities allow effectively solve appearing problems. One of the most common methods of evaluation together internal and external factors influencing the company's development is SWOT analysis elaborated for business and industry. It is a necessary element of researches and obligatory preliminary stage at the preparation of strategic and marketing plans of the company. Upon the results of SWOT analysis, we can assess does the company have the internal forces and resources to realize the existing opportunities and resist external threats, and what internal deficiencies require the prompt rectification. ConceptDraw DIAGRAM software enhanced with SWOT Analysis solution offers powerful drawing and strategy tools for effective execution the SWOT and TOWS analysis for your company with a goal of effectively realizing strategic planning and correct decision-making.TOWS Matrix
TOWS Matrix is an effective tool which allows to analize the external opportunities and threats by means of analyzing the internal strengths and weaknesses of a company. ConceptDraw DIAGRAM diagramming and vector drawing software extended with SWOT and TOWS Matrix Diagrams Solution from the Management Area will help design TOWS Matrix for your company without efforts.Best Vector Drawing Application for Mac OS X
ConceptDraw DIAGRAM creates drawings, diagrams and charts with great visual appeal in Mac OS X.Campus Area Networks (CAN). Computer and Network Examples
Campus Area Network (CAN) is a computer network which provides wireless access to the Internet or LAN for the users located in two or more buildings on the limited geographical area, or in the open space surrounding these buildings. Campus Area Network is usually set in campus of a university or college, but the same kind of planning and design can be applied for other purposes, for enterprises, office buildings, military bases, industrial complexes, public places like supermarkets, entertainment centers, etc. Another form of temporary CAN can exist during some special events such as rallies, music festivals. The elementary Campus Area Network can also arise spontaneously, due to the distance of spread the radio signals from the access points that are not limited by buildings walls. It is also sensible to have additional access points for the larger and more complex CANs, located at specially places chosen for serving clients. Design easy diagrams and schemes for the Campus Area Networks with Computer Network Diagrams solution for ConceptDraw DIAGRAM.
Software for Creating SWOT Analysis Diagrams
SWOT analysis or alternatively SWOT matrix is a simple, but useful tool for auditing an organization and its environment, for analyzing its strengths and weaknesses, opportunities and threats that can appear. A SWOT analysis can be executed for an industry, product, place, or person. It is a first stage of planning which helps the marketing specialists to focus on the key issues. SWOT analysis includes the identification of objectives of the project or business venture, specification of internal and external factors favorable and vice versa unfavorable for achievement the designated goal. ConceptDraw DIAGRAM ector graphics software enhanced with SWOT and TOWS Matrix Diagrams solution from Management area of ConceptDraw Solution Park is a powerful software for creating SWOT analysis diagrams. Ready-to-use templates, samples and examples allow create your own TOWS and SWOT matrices in minutes. The integration between ConceptDraw MINDMAP and ConceptDraw DIAGRAM applications will be also helpful for easier drawing.Household Moving Checklist
This sample was created in ConceptDraw DIAGRAM diagramming and vector drawing software using the Basic Diagramming Solution from the Universal Diagramming area of ConceptDraw Solution Park. This sample shows the household moving checklist. It's very important to make the checklist of the things when you move from one house to another. When you have the checklist your moving will be easy and simple, and you will not forget anything.Draw Network Diagram based on Templates and Examples
ConceptDraw is rapid and powerful network diagram drawing software with rich examples, templates, design objects and stencils.
Fishbone Diagram Procedure
ConceptDraw DIAGRAM diagramming and vector drawing software enhanced with Fishbone Diagrams solution from the Management area of ConceptDraw Solution Park gives the ability to draw Fishbone diagram, which identifies many possible causes for an effect for problem solving. Fishbone Diagram procedure of creation includes the set of steps easy for execution in ConceptDraw DIAGRAM.- ConceptDraw MINDMAP : Brainstorming, Mind Mapping for macOS ...
- Gym and Spa Area Plans | Gym equipment layout floor plan ...
- Design elements - Rack diagram | Rack diagram template ...
- Total Quality Management Value | Manufacturing 8 Ms fishbone ...
- Fault Tree Analysis Template
- How to Create SWOT Analysis Template Using ConceptDraw PRO ...
- How to Create a Fault Tree Analysis Diagram (FTD) in ConceptDraw ...
- LAN topology diargam | SWOT analysis diagram - Template | Rack ...
- Piping and instrumentation diagram template | Accident analytic tree ...
- Electrical Symbols — Rotating Equipment | ConceptDraw Arrows10 ...
- Aws Ppt Template
- Chemical Engineering | Design elements - Chemical engineering ...
- Root cause analysis tree diagram - Template | New Year card ...
- How to Add a Wireless Network Diagram to a MS Word Document ...
- Root cause analysis tree diagram - Template | How To Create Root ...
- SWOT analysis positioning matrix - Template | Ansoff's Matrix In Mac ...
- Marketing Diagrams | How to Make an Ansoff Matrix Template in ...
- Fishbone Diagrams | Entity-Relationship Diagram (ERD) | Rack ...
- Equipment Abbreviation


-piping-and-instrumentation-diagram-template.png--diagram-flowchart-example.png)


