Entity Relationship Diagrams
The Entity-Relationship Diagram (ERD) Solution from the Software Development Area for ConceptDraw Solution Park extends ConceptDraw PRO vector graphics and diagramming software with the ability of drawing the Entity Relationship Diagrams for visually describing the databases with Crow’s Foot and Chen's notation icons.ER Diagram Tool
Creating of Entity-Relationship Diagrams (ERDs) is a complex process that requires convenient, automated tools. ConceptDraw PRO diagramming and vector drawing software offers a powerful ER Diagram Tool - the Entity-Relationship Diagram (ERD) Solution from the Software Development Area.Design Element: Crows Foot for Entity Relationship Diagram - ERD
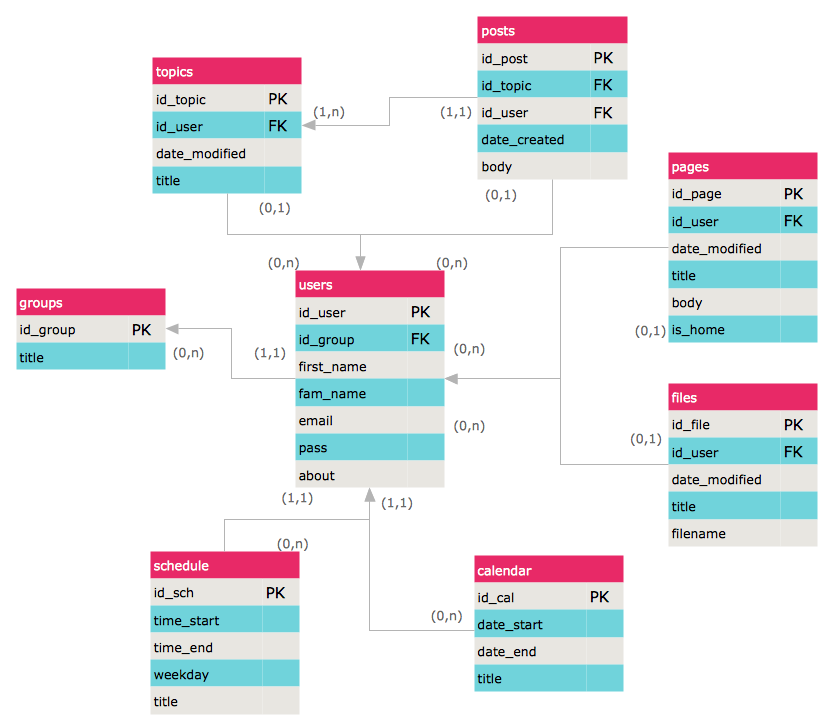
Entity-Relationship Diagram (ERD) is ideal tool that helps execute the detalization of data warehouse for a given designed system, lets to document the system's entities, attributes (objects' properties), and their interactions each other (relationships). Creation of an ERD requires the choice of specific set of notations, which the best suits for your database design. Two notations - Chen’s and Crow's Foot are applied for ERDs design. Chen's notation was developed first and has linguistic approach, the boxes represent the entities and are considered as nouns, relationships between them are shown as diamonds in a verb form. Over time Chen’s style was adapted into the popular standard - Crow’s Foot notation, where entities are shown as boxes and relationships - as labeled lines. ConceptDraw PRO software supplied with Entity-Relationship Diagram (ERD) solution offers samples and templates of ER diagrams, and also ready-to-use vector design elements - ERD Crow′s Foot and Chen's notation icons for easy designing your own ER diagrams for depicting databases.ER Diagram Programs for Mac
ConceptDraw PRO compatible Mac OS X software extended with powerful Entity-Relationship Diagram (ERD) Solution from the Software Development Area for ConceptDraw Solution Park is one of the famous ER Diagram Programs for Mac. It gives the perfect ability to draw ER diagrams for visually describing databases with Chen's and Crow's Foot notation icons.Entity-Relationship Diagram (ERD) with ConceptDraw PRO
Entity-Relationship Diagram (ERD) is applied for detailed description of structures and high-level (conceptual) design databases using the Chen's and Crow's Foot notations. An ERD represents a diagram constructed mainly of rectangular blocks (for entities, data) linked with relationships. The links between the blocks are used to describe relations between the entities. There are three types of relationships: one-to-one, one-to-many, and many-to-many. Use the specialized ERD software - ConceptDraw PRO to create the Entity-Relationship Diagrams (ERDs) of any degree of complexity with Chen's and Crow's Foot notations. Draw them easily applying the powerful built-in tools and libraries of predesigned ERD vector objects from Entity-Relationship Diagram (ERD) solution from the Software Development area of ConceptDraw Solution Park. You can also start with one of ready template or sample included to this solution. Designing the ERDs in ConceptDraw PRO you can easy move the objects within a diagram with saving the relationships between them.
ER Diagram for Cloud Computing
The entity–relationship (ER) model is a data model that lets graphically represent the information system and depict the relationships between people, objects, concepts, places, and events within a given system. It is also convenient to use the ER Diagram for Cloud computing representation and description the Cloud computing architecture, design them with pleasure using the extensive tools of the Cloud Computing Diagrams solution from the Computers and Network area of ConceptDraw Solution Park.SIPOC Diagram
SIPOC is a tool that summarizes the inputs and outputs of one or more processes in table form. You need to draw professional looking SIPOC Diagram quick and easy? Pay please your attention on ConceptDraw PRO diagramming and vector drawing software. Extended with Business Process Mapping Solution from the Business Processes Area of ConceptDraw Solution Park, it suits ideal for this.Entity Relationship Diagram Examples
ConceptDraw PRO diagramming and vector drawing software offers the Entity-Relationship Diagram (ERD) Solution from the Software Development Area for ConceptDraw Solution Park. How many examples contains the Entity-Relationship Diagram (ERD) Solution! All Entity Relationship Diagram examples were designed and saved for ConceptDraw PRO users. Now they are available from ConceptDraw STORE.Online Diagram Tool
ConceptDraw PRO diagramming and vector drawing software extended with Rapid UML Solution from the Software Development Area is a powerful online diagram tool that will help you design any types of UML diagrams simply and fast.ATM Solutions
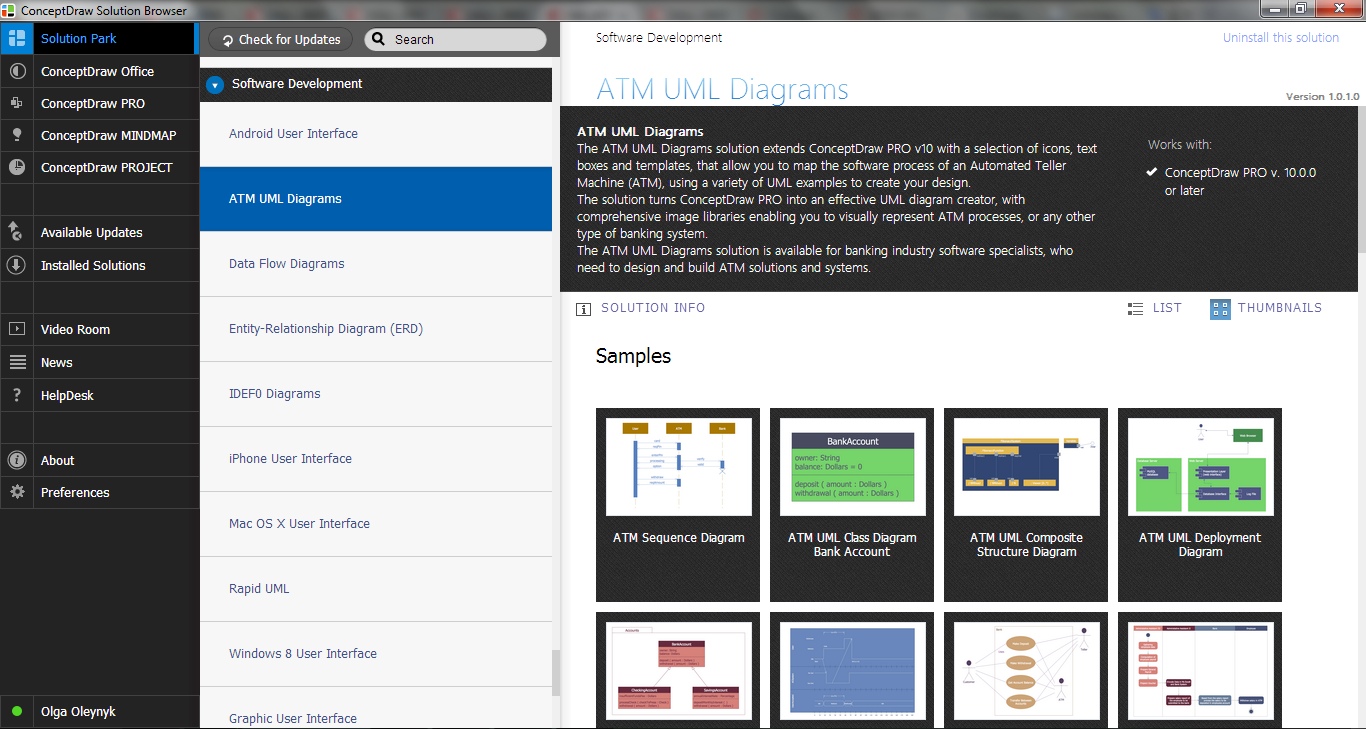
In the modern world the ATM Solutions are necessity for various software specialists, designers and developers in banking industry. ConceptDraw PRO diagramming and vector drawing software offers the unique ATM UML Diagrams Solution from the Software Development Area of ConceptDraw Solution Park.Basic Flowchart Symbols and Meaning
Flowcharts are the best for visually representation the business processes and the flow of a custom-order process through various departments within an organization. ConceptDraw PRO diagramming and vector drawing software extended with Flowcharts solution offers the full set of predesigned basic flowchart symbols which are gathered at two libraries: Flowchart and Flowcharts Rapid Draw. Among them are: process, terminator, decision, data, document, display, manual loop, and many other specific symbols. The meaning for each symbol offered by ConceptDraw gives the presentation about their proposed use in professional Flowcharts for business and technical processes, software algorithms, well-developed structures of web sites, Workflow diagrams, Process flow diagram and correlation in developing on-line instructional projects or business process system. Use of ready flow chart symbols in diagrams is incredibly useful - you need simply drag desired from the libraries to your document and arrange them in required order. There are a few serious alternatives to Visio for Mac, one of them is ConceptDraw PRO. It is one of the main contender with the most similar features and capabilities.
How To Draw an iPhone?
How To Draw an iPhone? It's very fast and easy to draw an iPhone and design iPhone user interface using the tools of ConceptDraw PRO extended with iPhone User Interface Solution. iPhone User Interface Solution offers you the incredibly large quantity of predesigned objects that are grouped to 9 libraries: Apps Icons, Bars, Content Views, Controls, iMessage, iPhone 6 Mockup, Tab Bar Icons, Temporary Views, Toolbar and Navigation Bar Buttons.Value Stream Mapping Symbols
VSM symbols are the best for a production process designing. The entire Value Stream Mapping method uses a graphical representation of the manufacturing process, factors' pros and cons, that all stakeholders can easily understand. Value Stream Mapping is a graphical technique that provides possibilities to improve analysis of a manufacturing process, at the stage of the transferring information or materials that required to deliver a product or service to the customer.How to Build Cloud Computing Diagram Principal Cloud Manufacturing
The term “cloud” is very popular and widely used now, it is a server, data processing centre, or a network which lets to store the data and software, provides access to them, allows to run applications without installation and gives the possibility to process data hosted remotely via the Internet connection. For documenting the Cloud Computing Architecture with a goal to facilitate the communication between stakeholders are successfully used the Cloud Computing Architecture diagrams. It is convenient and easy to draw various Cloud Computing Architecture diagrams in ConceptDraw PRO software with help of tools of the Cloud Computing Diagrams Solution from the Computer and Networks Area of ConceptDraw Solution Park.Sequence Diagram for Cloud Computing
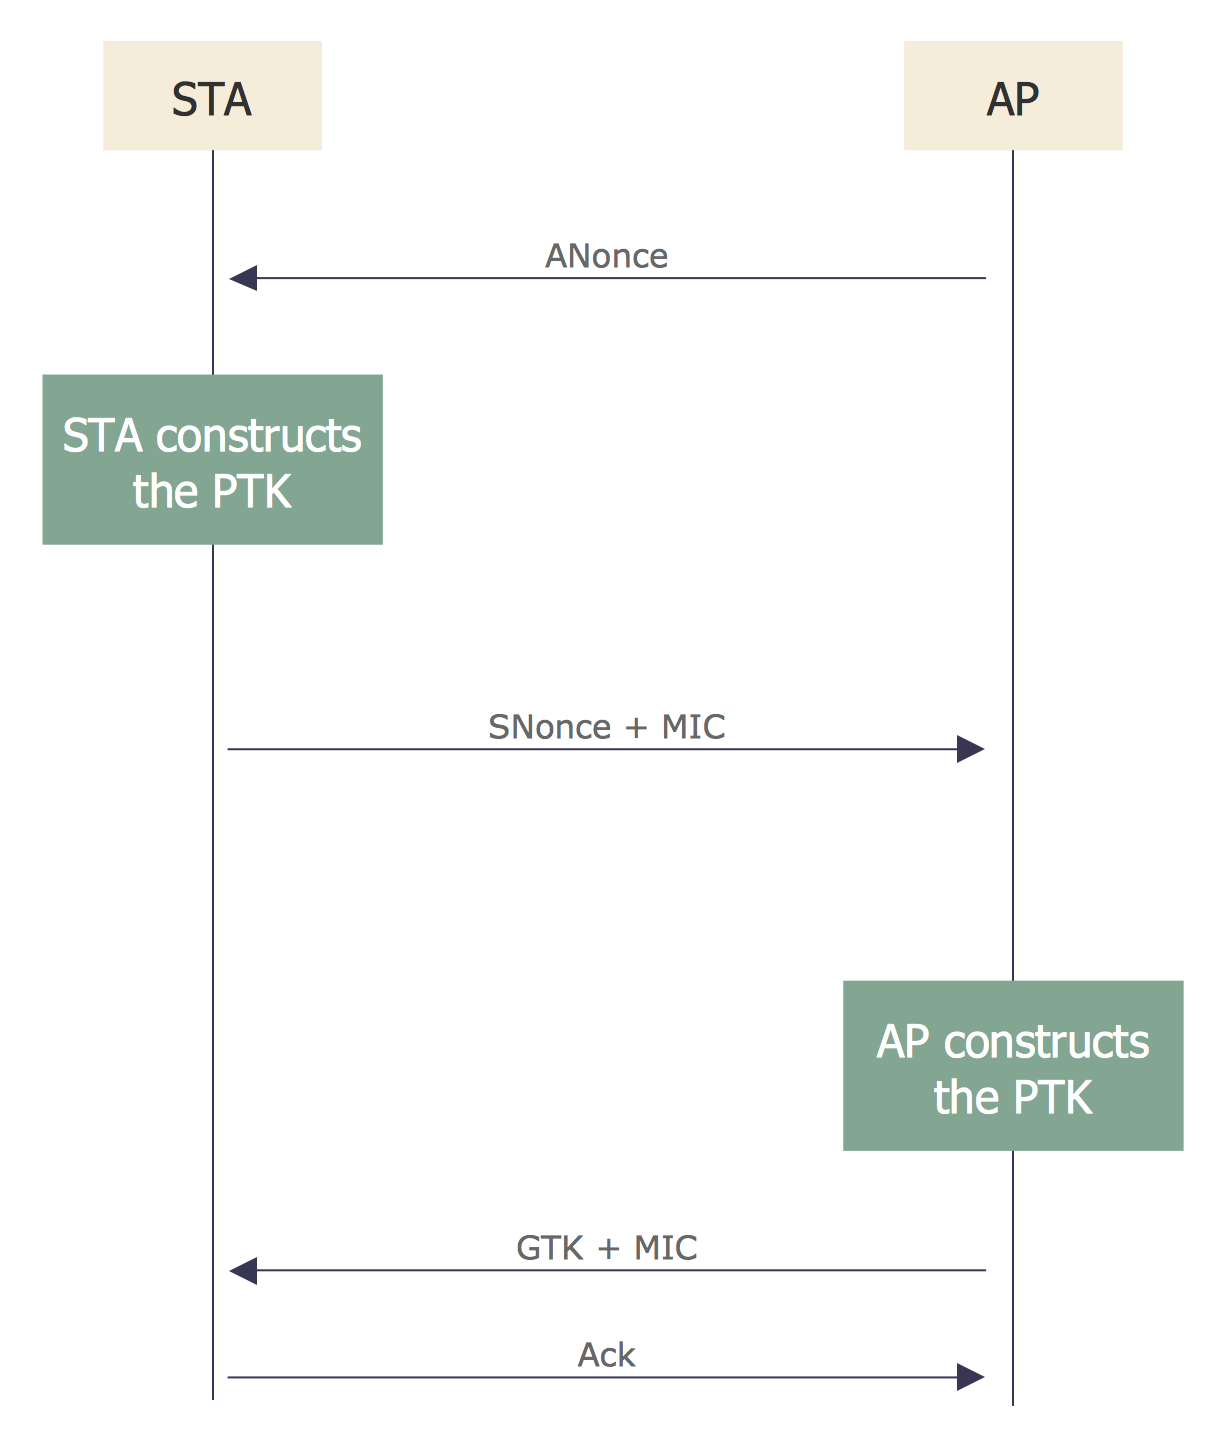
One of the ways effectively visualize what is a Cloud computing or Cloud computing architecture, is to create the Sequence diagram for Cloud computing. The ConceptDraw PRO diagramming and vector drawing software enhanced with Cloud Computing Diagrams solution from the Computers and Network area of ConceptDraw Solution Park will help you design all desired types of diagrams related with cloud computing.- Dfd Digram Of Import
- Data Flow Diagrams | ConceptDraw PRO ER Diagram Tool | Activity ...
- Er Diagram For Import Export Management Free Download Pdf
- Activity Diagram For Import Export Management System
- Import And Export Management System Er Diagram
- Import Export Management Project Flow Diagram
- Er Diagram Foe Export System Project
- Entity-Relationship Diagram ( ERD ) | ConceptDraw Solution Park ...
- Export And Import Management Diagrams
- Export Diagrams
- Diagram Of Export Pricing
- Dfd Diagram For Export System Project
- Entity-Relationship Diagram ( ERD ) | ATM UML Diagrams | Fishbone ...
- Download Er Diagram For Export System
- ConceptDraw PRO ER Diagram Tool | Data Flow Diagrams | ER ...
- Entity-Relationship Diagram ( ERD ) | Metro Map | Interactive Voice ...
- Visio Exchange | Visio Files and ConceptDraw | How To Create a ...
- Entity-Relationship Diagram ( ERD ) with ConceptDraw PRO | Entity ...
- UML Diagram Visio | Data Flow Diagrams | Entity-Relationship ...
- Data Flow Draigram For Export Information


